Transcription
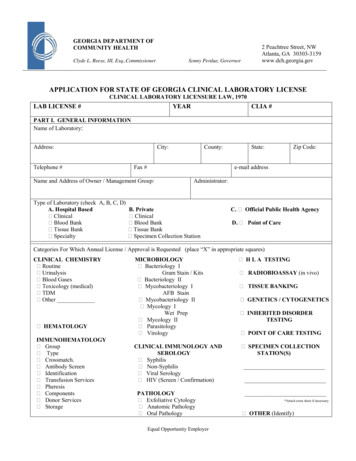
MPE Laboratory Sheet for Solid Mechanics1.0TITLETensile Test2.03.0OBJECTIVES(a)To plot the stress-strain graph from the tensile test conducted(b)To determine the following mechanical properties of the material, taken fromthe plotted stress-strain diagram: Young’s modulus, upper yield strength (𝑆𝑌,𝑈 ),lower yield strength (𝑆𝑌,𝐿 ), Ultimate tensile strength (𝑆𝑈𝑇𝑆 ), Fracture stress (𝑆𝐹 ),% of elongation, % of area reduction and Modulus of resilience,(c)To discuss the following properties with relation to the material understudied:stiffness, ductility and toughnessTHEORY3.1IntroductionWe learned from the Solid Mechanics class that the subject is about “determining stressto avoid failure”. Here, we are talking about 2 important contrasting aspects: Load vsMaterial aspect or Stress vs Strength of material. As we applied a load to a structure,we have to ensure that the resulted stress does not cross over the limit of failure. Thislimit is actually given by one of the material properties, depending on the failure thatwe are considering. For example, if we are considering yield failure, the materialproperty that sets the limit is the yield strength, 𝑆𝑌 , Some of the important materialproperties can be determined from the tensile test such as the stiffness, yield strength,ultimate tensile strength, toughness and the ductility.3.2Tensile TestTensile test is the most important test that has to be conducted when a new material isdesigned. From the tensile test, we know the important quality of the new material ascompared to the available ones. Tensile test is conducted usually on a dog-bonespecimen (see Figure 1(a)) using the Universal Testing Machine. From the dog-bonespecimen, the initial length or gauge length, 𝑙𝑜 and the initial diameter, 𝑑𝑜 are firstlymeasured. The specimen is given incremental tensile loads and deformations aremeasured at each stage. Being tabulated such as in Figure 1(b), loads are converted tostress, 𝜎 while deformations are converted to strain, 𝜀 using the following formula.1
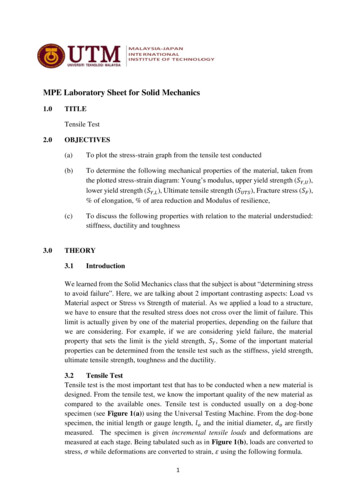
𝑃𝜎 𝐴(1)𝑜𝜀 𝑙(2)𝑙𝑜where 𝑃 is load, 𝐴𝑜 is the original cross-sectional area and 𝑙 is the elongation.Load, P Deformation, Stress, Strain, (kN)(MPa) l .80.46.030.008 . . . .Figure 1: (a) The dog-bone specimen (b) Tabulated 𝜎 𝜀 dataElastic regionThe typical plot for the mild steel specimen is as shown in Figure 2. It shows the linearstress-strain relationship at the beginning of loading until the proportional limit stress,𝜎𝑝𝑙 is reached. Within this region, the stiffness of the material is indicated by the slopeof the linear curve. This stiffness value is better known as the Young’s modulus. Therelationship between stress and strain here is known as the Hooke’s law.𝜎 𝐸𝜀(3)Given further loading, the stress will reach yield stress, 𝜎𝑌 that shows the end of elasticregion or the beginning of plastic region. Elastic region is where specimen returns to itsoriginal position when the load is released. For low carbon steel, we have the upperyield stress, 𝜎𝑌,𝑈 and lower yield stress, 𝜎𝑌,𝐿 .Figure 2: The 𝜎 𝜀 curve for low carbon steel2
Plastic regionFollowing the elastic region is the plastic region where entering this region, materialwill have permanent deformation. Permanent deformation is considered a failure ofmaterial and thus the value of the yield stress (𝜎𝑌 ) is also called the yield strength, 𝑆𝑌 .Given further loading after yielding, the material will go through strain hardeningprocess until it reaches maximum stress that is called the ultimate tensile stress, 𝜎𝑢𝑡𝑠 .The presence of the 𝜎𝑢𝑡𝑠 indicated the beginning of necking or fracture of the specimenwhich means the breakage or collapse failure has occurred. As such the property 𝜎𝑢𝑡𝑠is also called the ultimate strength, 𝑆𝑢𝑡𝑠 . Furthering the load, the specimen will fractureat a lower fracture stress value of 𝜎𝑓 .DuctilityMaterial that has big plastic region before breaking is called ductile material whilematerial having no or small plastic region is called brittle material. Low carbon steeland cast iron are examples of ductile and brittle material, respectively. The ductility ofa material is measured using the following 2 properties:% of elongation 𝑙𝑓 𝑙𝑜𝑙𝑜% of area reduction 𝑥 100%𝐴𝑜 𝐴𝑓𝐴𝑜𝑥 100%(4)(5)ToughnessToughness is the amount of energy a material can absorbed before failure occurs. Intensile test, energy absorbed comes from the work done by the applied tensile load.This energy is the potential energy similar to potential energy absorbed by a springwhen it is loaded. For solid material, this potential energy is called strain energy, 𝑈.From Applied Solid Mechanic subject we learned that 𝑈 is area under the force, F vsdeformation curve while the strain energy density, 𝑢 is area under the 𝜎 𝜀 curve. Twoimportant properties with regard to toughness of a material, see Figure 3 are: theModulus of resilience, 𝑢𝑟 which is the amount of 𝑢 a material absorbs before yieldingand the Modulus of toughness, 𝑢𝑡 which is the amount of 𝑢 a material absorbs before itfractures.Figure 3: (a) Modulus of resilience, 𝑢𝑟 (b) Modulus of toughness, 𝑢𝑡3
4.0GENERAL EQUIPMENT DESCRIPTIONThe equipment set used in this experiment, shown in Figure 4 is as the following:Name: Shimadzu Universal Testing MachineModel: UH-X/Xh 200kN 1000kNManufacturer: Shimadzu CooporationYear: 2011The Shimadzu universal testing machine consist of 3 major parts: Load frame,measurement controller and computer (not shown). The components of each part andtheir roles are given in Table 1.121324334556Load FrameMeasurement ControllerFigure 4: The Shimadzu Universal Testing Machine4
Table 1: Components of the Shimadzu Universal Testing Machine and their rolesNoNameRemarkLOAD FRAME1Upper CrossheadCan be adjusted according to specimen length2Grip open-closeClose: Turn it clockwisehandleOpen: Turn it counter clockwise3Elevation motorTo elevate upper and lower cross-head4Lower CrossheadMoving it up and down to adjust test interval5Table-6RamUnder the tableMEASUREMENT CONTROLLER123Analog forceThe measured test-force is represented as aindicatorneedle positionPeak hold indicationScale graduationindication4The highest test-force value ever taken is heldand shown hereA five equally divided points of the full scale(as for 300 kN model at six equally dividedpoint), digital test-force values are shownDigital forceThe current test-force is indicated as a digitalindicatorvalue.The LCD display of the operation unit notonly displays information such as the test5Operation Unitconditions, but also allows the test conditionsto be input on the touch panel installed onscreen surfacesSafety reminder1. To avoid finger pinch, do not put hands inside the crossheads when opening andclosing the grips.2. To avoid injury by fractured specimen pieces, keep away from loading unit whenthe test is doing.5
3. At the end of each test, be sure to set the load control knob to the “RETURN”position and lower the ram to its lowest position.5.0EQUIPMENT OPERATING PROCEDUREThe following is the manual test operating procedure that consists of operation flowand tensile test.Operational FlowWarm-up operation(Refer to Manual 4.1)Adjusting Hold positionof load control knobAdjustment is needed only when the hold position does notmatch the position indicated on the LCD display (Refer toManual 3.3.3).Calibration the testforce amplifierCalibrate once per day after starting the testing machine(Refer to Manual 4.2).Repositioned the UpperCrossheadAdjust the position of the upper crosshead according tothe length of the test specimen (Refer to Manual 3.7).Select and attached thegrip jaws or the platenFor the tensile test, select the grip jaws that fit the type(rod or plate) and size of the specimen and attached it inthe grip jaw holder (Refer to Manual 3.8).Set the range of theAnalog Force IndicatorSelect the range depending on tests (Refer to Manual 4.3).Set the external analogvoltage outputSet the external analog voltage output, if an analogrecorder is connected (Refer to Manual 3.4.12).Start the testStart the test in Manual mode.6
Tensile Test1. Return the ram to its initial position by operating the load control knob. When theram is set in the initial positon, “READY” is shown in the operating status displayof the LCD display.2. Grasp the test specimen with the upper grip jaw.3. Adjust the test force zero point (needed only when the zero point setting is incorrect)4. Reset the stroke to “0”. Touch the ZERO key above the position indication on theLCD display.5. Move the lower crosshead to a proper position, then press the lower GRIP switchto have the lower grip jaw to grasp the test specimen.6. Press the [START] key on the operation keypad.7. Change to the manual mode, and turn the load control knob gradually toward“OPEN” to apply load.8. Turn the load control knob further toward “OPEN” to increase the load until thespecimen comes to a break.9. When the specimen comes to a break, return the load control knob to the “HOLD”position.10. Press the lower OPEN switch. The lower gripper opens to release the specimen.11. Press the upper OPEN switch. The upper gripper opens to release the brokenspecimen.12. With the load control knob kept in the “HOLD” position, press the RETURN key.The ram returns to its initial position with “READY” shown in the operating statusdisplay. After confirming that “READY” is shown, change to the Manual mode.13. Read the maximum test-force value on the peak test-force value display.14. If desired, continue the test by following Attach the specimen and later in theOperational Flow.6.0EXPERIMENTDesign the experiments in order to meet the given objectives.7.0RESULTS AND DISCUSSIONShow the results appropriately in the form of table, graph or others. Conduct theappropriate analysis and discuss the finding.Data taken from the experiment need to be stamped by lab officer.7
8.0REPORTSubmit the FORMAL REPORT within 7 days from this experiment. Report must betyped. Similarity test will be conducted using Turnitin where similarity index of 20%is considered passing mark. Formal report must contain the following standard content:1. Title2. Objective3. Introduction and Theory4. Apparatus5. Procedures6. Data and results7. Analysis and discussion8. Conclusion9. ReferencesRefer to the provided front cover for the distribution of marks.8
Tensile test is the most important test that has to be conducted when a new material is . Data taken from the experiment need to be stamped by lab officer. 8 8.0 REPORT Submit the FORMAL REPORT within 7 days from this experiment. Report must be typed. Similarity test will be conducted using Turnitin where similarity index of 20%