Transcription
13th World Conference on Earthquake EngineeringVancouver, B.C., CanadaAugust 1-6, 2004Paper No. 311THE TENSILE TESTS OF NATURAL RUBBER BEARINGS FOCUSEDON THE EFFECT OF THE STEEL FLANGE PLATESMineo TAKAYAMA1, Kenjiro OKA2 and Ryuichi KATO3SUMMARYThis paper presents the experimental results from the tensile loading of laminated rubber bearings that areused for the base-isolated buildings. The tensile tests are carried out to understand the mechanicalcharacteristics of Natural Rubber Bearings (NRB) under tensile stress up to –1N/mm2 as the usual designlimit. The vertical and horizontal characteristics are investigated as to the effect of flange plate thicknessand the scale effect. These characteristics are evaluated by the tensile-compressive tests under constantshear strain and the shear tests under constant tensile stress or strain. For the effect of flange platethickness, the flanges with different thickness are used for 500mm in diameter of NRB. For the scaleeffect, NRB with a diameter of 500mm and 1000mm of the same shape factors are used. From the testsresults, it is found that the tensile stiffness is sensitive to the flange plate thickness, the shear stiffnessunder tensile stress –1N/mm2 is not influenced by neither the tensile condition nor flange plate thicknessand the scale effect in small tensile region is small.1. INTRODUCTIONRecently, the application of the base-isolated system using laminated rubber bearings is spreading to verytall buildings and also to various shapes of the buildings. But when a strong earthquake hits the tall baseisolated building, there may happen that the columns at outside of the building are pulled up and thetensile load may act on the laminated rubber bearings. Consequently, the research for the characteristicsof laminated rubber bearings subjected to tensile load is now focused. But, neither testing methods for thetensile characteristics nor the shapes of specimens are standardized.Therefore, the standardized tensile tests for laminated rubber bearings (Natural Rubber Bearing, HighDamping Rubber bearing and Lead Rubber Bearing) with different rubber materials and shapes werecarried out by the technical committee of Japan Society of Seismic Isolation (JSSI) (Iwabe [1]). Thepurpose of these tests was to grasp the tensile property, the ultimate capacity, the change of basiccharacteristics and the breaking performance before and after each tension loading.1Assoc. Prof., Dr. Eng., Faculty of Engineering, Fukuoka University, Japan. E-mail:mineot@fukuokau.ac.jp2Kurashikikako Co, Ltd, Japan. E-mail:okaken@kuraka.co.jp3Kurashikikako Co, Ltd, Japan. E-mail:katoh@kuraka.co.jp
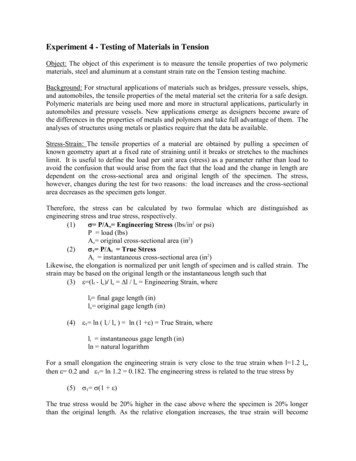
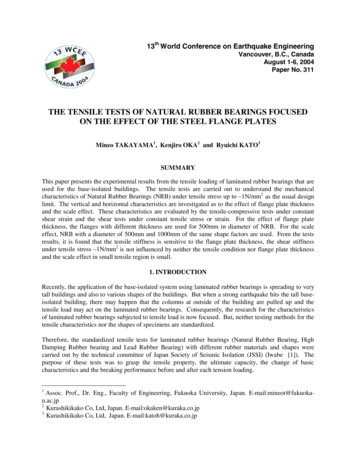
The laminated rubber bearings are consisted of the part of rubber and flange plates: The part of rubber isvulcanized and bonded between rubber layers and thin steel plates (inner plates) alternately and flangeplates are needed to fix to the foundation and the building. The mechanical characteristics of thelaminated rubber bearing depend on the primary shape factor S1 and the secondary shape factor S2. So, asa design rule, it is common that the values of S1 and S2 are fixed from small to large size of the laminatedrubber bearing. But recently, it is found that the characteristics of laminated rubber bearings areinfluenced by not only S1 and S2 but also the specification of flange plate, inner plate and so on(Hamaguchi [2], Muramatsu [3]). Especially, as for laminated rubber bearings subjected to tensile load,the influence of deformation of the flange plate would be important. But usually the specifications of theflange plates and inner plates are not perfectly proportional because of the limitation of the production.Therefore, in this study tensile tests were planned to carry out to investigate the effect of the thickness offlange plates on the mechanical characteristics and the scale effect. The specimen is Natural RubberBearings (NRB) and it is considered that test condition is tensile stress up to –1N/mm2 that is the usualdesign limit of base-isolated buildings. In this paper, the tests for NRB were performed to investigate (1)Vertical/horizontal characteristics, (2) Scale effect and (3) Effect of the thickness of the flange plate undertensile stress 1N/mm2. These characteristics are evaluated by (a) Tensile-compressive tests under constantoffset shear strain and (b) Shear tests under constant tensile stress or strain. For the effect of flange platethickness, the specimens with the different flange plates are tested for 500mm in diameter of specimens.For the scale effect, specimens with a diameter of 500mm and 1000mm of the same shape factors aretested. In this paper, the test results under small tensile deformation (tensile small deformation tests) arereported in addition to the results of the tensile tests under offset shear deformation (tensile largedeformation tests) by JSSI. Besides, tensile stress level is expressed by negative (–).2. SPECIMENSFig. 1 shows the shape of a test specimen. The laminated rubber bearing consists of main body and flangeplates. They are tied with bolts. The main body is comprised of rubber layers, thin steel plates (innerplates) and two connecting steel plates at top and bottom bonded together. The shape of laminated rubberbearings is decided by the diameter D, the thickness of a rubber layer tR, and the numbers of the rubberlayers n. The primary shape factor is defined as S1 (cross section /surface area of a rubber layer) D/4tR,whereas the secondary shape factor S2 (diameter of a rubber layer/total rubber thickness) D/(n tR). S1is an index which shows the effect of the restrain of the inner plates which brings large vertical stiffnessand load capacity of the laminated rubber bearings, and the factor which influences the change ofhorizontal stiffness according to compressive stress. S2 is the factor that influences the bend and thecapacity of horizontal deformation of the laminated rubber bearings. All the specimens have no centralholes, S1 is 33, S2 is 5.1, and they are proportional. The diameter of the inner plates is larger than thediameter of the rubber: so-called exposure type. The shear modulus G of rubber material is 0.44 N/mm2.The specification of test specimens in detail is described in Table 1.In tensile large deformation tests by JSSI, the given tensile strain was up to 100%, specimen is 500mm indiameter of rubber and with the flange plates of 25mm thickness (Specification B). In tensile smalldeformation tests under tensile stress up to –1N/mm2, specimens are 500mm in diameter of rubber andwith three thickness of flange plates 20mm (Specification A), 25mm (B) and 36mm (C). The specimen of1000mm in diameter of rubber is used to investigate the change of characteristics by the scale effect. Thethickness 36mm of the flange plates of 1000mm in diameter of rubber and the thickness 20mm of 500mmis almost proportional.
12345678910Table1 Specification of test specimensNB45NB45-500Specification of NRB1000ABCShear modulus0.440.44G(N/mm2)Diameter of a rubber5001000layer D(mm)Thickness of a rubber3.757.5layer tR(mm)Number or rubber2626sheets nTotal rubber thickness97.5195.0L [ n tR](mm)Primary shape33.333.3factor S1Secondary shape5.15.1Factor S2Diameter of a flange7801400plate Df(mm)Thickness of a flange20253636plate tf1(mm)Bolt hole P.C.D. of a6901265flange plate Dfp(mm)DfDfptf1DtRFig.1 Shape of a test specimen3.TESTING METHODS3.1 Testing apparatusThe experiments were accomplished by the use of a compressive/tensile-shear testing apparatus. Thespecification of testing apparatus is that the compressive load capacity is 15MN, horizontal load capacityis 4MN and horizontal stroke is 500mm.The horizontal load, vertical load, horizontal displacementwere measured with load cells and displacement sensor of testing apparatus. Vertical displacement wasmeasured with external displacement sensor close to the specimens.3.2 Test conditions(1) Tensile large deformation tests (tensile tests under offset shear deformation)Under the constant shear deformation (offset shear), specimens were subjected to the tensile deformation.The cyclic tension of 10 times was subjected under 4 levels of offset shear strain: 0, 100, 200 and 300% oftotal rubber thickness. The tensile strain was set as 5, 10, 25, 50, 75 and 100% of 6 levels. The basiccharacteristics of vertical and horizontal stiffness were measured before and after each level of tensiledeformation. Finally, the breaking or buckling characteristics was examined by the compressive shearingtest for the specimen that experienced the tensile strain up to 100%. The experimental research regardingthe effect of tension for laminated rubber bearings was enforced by the technical committee of JapanSociety of Seismic Isolation (JSSI). The device makers that cooperated to this experiment were 6companies. The specimens used in this research were 7 types consisted of Natural Rubber Bearing, HighDamping Rubber bearing and Lead Rubber Bearing. The diameter of specimens is about 500mm, theprimary shape S1 is about 30, and the secondary shape S2 is about 5.(2) Tensile small deformation testsTensile small deformation tests consist of (1) tensile and compressive test subjected to the loading fromtensile to compressive continuously under the constant shear deformation, (2) shear test under the constant
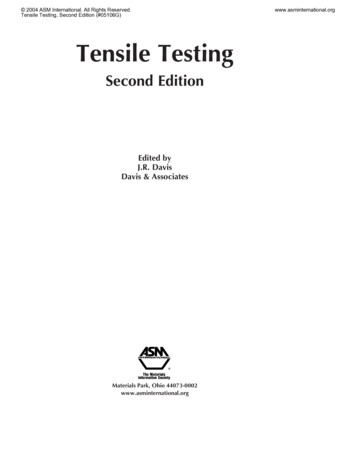
tensile stress or strain and (3) simple tensile test. The procedure of tensile small deformation tests issummarized in Table 2. The basic characteristics were checked between tensile tests in order to observethe change of vertical and horizontal stiffness before and after subjected to tensile load.As for the tensile and compressive tests under the constant shear deformation, vertical load equal to –0.5 10 N/mm2 and –1.0 10 N/mm2 stress were applied under the shear deformation set as 0, 100 and 200%in strain. As for shear test under the constant tensile stress or strain, the horizontal deformation equal to 100%, 200% and 250% in shear strain were applied under the tensile stress set as 0, –0.5, –1.0 N/mm2of three levels and the tensile strain set as –10 and –25% of two levels. However, the specimen of1000mm in diameter of rubber was not subjected to the horizontal deformation equal to 250% in strain.As for simple tensile test, the tensile deformation equal to –50, –75 and –100% in strain of three levelswere applied. The cyclic deformation of 5 times was subjected in each tensile test. The tests for the basiccharacteristics were carried out to evaluate the compressive stiffness under vertical load equal to15N/mm2 30% in stress and the horizontal stiffness under vertical load equal to 15N/mm2 in stress withhorizontal displacement equal to 100, 200 and 250% in strain. The cyclic deformation of 3 times wassubjected in each test. Moreover, the slit was installed in the testing apparatus to measure the deflectionof the lower flange plate in each test. The measuring points are shown in Fig. 2. Three sensors werearranged at the center, in the middle and at the end (close to the bolt) of the flange plate. The horizontalloading direction is shown as the arrow in Fig. 2. The direction of the sensor array was rotated by 22.5degrees from the loading direction in order to avoid the interference with fastening bolts.Table2 Procedure of tensile testsInitial basic characteristics testEvaluation of vertical and horizontal stiffnessunder compressive stressR700mmR390mm Offset tensile-compressive test [Tensile test A]Evaluation of vertical stiffness for tensile andcompressive loading under constant shear strainShear test under constant tensile deformationEvaluation of horizontal stiffness under constanttensile stress or strainSlit Basic characteristics test 1Evaluation of vertical and horizontal stiffnessunder compressive stress after small tensiledeformation Simple tensile test [Tensile test B]Evaluation of vertical characteristics for largetensile deformation Basic characteristics test 2Evaluation of vertical and horizontal stiffnessunder compressive stress after large tensiledeformationTesting apparatusR700mm: Radius of flange plate for D 1000mm[ Measuring point No.1, 3, 4 ]R390mm: Radius of flange plate for D 500mm[ Measuring point No.1, 2, 3 ]Fig.2 Measuring points of deflection
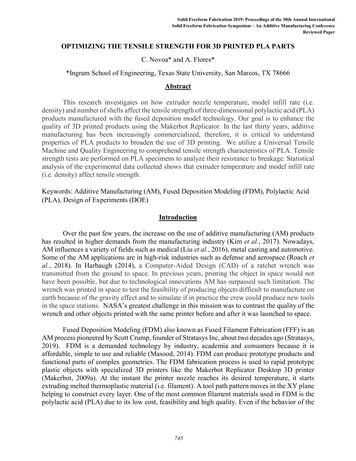
3.3 Evaluation of vertical and horizontal characteristicsThe method of evaluation of vertical stiffness and horizontal stiffness is shown in Fig. 3. Thecharacteristics in each test were evaluated by effective stiffness using the maximum, the minimum loadvalue, and the maximum, the minimum displacement value. However, the compressive stiffness in thetests for the basic characteristics was obtained using the load and displacement value under vertical loadequal to stress of σ 30%. The results of tensile small deformation tests for 500mm and 1000mm indiameter of rubber are converted to confirm the scale effect as follows. The apparent tensile elasticmodulus Et and compressive elastic modulus Ec are defined as Eq.(1) with the tensile stiffness Kvt and thecompressive stiffness Kvc. The relation between horizontal stiffness Kh and the shear modulus G is definedas Eq.(2).E Kv h/AG Kh h/A(1)(2)where h total thickness of all rubber layers and A sectional area of rubber. The vertical stress σ isobtained from dividing the vertical load P by the sectional area A of rubber and the vertical strain ε isobtained from dividing the vertical displacement Y by the total thickness h of rubber. The shear stress τ isobtained from dividing the horizontal load Q by the sectional area A of rubber and the shear strain γ isobtained from dividing the horizontal displacement X by the total thickness h of all rubber layers.502(a)50150Ymin(b)QmaxHorizontal Load QVertical Load PPmaxXmin-300XmaxQmin-3PminYmax50--30Vertical Displacement YPmaxVertical Load P400Horizontal Displacement X(c)(a)Compressive stiffness Kc Pmax/YmaxTensile stiffnessKt Pmin/Ymin(b)Horizontal stiffnessKh (Qmax-Qmin)/(Xmax-Xmin)(c)Compressive stiffness [Basic characteristic]Kv ical Displacement YFig.3 Evaluation of vertical and horizontal stiffness4.RESULT4.1 Tensile large deformation tests (tensile tests under offset shear deformation)Fig. 4 shows the specimen under tensile strain of 100% with shear strain of 200%. It shows that thecentral region of the specimen is constricted, because the inner plates generate the rotation by the increase
2Tensile stress σ (N/mm )of the bending deformation of rubber layers. The strain distribution of upper and lower rubber layers isnot uniform under the shear deformation. Fig. 5 shows the tensile stress-strain curves under constantshear strain of 100%. The stress-strain curve is almost linear below tensile strain of 10%. But when thestrain exceeds 25%, the curves become to bend and show the characteristics like yield of materials. Fig. 6shows the tensile stress-strain curves under constant shear strain of 0, 100, 200 and 300%. As the shearstrain increases, the tensile yield stresses decrease and tend to increase the slope of the curves. Specimensdid not break under the shear strain of 0, 100 and 200%, but it broke under the shear strain of 300% andbreaking tensile strain was 48%. The results of these test and the tests for Natural Rubber Bearing, HighDamping Rubber bearing and Lead Rubber Bearing by the technical committee of Japan Society ofSeismic Isolation (JSSI) as a function of shear strain are shown in Fig. 7. The failure interaction curve isobtained by the results of all tensile tests and average breaking strain of 400% in compressive shearingtest. It became clear that the laminated rubber bearing has large capability for tensile deformation. Theresults of tests for the basic characteristics before and after each level of tension deformation are shown inFig. 8. With increasing tensile deformation from 5% to 100% in strain, the change of compressivestiffness and horizontal stiffness is small before and after the tensile tests. Finally, Fig. 9 shows the shearstress-strain curve for breaking test under 10N/mm2 in compressive stress for the specimen that had beensubjected to the 100% in tensile strain under 0% in shear strain. The shear strain at break is 427%, whichis larger than the average of initial break strain. This seems to mean the ultimate shear deformationcapacity under usual compressive load is maintained after the experience of tensile deformation.0.5γ 100%0.0-0.5-1.0-1.5ε 5%-2.0100 % 75 % 50 % 25 % 10 %-2.5-120 -100-80-60-40-20020Tensile strain ε (%)Fig.5 Tensile stress-strain curve0.53000.0250Tensile Strain ε (%)2Tensile stress σ (N/mm )Fig.4 NRB under tensile deformation-0.5-1.0-1.5-2.0γ 0% 100 % 200 % 300 %-2.5-200-1000100200300Tensile strain ε (%)Fig.6 Tensile stress-strain curve400 NRB : Breaking HDR : Breaking〇NRB : Non-Breaking HDR : Non-Breaking LRB : Non-Breaking NRB : Breaking * NRB : Non-Breaking *2001501005000100200300Shear Strain γ (%)400* : Other testsFig.7 Results of tensile tests by JSSI
σ 10 20N/mm1300Shear Modulus G (N/mm2)Elastic Modulus Ec(N/mm2)1400212001100γ 0%γ 100%γ 200%10009000204060800.602σ 10N/mm ,γ 100%0.550.500.450.40γ 0%γ 100%γ 200%0.350.30100020Tensile Strain ε(%)406080Tensile Strain ε(%)100(a)Compressive stiffness(b)Horizontal stiffnessFig.8 Basic characteristics before and after tensile testσ 10N/mm22Shear Sress τ (N/mm )65432100100200300400500Shear Strain γ (%)Fig.9 Breaking characteristic after tensile test4.2 Tensile small deformation testsFirst the deviation of the basic characteristics of the specimens is checked. The results of the initial basiccharacteristics are shown in Table 3. The deviation of the vertical and horizontal stiffness of allspecimens is very small. Especially, the difference between the design value and measured value of thehorizontal stiffness is about 1% under γ 100% in shear strain.D (mm)Table3 Initial basic characteristicsG (N/mm2)2Tf1 (mm)Ec (N/mm )γ 100%γ 0.410γ 250%0.4190.4150.41610003612130.4450.4190.423(1) Offset tensile-compressive testThe results of offset tensile-compressive tests for the specimen of rubber diameter 500mm with the flangeplate thickness 20mm is shown in Fig. 10. That shows the vertical stress-strain curves for vertical stressof 10 –1.0N/mm2 under 0, 100 and 200% in offset shear strain. It can be understood that the tensilestiffness as well as the compressive stiffness reduces as the offset shear strain increases. Fig. 11 shows
212Vertical Stress σ (N/mm )2Vertical Stress σ (N/mm )the vertical stress-strain curves for simple tensile-compressive test for 500mm specimen with the flangeplate thickness 20mm and 36mm. That shows the tensile characteristic strongly depends on the flangeplate thickness. Fig. 12 and Fig. 13 show the tensile stiffness (elastic modulus E) of 500mm specimenswith the three different flange plates as a function of shear strain. The thicker the flange plate is, thehigher the tensile stiffness is. But the difference of the flange plate thickness 20mm and 25mm is small.The tensile stiffness of the specimen with the flange plate thickness 36mm is more than twice of that withthe flange plate thickness 20mm under the vertical stress of –0.5N/mm2, but the difference is smallerunder the vertical stress of –1.0N/mm2. This phenomenon can be understood that the tensile stiffnessreduced under –1.0N/mm2 because the tensile yield of the rubber got dominant as shown in Fig. 14. Fig.15 shows the vertical stress-strain curves at offset shear strain 200% for 500mm and 1000mm specimens.They are almost similar. Further Fig. 16 shows the tensile stiffness for 500mm and 1000mm specimen asa function of shear strain. The tensile stiffness of the 1000mm specimen is a little lower than that of the500mm specimen. The difference seems to come from the fact that the details of the flange plates andinner plates are not perfectly proportional. The relation between the number of times of a repetition andthe tensile stiffness is shown for 500mm specimens with different flange plates in Fig.17. The change oftensile stiffness of two different specimens is very small under tensile stress of –0.5N/mm2. The tensilestiffness of the specimens with the flange plate thickness 36mm decreases remarkably in comparison withthat of the flange plate thickness 20mm under tensile stress of –1.0N/mm2. The reason is that thedeformation of the part of rubber is dominant by the thick flange plate. So, it seems that if the thickness ofthe flange plate is decided properly, the repeated deformation dependence will reduce.γ 0% γ 100% γ 200%10D 500mmσ - 1.0 10 N/mm2tf1 20mm86420-2-6-4-202Vertical Strain ε (%)4121086420-2-4D 500mm2σ -1.0 10 N/mmγ 0%tf1 20mmtf1 36mm-462Elastic Modulus E (N/mm )2Elastic Modulus E (N/mm )1005000100200-1012Fig.11 Vertical stress-strain curvesD 500mm,tf1 20mm〃 〃25mm〃 〃36mm150-2Vertical Stress ε (%)Fig.10 Vertical stress-strain curves200-3300Shear Strain γ (%)Fig.12 Tensile stiffness under σ -0.5N/mm2200D 500mm,tf1 20mm〃 〃25mm〃 〃36mm1501005000100200300Shear Strain γ (%)Fig.13 Tensile stiffness under σ -1.0 N/mm2
2Vertical Stress σ (N/mm )0.0D 500mmtf1 36mm-0.5-1.0σ -0.5N/mm-1.522σ -1.0N/mm-2.0-2-1.5-1-0.50Vertical Stress ε (%)2Elastic Modulus E (N/mm )2Vertical Stress σ (N/mm )Fig.14 Vertical stress-strain curves in tension121086420-2-42σ -1.0 10 N/mmγ 200%D 1000mmD 500mm-5-4-3-2-101200D 500mm,tf1 20mmD 1000mm,tf1 36mm15010050020100Vertical Strain ε (%)Fig.16 Tensile stiffness for scale effect2Elastic Modulus E (N/mm )2Elastic Modulus E (N/mm )250γ 0%200150100D 500mm,tf1 20mm〃 〃36mm0123300Shear Strain γ (%)Fig.15 Vertical stress-strain curves502004Number of Times of a repetition5120γ 0%100806040D 500mm,tf1 20mm〃 〃36mm20012345Number of Times of a repetition(a)σ -0.5 10N/mm2(b)σ -1.0 10N/mm2Fig.17 Repeated deformation dependence of E in tension(2) Shear test under constant tensile deformationFig. 18 shows the shear stress-strain curves for the 500mm specimen with the flange plate thickness20mm with 250% in shear strain, under the vertical stress 15, 0, –0.5 and –1.0N/mm2. The area of thehysteresis loop under the vertical stress of 0 –1.0N/mm2 is a little smaller than that of 15N/mm2. Andthe shape of the loop for –1.0N/mm2 is more linear than other loops. The shear stress-strain curves for the500mm specimen with flange plate thickness 20mm with 250% in shear strain under the tensile strain of
10 and 25% are almost similar to those under the tensile stress of –0.5 and –1.0N/mm2. Fig. 19 and Fig.20 show the shear stress-shear strain curves and vertical strain-shear strain curves respectively for 500mmspecimens with the flange plate thickness 20mm and 36mm with 250% in shear strain under the tensilestress of –1.0N/mm2. The curves for two different flange plate thicknesses show good coincidence in bothfigures. Fig. 21 shows the shear stiffness (shear modulus G) of 500mm specimens with the flange platethickness 20mm and 36mm as a function of shear strain. From the result, it can be understood that theshear stiffness is not affected by the flange plate thickness. The dependency of the shear stiffness on shearstrain under constant tensile strain of 10% and 25% are similar to that under the tensile stress of –0.5 and–1.0N/mm2 respectively. Especially, as the tensile stress of –1.0N/mm2 corresponds to tensile strain of25%, the shear stiffness under these conditions is almost the same.2Shear Stress τ (N/mm )Fig. 22 and Fig. 23 show the shear stress-shear strain curves and vertical strain-shear strain curvesrespectively for the 500mm and 1000mm specimens under tensile stress of –1.0N/mm2 with shear strainof 250%. The shear stress-shear strain curves are almost the same. The vertical strain-shear straincurves are a little different, but the vertical stain level is almost the same. Fig. 24 shows the shearstiffness under vertical stress of 15, 0, –0.5 and –1.0N/mm2 as a function of shear strain. The result is thesame tendency as Fig. 21 for 500mm specimens. Consequently as for the shear stiffness, the scale effectis small. The relation between the number of times of a repetition and the shear stiffness under tensilestress is shown for 500mm specimens with different flange plates in Fig. 25. The tensile deformation isabout 2% in tensile strain under tensile stress of –0.5N/mm2 or the tensile deformation is about 25% intensile strain under tensile stress of –1.0N/mm2, but change of shear stiffness is very small. Thedifference of the characteristics as to the flange plate thickness is small.2σ 0 -0.5 -1.0N/mm2σ 15 N/mm211D 500mmtf1 20mm0-1-1-2-600-400-2000200400Shear Strain γ (%)1.51.0-40tf1 20 mmD 500mmσ -1.0N/mm20.5tf1 36 mm0.0-0.5-1.0-1.5-300 -200 -1000100200300400Shear Strain γ (%)Fig.19 Shear stress-strain curvesVertical Strain ε (%)2Shear Stress τ (N/mm )Fig.18 Relation between shear stress-strain curves and tensile conditionσ -1.0N/mm2D 500mm-30-20tf1 36 mm-10tf1 20 mm0tf1 36 mm10-300-200-100σ -0.5N/mm01002200Shear Strain γ (%)Fig.20 Vertical stress-strain curves300
D 500mm0.5tf1 36mm0.42tf1 20mmShear Stress τ (N/mm )2Shear Modulud G (N/mm )σ 15 N/m 〃〃 0.0〃〃 -0.5〃〃 -1.0σ 15 N/m 〃〃 0.0〃〃 -0.5〃〃 -1.00.60.3050100 150 200Shear Strain γ (%)2501.5σ -1.0N/mm21.00.50.0D 1000mm-0.5-1.0-1.5-3003002Shear Modulud G (N/mm )Vertical Strain ε (%)2σ -1.0N/mmD 500mm-20D 1000mm0D 500mm10-300-200-1000-100σ -0.5N/mm21002000.5050100 150 200Shear Strain γ (%)2Shear Modulus G (N/mm )2Shear Modulus G (N/mm )0.50.4D 500mm,tf1 20mm〃 〃36mm4Number of Times of a repetition250300Fig.24 Shear stiffnessγ 250%33000.33000.622000.4Fig.23 Vertical strain-shear strain curves1100σ 15 N/m (D 500)〃〃 0.0〃〃-0.5〃〃-1.0σ 15 N/m (D 1000)〃〃 0.0〃〃-0.5〃〃-1.00.6Shear Strain γ (%)0.30Fig.22 Shear stress-strain curves-40-10-200Shear Strain γ (%)Fig.21 Shear stiffness-30D 500mm50.6γ 250%0.50.4D 500mm,tf1 20mm〃 〃36mm0.312345Number of Times of a repetition2(a)σ -0.5N/mm2(b)σ -1.0N/mmFig.25 Repeated deformation dependence of G(3) Simple tensile testFig. 26(a) shows the 1st cycle loop and 5th cycle loop obtained by the simple tensile tests for 500mmspecimens with the flange plate thickness 20mm and 36mm. In small deformation, there is a littledifference of the loops with respect to the flange plate thickness, but in large deformation there are nodifference. This means that the deformation of the rubber becomes dominant in large deformation and theeffect of the flange plate thickness is relatively small. Fig. 26(b) shows the 1st cycle loop and 5th cycle
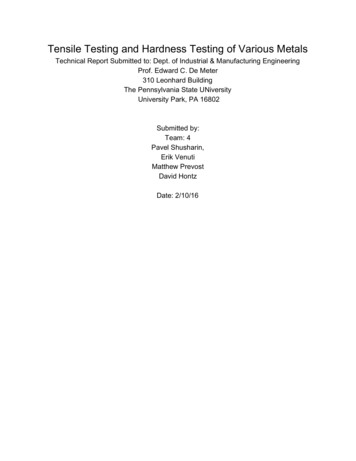
Tensile Stress σ (N/mm )0.522Tensile Stress σ (N/mm )loop obtained the simple tensile tests for 500mm and 1000mm specimens. There is a little difference ofthe loops with respect to the size. That may come from the fact that 500mm and 1000mm specimens arenot perfectly proportional. The basic characteristics before and after tensile tests are described in Table 4.As the tensile deformation cause the damage in rubber layers, the vertical and horizontal stiffness arefundamentally decreased. But the decreasing ratio of the vertical stiffness is from 2% to 4% and that ofthe horizontal stiffness is from 3% to 6%.tf1 20 mm0.0tf1 20 mm-0.5tf1 36 mm-1.0-1.55th cycle1th cycletf1 36 mm-2.0-120-100-80-60-40-2000.50.0-0.5D 500mmD 500mm-1.0D 1000mm-1.5-2.05th cycle1th cycleD 1000mm-2.5-120-100Tensile Strain ε (%)-80-60-40-200Tensile Strain ε (%)(a)Effect of Flange plate thickness(b)Scale effectFig.26 Tensile characteristics in large tensionD (mm)Table4 Change of basic characteristics after tensile testsG (N/mm2)Tf1 (mm)ConditionEc (N/mm2)γ 100%γ 200%5002050036100036γ 250%Initial12540.4460.4130.419After tensile test AAfter tensile test 0.4430.4100.416After tensile test AAfter tensile test 0.4450.4190.423After tensile test AAfter tensile test on of the flange plateAssuming the flange plate to be a simple circular plate, which is simply supported at periphery, withuniformly distributed load p, the deflection of the flange plate is given by equation (3) and equation (4).When 0 r bpb 4 r 4 4a 2 (1 ν )b 2 r r 2 b 4(3 ν )a 2 (7 3ν )b 2 2 1 ln 16D 4b 42(1 ν )a 2 b b 2 a4(1 ν )b 2 2δ (3)When b r aδ pb 4 1 16 D 2 (1 ν ) r2 1 2a a22r 2 2 ( 3 ν ) 2 (1 ν ) 1 2bb a ln r (4)
where D Eh3/{12(1–ν2)}, E: Young’s modulus, ν:Poisson ratio, h: plate thickness, a: distance from thecenter to the fastening bolts, b: radius of connecting plate.Fig. 27(a) shows the calculated values (shown as the lines) and measured values (shown as the symbols)for the flange deflection with respect to the radial distance from the center. Theoretical values are muchgreater than measured ones. So, it takes the thickness of the connecting plate into consideration and theequivalent thickness of the flange plate is attempted to apply to theoretical equation. The equivalentthickness is made the thickness of the flange plate added to the additional flange plate thickness. Theadditional flange plate thickness t is calculated by equation (5). D t D 2rfp tr′ (5)6Theory (tf1 20mm)〃 〃 ( 25mm )〃 〃 ( 36mm )Experiment (tf1 20mm)〃 〃 ( 25mm )〃 〃 ( 36mm )σ -1.0N/mm25432100100200300Flange Plate Deflection(mm)Flange Plate Deflection(mm)where Dr: diameter of connecting plate, Dfp: PCD(Pitch Circle Diameter) of fastening bolts. tr’ : thicknessof connecting plate from upper surface of the flange plate upwards, tr’ of 500mm and 1000mm specimensare 12mm and 20mm respectively. Fig. 27(b) shows the modified theoretical values using equation (5).That shows good correspondence to measured result. From these results, it seems possible that flangedeflection is evaluated by using the equivalent flange thickness.6σ -1.0N/mm25Theory (tf1 20mm)〃 〃 ( 25mm
of three levels and the tensile strain set as -10 and -25% of two levels. However, the specimen of 1000mm in diameter of rubber was not subjected to the horizontal deformation equal to 250% in strain. As for simple tensile test, the tensile deformation equal to -50, -75 and -100% in strain of three levels were applied.