Transcription
Solid Freeform Fabrication 2019: Proceedings of the 30th Annual InternationalSolid Freeform Fabrication Symposium – An Additive Manufacturing ConferenceReviewed PaperOPTIMIZING THE TENSILE STRENGTH FOR 3D PRINTED PLA PARTSC. Novoa* and A. Flores**Ingram School of Engineering, Texas State University, San Marcos, TX 78666AbstractThis research investigates on how extruder nozzle temperature, model infill rate (i.e.density) and number of shells affect the tensile strength of three-dimensional polylactic acid (PLA)products manufactured with the fused deposition model technology. Our goal is to enhance thequality of 3D printed products using the Makerbot Replicator. In the last thirty years, additivemanufacturing has been increasingly commercialized, therefore, it is critical to understandproperties of PLA products to broaden the use of 3D printing. We utilize a Universal TensileMachine and Quality Engineering to comprehend tensile strength characteristics of PLA. Tensilestrength tests are performed on PLA specimens to analyze their resistance to breakage. Statisticalanalysis of the experimental data collected shows that extruder temperature and model infill rate(i.e. density) affect tensile strength.Keywords: Additive Manufacturing (AM), Fused Deposition Modeling (FDM), Polylactic Acid(PLA), Design of Experiments (DOE)IntroductionOver the past few years, the increase on the use of additive manufacturing (AM) productshas resulted in higher demands from the manufacturing industry (Kim et al., 2017). Nowadays,AM influences a variety of fields such as medical (Liu et al., 2016), metal casting and automotive.Some of the AM applications are in high-risk industries such as defense and aerospace (Roach etal., 2018). In Harbaugh (2014), a Computer-Aided Design (CAD) of a ratchet wrench wastransmitted from the ground to space. In previous years, printing the object in space would nothave been possible, but due to technological innovations AM has surpassed such limitation. Thewrench was printed in space to test the feasibility of producing objects difficult to manufacture onearth because of the gravity effect and to simulate if in practice the crew could produce new toolsin the space stations. NASA’s greatest challenge in this mission was to contrast the quality of thewrench and other objects printed with the same printer before and after it was launched to space.Fused Deposition Modeling (FDM) also known as Fused Filament Fabrication (FFF) is anAM process pioneered by Scott Crump, founder of Stratasys Inc, about two decades ago (Stratasys,2019). FDM is a demanded technology by industry, academia and consumers because it isaffordable, simple to use and reliable (Masood, 2014). FDM can produce prototype products andfunctional parts of complex geometries. The FDM fabrication process is used to rapid prototypeplastic objects with specialized 3D printers like the Makerbot Replicator Desktop 3D printer(Makerbot, 2009a). At the instant the printer nozzle reaches its desired temperature, it startsextruding melted thermoplastic material (i.e. filament). A tool path pattern moves in the XY planehelping to construct every layer. One of the most common filament materials used in FDM is thepolylactic acid (PLA) due to its low cost, feasibility and high quality. Even if the behavior of the745
thermoplastic PLA has been defined previously in the literature, the performance of a printed PLAprototype depends on the layer structure created on the actual printing process (Torres et al., 2015).The main purposes of this research are: (1) to statistically analyze the resulting tensilestrength of parts manufactured with the FDM technology and the PLA material in the ReplicatorDesktop 3D printer and (2) to determine the best 3D printer settings to manufacture products wheretensile strength is a relevant mechanical property. To achieve these objectives, we construct a 3DCAD of the specimen to be manufactured by following the American Society for Testing andMaterials (ASTM) specifications (ASTM, 2014) and run a full factorial design of experiment(DOE) to validate the hypothesis regarding to the significant effect that any of three pre-selected3D printing factors (i.e. independent variables) may have over the tensile strength (i.e. responseor dependent variable).The contributions of this paper are: (1) to establish the dependence of tensile properties onthree selected printing factors or parameters (extruder nozzle temperature, model infill rate andnumber of shells) through the use of a DOE and (2) to provide a validated mathematical model toaccurately represent such dependence. The rest of the paper is organized as follows. First, wepresent the fundamental steps to produce additive manufactured products with the MakerbotReplicator 3D printer. Then we describe the DOE performed, the custom settings that can bemanipulated in the Makerbot Replicator and the method used to obtain the tensile strength data.Next, the results of the DOE are analyzed. The last section of the paper presents the conclusionsand future research.Additive Manufacturing Process in the Makerbot Replicator 3D PrinterThe Makerbot Replicator 3D printer uses the FDM methodology to print plastic objects.The FDM technique starts with a 3D object designed by the user using a CAD software. TheMakerbot Desktop software accepts the CAD input file exported to a stereo lithography (STL)format. STL files follow a tessellation process to generate a sliced version from the original solidmodel by constructing triangular surfaces (facets) that specify binary representations in the slicedobject (Pandey et al., 2003).Printing parameters such as the layer height, infill, number of shells, and a variety of otheroptions can be set by the user on the Makerbot Desktop software. The .STL file is used by theMakerBot Desktop software to create the G-code language that will instruct the printer withspecific actions to perform to print the 3D object. The Makerbot Replicator 3D printer receives asinput the G-code directly from the software or by plugging a universal serial bus (USB) flash drivedirectly into the machine. The Makerbot Replicator 3D printer lays down successive layers ofmelted PLA filament on a build platform until the three dimensional solid is created.In this research, the 3D printing material used is PLA plastic. The reason for deciding toexperiment with this material is because the finish quality of the products produced with PLA isvery good and one of the authors of this paper is interested in the long-term on producing partsthat are not only functional but also highly aesthetic for potential commercialization. The PLAproduces final parts that are glossy, strong, and durable. PLA has higher compressive strength,746
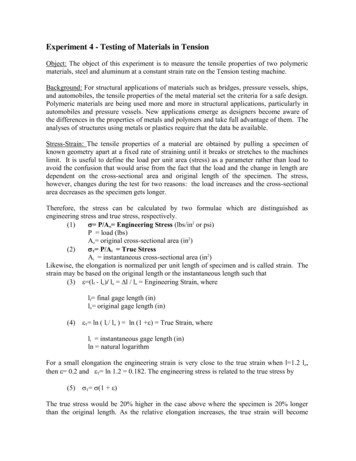
tensile strength and flexural strength than Acrylonitrile Butadiene Styrene (ABS), anotherthermoplastic material commonly used for AM, but PLA is more brittle. The PLA thermoplasticmaterial has also low cost and the fumes emitted are considered safe.The Makerbot Replicator has a compartment towards the back of it to position the filamentspool. This thick filament is led by a motor to the extruder through plastic tubes. The extrudertakes the filament and passes it to the heated nozzle where the filament is melted at a predetermined temperature and extruded. The melted filament is used to construct layers of the solidobject onto the replicator build platform (i.e. print platform) according to what it is specified in theG-code. The PLA material does not require a heated build plate. The melted filament rapidly coolsand crystalizes. A road of is known as a single line of material deposited into the platform. Whenthe extrusion head finishes depositing the roads required by the part side-by-side on the x-y plane,it is known as a single layer. Once the extrusion head prints a layer, the build platform moves inthe z-axis according to the selected layer height. The process of depositing layers of filamentrepeats until the object (i.e. part or product) is completely printed. Figure 1(a) shows a picture ofthe Makerbot Replicator where the build platform can be seen inside the machine. Figure 1(b)shows a picture of the Makerbot Replicator smart extruder that magnetically attaches against theback of the 3D printer extruder carriage. It has a filament detection mechanism that stops printingand informs the user when the filament runs out and is specifically designed to work with theMakerbot PLA filament.Figure 1: (a) The Makerbot Replicator 3D Printer (b) The Smart Extruder for the MakerbotReplicator.Source: https://store.makerbot.comThe Experimental Design PerformedIn Montgomery (2017), it is mentioned that to understand cause-and-effect relationships ina system or process it is needed to intentionally change the input variables to the process andobserve the variations in the system output produced by those alterations on the input variables. A747
DOE consist of (1) runs in which changes are deliberately made to the input variables tostatistically identify the relevant variables causing the changes in the process output or response,(2) a mathematical model to relate the response to critical input variables and (3) an evidence ofusing the model for process improvement.In the DOE terminology it is customary so refer to the input variables as controllable factorsor simply factors and to the process output as the response. Montgomery (2017) also states aboutthe existence of uncontrollable variables, such as environmental factors. Thus, a DOE practitionerneeds to identify: (1) factors that will be intentionally varied, (2) factors that will be held constant,(3) factors that will be allowed to vary and (4) nuisance factors which can be sub-classified ascontrollable, uncontrollable but measurable and pure noise.The correct DOE approach is to conduct an experiment in which the factors are variedtogether instead of one at a time. If the experimental runs set the factors in each of the possiblecombination of factor levels the design is named a full factorial design. The objective of a full kfactorial DOE is to measure how k factors influence a response. The statistical technique knownas analysis of variance (ANOVA) is used to detect if there is a significant factor or a significantinteraction of factors. Because of the time frame allowed to this project, the smallest full k-factorialDOE is selected. It is the 2 design where each of k 3 selected factors is studied at two levels. Aselection of levels for each factor is known as an experimental condition. Thus, the DOE has 8 (i.e.23) experimental conditions. In addition, three replicates (i.e. independent repeated runs of eachfactor combination) of such design are performed for a total of 24 runs.Characteristics of the Material Used in this DOEThe only material used in this DOE is the Makerbot PLA filament (Makerbot, 2009b). Thisis a material suitable for FDM. The Makerkot company states that their PLA filament is the mostreliable to use with the Makerbot Replicator because (1) it is produced specifically to work withthe Makerbot 3D printers, (2) has consistent diameter and (3) the Makerbot Replicator is alsodesigned to work optimally with the Makerbot PLA filament.The filament used in the DOE has a diameter of 1.75 mm (0.07”) and it comes in spools of1.36 kg (3 lb) with a net weight of 0.9 kg (2 lb). According to the filament specifications, it meltsat 150-160 C (302-320 F). The Makerbot PLA filament is a non-toxic resin derived from cornand similar agricultural products that can be recycled and at some extend can be consideredbiodegradable. In the DOE, the filament wasn’t pre-treated; it was taken directly from the storagecabinet located at the Ingram School of Engineering Additive Manufacturing (AMA) lab (AdditiveManufacturing Lab, 2016), unpacked, threaded on the machine and used. The filament waspurchased on August 2016 and the DOE was performed on Summer 2018. The lab temperature isset to 23 C and the relative humidity is 50%The Model and Printing Settings Available on the Makerbot ReplicatorThere are several model and printing settings that a user can control or manipulate for theMakerbot Replicator though the Makerbot Desktop software. The default settings under the devicesettings category and the extrusion speeds (ES) category are shown in Tables 1 and 2, respectively.748
Table 1. Makerbot replicator default settings under the device settings categorySettingExtruder temperaturePlatform temperature (if connected to a heated build chamber)Travel speed (this is for parts of the toolpath where the extrudermoves but doesn’t extrude plastic)Z-axis travel speed (this is the build plate movement betweenlayers)Use active cooling fan (it applies if printed is equipped with it)Fan powerFan Layer (i.e. layer number at which the cooling fan turns on)Minimum layer duration (or minimum layer print time)Default value215 112 150 mm/s23 mm/sOn50% of max power15sTable 2. Makerbot replicator default settings under the extrusion speeds (ES) categorySettingES on bridgesES on first layer (if not using raft)ES on first layer raft (if using raft)ES on infill and insets (all the fill areas and the shells exceptthe outermost)ES on outlines (outermost shell in each layer)ES on raft (i.e. raft interface) and raft baseDefault value40 mm/s30 mm/s30 mm/s90 mm/s20 mm/s90 mm/sThe Makerbot Desktop software also provides options for selecting the infill density andpattern. The default option for infill density is 10%. The hexagonal infill pattern is strong and itis the default. Other pattern options are linear or parallel straight lines that are perpendicular to thelines on the previous layer, diamond shaped, morrocanstar and catfill. The last two options aremore related to decorative purposes. Four of the infill pattern options are presented in Figure 2.The settings under the model properties category and their default values are given in Table 3. Theroof and floor thickness set the height of the solid layers at the top and bottom of the print.Coarseness is used to include or exclude details in the model outline.Figure 2: Makerbot Replicator Infill Pattern Options for the Makerbot ReplicatorSource: 2-0-more-features/749
Table 3. Makerbot replicator default settings under model propertiesSettingLayer heightInfill layer heightNumber of shells or extruded outlinesRoof and floor thicknessCoarsenessDefault value0.20 mm0.20 mm20.80 mm0.00010 mmThe raft category in the Makerbot software permits to turn on and off the option of usingrafts. The default values when the raft option is selected are: (1) raft-model spacing, that is thevertical distance between the raft and the model, (0.29 mm) and (2) raft margin, that is how far theraft extends from the edges of the object, (4.0 mm). Other options that can be manipulated on theraft panel are the spacing of base, interface and surface layers of the draft. Because the specimensprinted in this study didn’t require supports, we skip listing the default settings for the supportsand bridging panel options. Under the extruder panel category the options available are presentedin Table 4. All the settings and default values mentioned in this section are available at Makerbotcustom settings (Makerbot, 2009c).Table 4. Makerbot replicator default settings under extruder panel categorySettingFilament diameterFilament retraction distanceFilament retraction speedFilament restart speedFilament extra restart distanceExtra restart speedOoze distance (i.e. amount of oozed plastic usedafter the extrusion stops before the end of a move)Minimum ooze path length (this is to turn off theoozing on very short movements)Default value1.77 mm1.0 mm50 mm/s30 mm/s0.1 mm30 mm/s0.1 mm0.1 mmDesign Factors or Independent Variables in the DOEMany factors such as the layer height, extruder nozzle speed, extruder nozzle temperature,infill pattern, print bed (i.e. platform) temperature, and infill rate may affect the tensile strength ofan additive manufactured part in the Makerbot Replicator. In Torres et al., (2015) it is mentionedthat layer height has been shown of high importance for strength and that the extruder nozzletemperature and the number of perimeter layers affect strength values while extruder speeddoesn’t. In Torres et al., (2015), it is also mentioned about the effect of the duration of postprocessannealing in strength.In this study, infill rate (i.e. infill density), extruder nozzle temperature, and number ofshells were finally chosen as the three design factors in the DOE. Infill rate relates to the densityof the internal support structure of the manufactured object. The higher the infill rate the denserthe object but more filament is used, and the printing time will increase. Number of shellscorresponds to the number of extruded outlines to form the perimeter that defines the shape of the750
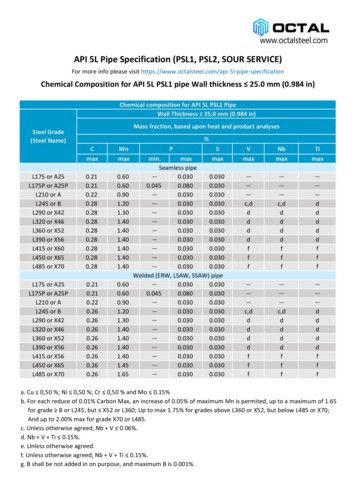
layer. Every object must have at least on shell; more shells increase the strength and weight of theobject but also the print time. Table 5 presents the values considered for the two levels of each oneof the factors studied using coded and uncoded units. Table A.1 in Appendix 1 presents the 24experimental runs performed in the DOE using coded units for the levels of the factors. Thus, inthe table in Appendix 1 a value of 1 for the level of a factor indicates that the factor is set at itshigh level and a value of -1 indicates that it is set at its low level. The value for the factors in codedunits can be easily translated to uncoded units using Table 5.Table 5. Levels for the factors included in the DOELevel value incoded units1 (High)-1 (Low)Values for each of the factors inuncoded unitsExtruderInfillNumberTemperature Density of Shells(T)(I)(NS)215ºC100%4190ºC70%2The model and printing settings available in the Makerbot Desktop software, discussed inthe previous section and not listed in Table 5, correspond to potential design factors that wedecided to maintain constant at the default values in the DOE reported in this paper. The effect ofheld-constant factors and allowed-to-vary design factors, such as variations in the quality of thefilament used, are assumed to be small in this DOE. In addition, the following three factors fall inthe category of DOE nuisance factors. They are: (1) controllable (i.e. those that can be set to aparticular level by the experimenter, such as the temperature of the printing lab), (2) uncontrollablebut measurable ones (i.e. humidity of the lab) and (3) pure noise factors (i.e. those that varynaturally and in an uncontrollable way such as wear and tear of the equipment).The Experimental UnitThe cross-sectional dogbone specimen used as the experimental unit in the DOE is depictedin Figure 3 on next page. It was designed with the software Solidworks (Solidworks, 2002) inaccordance to the ASTM D638 -14 standard for Type 1 test specimens (ASTM, 2014). Thespecimen has an overall length of 165 mm (6.5”), an overall width of 19 mm ( 0.75”), a thicknessof 7 mm (0.28”), a length of the narrow section of 57 mm ( 2.25”), a width of the narrow sectionof 13 (0.50”), and radiuses of fillet (i.e. grip radiuses) of 76 mm (3.00”). More than 12,800 ASTMstandards are used by companies and consumers to have confidence in the things they buy and use(ASTM, 1996). The ASTM standards impact product quality, consumers’ health and safety andfacilitate product commercialization.Response Variable for the DOEThe response variable for the implemented DOE is the ultimate tensile strength (UTS).The preferred procedure to acquire tensile strength measurements is from the stress-strain curve.The purpose of the curve is to indicate the mechanical strengths of structures by emphasizing thecomputations of stress and strain. UTS is the maximum strength an object can resist priorencountering failure. Stress can be computed as:751
165'57'',,,.'- ·.28.50''" i 0-. , . ',,0"'·",o28.5057'4,Figure 3: Dimensioned Dogbone Specimen used as Experimental Unit in the DOEFS A(1)In formula (1), ߪ indicates stress and it is normally expressed in megapascals (MPa) in theInternational System of Units, or in pounds-force per square inch (psi) if following the customaryunits used in the United States. F represents the load (i.e. amount of tensile force) applied inNewtons (N) or pounds-force (lܾ ), A is the initial cross-sectional area in the gage length segmentof the specimen in square meters (݉ଶ ) or square inches (݅݊ଶ ).Procedure to Collect the Response Variable: Tensile StrengthTensile strength tests were performed to the 24 dogbone specimens printed. The tensile testis one of the mechanical stress-strain tests that provides information about tensile strength, yieldstrength and ductility of a material. It is a good way to ascertain mechanical properties of polymerssuch as the PLA plastic. It is also the most common mechanical test performed in experiments dueto its feasibility to perform. The tensile strength test is performed perpendicular to the crosssectional area of the gage and the direction of the applied force goes away from the specimen.Some of the universal tensile machines (UTM) and software available in the market for doing thetensile strength test are presented in (ADMET, 2019).As mentioned in the previous section, UTS is the maximum stress, measured as the uniaxialforce per unit area, that a material can withstand before it breaks when subject to tension (i.e.elongation). It reflects how strong the material is. UTS demonstrates the point where the specimenis encountering permanent deformation and failure under tension by resisting a tensile loadhanging from the upper and lower shoulders.The UTS data was collected using the MTS 810 Servo Hydraulic Universal TestingMachine (UTM) from MTS Corporation available at the Advanced Composites Lab (ACL) in theIngram School of Engineering at Texas State University (Advanced Composites Lab, 2008) and752
following the ASTM D638 -14 standard (ASTM, 2014). The model of the machine is the 810system FlexTest SE Controller-Plus. The machine has great flexibility to test a variety of materialssuch as plastics, aluminum, composites and steel. The machine crosshead speed was of 1mm/minand an extensometer was used. The temperature and humidity of the lab were 23 and 50%,respectively. The specimens were no pretreated in any way.In the data collection phase of the DOE, the dogbone specimen was loaded onto themachine and firmly positioned by its shoulders. The tensile grips are required for the specimen tostay in place as shown in Figure 4a. A tensile load is applied, and an extensometer is connected tothe specimen to record the tensile strain or to compute the difference in elongation. Computing thegage’s length before the test is important because permanent deformation and failure are to bedetermined. The machine separates the tensile grips at a constant speed in opposite directions. Thisconstant rate of speed is chosen in accordance with the shape and standard dimensions of thespecimen. The stress-strain data provided by the test is collected through a computer system and asoftware that the machine has available. Figure 4b shows some of the dogbone specimens after thetensile strength test.Figure 4: (a) A dogbone specimen being loaded for testing (b) Several dogbone specimens afterthe tensile strength test.753
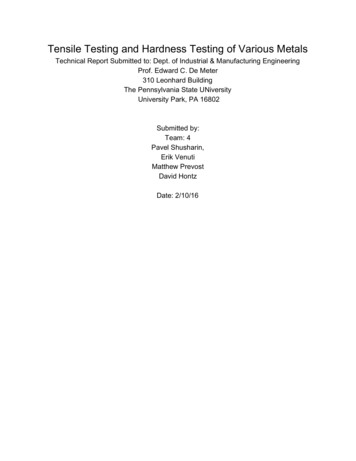
ResultsThe dogbone specimens were printed so that the length dimension was along the x-axis andthe width dimension was along the y-axis. An ANOVA model was run for the times to print. ThisANOVA does not show that the time to print is significantly affected by any of the 3 factors studiedin the DOE.Stress-Strain CurvesFigure 5 shows the stress-strain graph for run 15 (i.e. the one that corresponds toexperimental standard order number 17). It corresponds to the dogbone specimen that showed thelowest UTS in the DOE. The UTS is the maximum point in the curve. Stress was measured inmegapascals (MPa). Strain is the deformation measured as the change in length divided by originallength. It is measured in mm/mm. The experimental setting that corresponds to this run is: extrudernozzle temperature (low), infill density (low) and number of perimeter shells (low). This result issomehow expected since this setting has all factors at the low level. The stress-strain curve alsopermits to find the Young’s modulus of elasticity. It is the ratio of stress to strain in the linear partof the graph. The Young modulus can be used to determine how stiff a material is. Stiff materialshave high Young modulus. The relationship between stress and strain is given by equation (2)(2)S Yewhere, ߪ corresponds to the uniaxial stress, Y is the Young’s modulus and ε is the stain.Stress [MPa]302010000.010.02Strain [mm/mm]Figure 5. Stress vs Strain Curve for the Specimen with the Lowest UTS7540.03
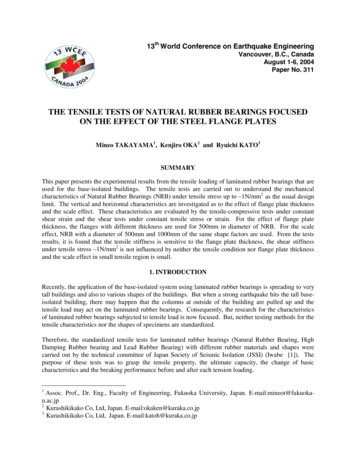
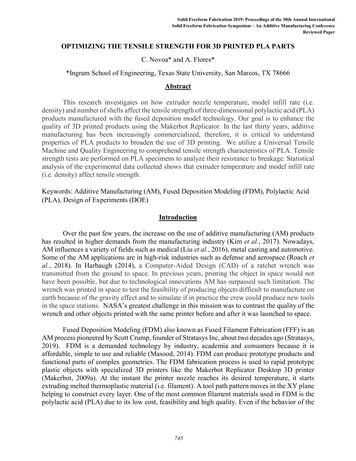
7060Stress [MPa]504030201000.000.010.02Strain [mm/mm]0.030.04Figure 6. Stress vs Strain Curve for the Specimen with the Highest UTSFigure 6 above shows the stress-strain graph for run 21 (i.e. the one that corresponds toexperimental standard order number 12). It corresponds to the dogbone specimen that showed thehighest UTS in the DOE. The experimental setting for this sample is: extruder nozzle temperature(low), infill density (high) and number of perimeter shells (low). This result is somehowencouraging from the point of view of time and energy consumption because extruder nozzletemperature and number of perimeter shells were set in the low levels, but the infill density wasset at the high level.The software used to generate and analyze the DOE is Minitab (Minitab, 2019). Figure 7on next page shows the Pareto chart of standardized effects for the tensile strength responsevariable at a significance level Į 0.05. It shows the absolute values of the standardized effects ofthe factors and their interactions from the largest to the smallest one. The x-axis corresponds to theabsolute value of the standardized value of the effect and the y-axis lists the factors and theirinteractions. The value of the critical value for the t-statistics to test the null hypothesis that theeffect of each factor is 0 at a significance level α 0.05 is equal to 2.12. Such critical value isrepresented by the dashed vertical line. Effects located to the left of the line are non-significant.Figure 7 on next page shows that extruder temperature and infill density are the only significantfactors that affect the tensile strength. The figure also shows that none of the factor interactionsare significant.Authors in Torres et al., (2015) mentioned that number of perimeter layers significancewas well established. However, this study doesn’t confirm that such factor is significant. Ourresults agree with (Torres et al., 2015) regarding the significance of using a high value for extruder755
temperature. In Torres et al., (2015) the authors suggested also a high temperature value of 230ºCthat is above the default value for the Makerbot Software.Term2.12BACBCABCABAC02Factor NameAB46Standardized Effect810TemperatureInfillFigure 7: Pareto Chart of Standardized Effects for Response Variable: UTS (Į 0.05)Table A2.1 in Appendix 2 presents the Minitab ANOVA table for the DOE. The model pvalue is very small (less than 0.0000) indicating that the model is significant. Table A2.2 showsthat the model has an adjusted R2 of 86.46%. It means that about 87% of the variability in the UTSis explained by extruder temperature, infill density, number of shells and the two and three-wayinteractions of those factors. Because the number of shells and the two and three-way interactionsresulted non-significant, a new ANOVA model was requested to Minitab in which onlytemperature and infill were considered as factors. Table A3.1 in Appendix 3 presents the ANOVAtable for this new model. Table A3.2 shows that about 80% of the variability in the UTS isexplained by temperature and infill density since the model has an adjusted R2 of 80.10%. FigureA3.1 in Appendix 3 shows the Pareto chart of standardized effects for the tensile strength asresponse variable in the model with only two factors. Figure A3.1 shows that both effects aresignificant since the end located to the right of the red line.Figure 8 on next page shows the residual plots for the ANOVA model that includes onlytemperature and infill rate. Residuals can be thought of as observed values of the noise error(Montgomery, 2017). The normal probability plot and the histogram are used to test the assumptionof normality of the residuals. These plots show that the residuals are relatively normal and have amean close to zero. Run number 15 (standard order number 17), one of the two runs wheretemperature, infill rate and number of shells were set at low level, had a large residual of -11.09756
that corresponds to a standardized residual of -2.72. The other run at the same low levels of thefactors had a standardized residual of -1.63. Those residuals are large but still are not greater than3 or 4 standard deviations to be considered as outliers.The residuals vs. fits plot is helpful to validate the assumption of constant variance of theresiduals. In the graph, there is a slight but not severe tendency for the variance of the residuals tobecome larger for those observations where the tensile strength ended low. However, excludingrun number 15 with the large residual of 11.09 this tendency is practically not present. The plot ofresiduals vs. experimental order doesn’t show any patterns that violate the randomness assumptionfor the residuals. The non-existence of patterns on the residuals vs. order graph was validated alsotrough performing run tests under the control chart for individuals option in Minitab.Normal Probability PlotVersus -- ------! 35 404550ResidualFitted ValueHistogramVersus Order4.85553.6ResidualFrequencyI0101 2.40-51.2-100.0-12-8-4042Re
Machine and Quality Engineering to comprehend tensile strength characteristics of PLA. Tensile strength tests are performed on PLA specimens to analyze their resistance to breakage. Statistical analysis of the experimental data collected shows that extruder temperature and model infill rate (i.e. density) affect tensile strength.