Transcription
Experiment 4 - Testing of Materials in TensionObject: The object of this experiment is to measure the tensile properties of two polymericmaterials, steel and aluminum at a constant strain rate on the Tension testing machine.Background: For structural applications of materials such as bridges, pressure vessels, ships,and automobiles, the tensile properties of the metal material set the criteria for a safe design.Polymeric materials are being used more and more in structural applications, particularly inautomobiles and pressure vessels. New applications emerge as designers become aware ofthe differences in the properties of metals and polymers and take full advantage of them. Theanalyses of structures using metals or plastics require that the data be available.Stress-Strain: The tensile properties of a material are obtained by pulling a specimen ofknown geometry apart at a fixed rate of straining until it breaks or stretches to the machineslimit. It is useful to define the load per unit area (stress) as a parameter rather than load toavoid the confusion that would arise from the fact that the load and the change in length aredependent on the cross-sectional area and original length of the specimen. The stress,however, changes during the test for two reasons: the load increases and the cross-sectionalarea decreases as the specimen gets longer.Therefore, the stress can be calculated by two formulae which are distinguished asengineering stress and true stress, respectively.(1) P/Ao Engineering Stress (lbs/in2 or psi)P load (lbs)Ao original cross-sectional area (in2)(2) T P/Ai True StressAi instantaneous cross-sectional area (in2)Likewise, the elongation is normalized per unit length of specimen and is called strain. Thestrain may be based on the original length or the instantaneous length such that(3) (lf - lo)/ lo l / lo Engineering Strain, wherelf final gage length (in)lo original gage length (in)(4) T ln ( li / lo ) ln (1 ) True Strain, whereli instantaneous gage length (in)ln natural logarithmFor a small elongation the engineering strain is very close to the true strain when l 1.2 l o,then 0.2 and T ln 1.2 0.182. The engineering stress is related to the true stress by(5) T (1 )The true stress would be 20% higher in the case above where the specimen is 20% longerthan the original length. As the relative elongation increases, the true strain will become
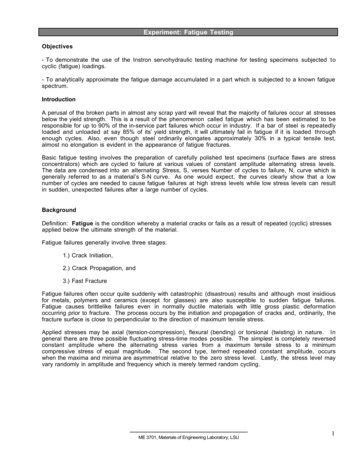
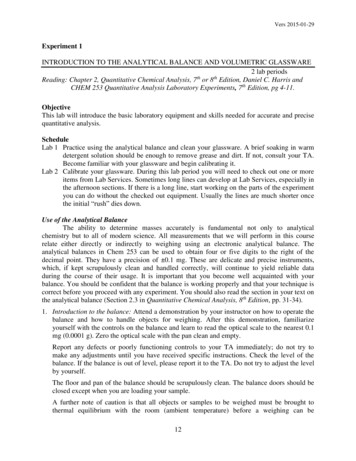
significantly less than the engineering strain while the true stress becomes much greater thanthe engineering stress. When l 4.0 lo then 3.0 but the true strain ln 4.0 1.39.Therefore, the true strain is less than 1/2 of the engineering strain. The true stress ( T) (1 3.0) 4 , or the true stress is 4 times the engineering stress.Tensile Test Nomenclature: The tensile test data are characterized by terminology shown inFigure 4-1.The material test curves have a region where the deformation caused by the stress is elastic,or not permanent. This means when the stress is removed the specimen returns to its originallength. At stresses greater than a certain value, a portion of the strain becomes permanent orplastic. The stress required to cause a 0.2% plastic strain, or off-set, is called the yield stress.Ductility is measured as % elongation, representing the ability to deform in the plastic range(6) l l %elongation f 0 100 l0
EquipmentUnited Tensile Testing Machine: floor-mounted (20,000 lb. capacity)Calipers, RulerProcedureYou will receive 4 specimens (high density polyethylene, low density polyethylene, steel andaluminum.Using calipers measure (in the reduced area):1) the thickness of the specimen to .002 inches.2) the width of the specimen to 0.02 inch.Make sure to record the specific metal alloy, original specimen width, thickness, gage length;and after fracture load and percent elongation (total strain).Place the specimen as instructed and tighten the clamps securely. The original crossheaddistance (gage length) will be measured with a ruler after the sample has been placed firmlyin the grips. The gage length is the distance from the top of the lower clamp to the bottom ofthe upper one. Measure the gage length to 0.1 inch.MSE 227 LAB – Tensile Machine OperationClick on DATUM shortcut on the Desktop (wait for program to finish loading)Click on Template for: MSE 227 Aluminum or Steel sample - testing rate will be 0.2 inch/minute MSE 227 Polymer sample - testing rate will be 2.0 inch/minuteClick on SAMPLE INFORMATION tab:Enter Gage length Width Thickness(Make sure to ENTER the information, so that it calculates the Area correctly)The CONTROL SEGMENT tab shows the testing rate for the given set up.Tighten the grips on the sample; you can see the force you are applying on the computer screen.You want to be sure the grips are secure (hopefully with no more than 5lb force preload).Click on TEST when ready to begin testing.Make sure to record test number, so you can find your data.Click on REPORT to Export your file.To retrieve data go to:Computer Local disk (C) Datum 5 DFW ExpPlots
Glossary of TermsUnderstanding the following terms will help in understanding this experiment:Ductility - The ability of a material to be permanently deformed without breaking when a force isapplied.Elastic deformation - Deformation of the material that is recovered when the applied load isremoved. This temporary deformation is associated with the stretching of atomic bonds.% Elongation - The total percent increase in the length of a specimen during a tensile test.Engineering strain - Increase in sample length at a given load divided by the original (stress-free)length.Engineering stress - The applied load, or force, divided by the original cross-sectional area of thematerial.Engineering stress-strain curve - A plot of the Engineering stress versus the Engineering strain.Hooke's law - the linear relationship between stress and strain in the elastic portion of the stressstrain curve.Modulus of elasticity - Young's modulus, or the slope of the stress-strain curve in the elastic region.Necking - Local deformation of a tensile specimen. Necking begins at the tensile point.Offset yield strength - yield strength obtained graphically that describes the stress that gives no morethan a specified amount of plastic deformation.Plastic deformation - Permanent deformation of the material when a load is applied, then removed.% Reduction in area - The total percent decrease in the cross-sectional area of a specimen during thetensile test.Tensile strength - The maximum engineering stress experienced by a material during a tensile test(ultimate tensile strength).Tensile test - Measures the response of a material to a slowly applied uniaxial force. The yieldstrength, tensile strength, modulus of elasticity, and ductility are obtained.True strain - The actual strain produced when a load is applied to a material.True stress - The load divided by the actual area at that load in a tensile test.Yield strength - The stress applied to a material that just causes permanent plastic deformation.Write UpPrepare a memo report on the results of the tests. The report should contain 4 Figures(graphs) that contain an overlay of engineering and true stress-strain curves from thetensile tests for each material. All graphs should be graphed using Excel. Label engineeringcurves to show Young's Modulus, Yield Stress, Ultimate Tensile Strength, and TotalStrain (also label values; for example, Young’s modulus 41000 psi). Discuss these valuesin your report and compare them with published values for the same alloys. Discuss your4 graphs, the errors involved in this experiment and their sources.ReferencesMcClinock, Mechanical Behavior of MaterialsDieter, Mechanical MetallurgyNielsen, Mechanical Properties of Polymers
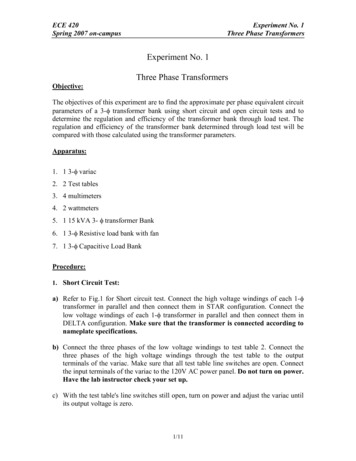
MSE 227LTesting of Materials in oorFairAverageGoodExcellent48121620Young's Modulus labeled neatly using Excel(Include values on graph). Show calculations.12345Yield Stress labeled neatly using Excel(Include values on graph).12345Total Strain labeled neatly using Excel(Include values on graph).12345Ultimate Tensile Strength labeled neatlyusing Excel (Include values on graph).12345Experimental values for E, yld, ult, totalelongation compared to published values.Include table with compared values andmeasured data.246810Discussion of errors in this experiment andtheir 44Excellent55555Memorandum Format UsedSpelling, grammar & punctuation correctReport includes:Compare graphs for engineering stressengineering strain, and true stress-true strainusing data from tensile tests for each material(4 graphs total; 2 curves overlaid per graph).Label Engineering Curves onlyOverall level of effort apparentQuality of graphsQuality of AbstractQuality of work descriptionQuality of conclusions
tensile test. Tensile strength - The maximum engineering stress experienced by a material during a tensile test (ultimate tensile strength). Tensile test - Measures the response of a material to a slowly applied uniaxial force. The yield strength, tensile strength, modulus of elasticity, and ductility are obtained.