Transcription
(2022) 23:465Cheng et al. BMC Musculoskeletal 5Open AccessRESEARCHGlucagon‑like peptide‑1 attenuatesdiabetes‑associated osteoporosis in ZDF rat,possibly through the RAGE pathwayYanzhen Cheng1†, Peng Liu2†, Qianru Xiang1, Jiamin Liang1, Huafeng Chen1, Hua Zhang1* and Li Yang3*AbstractBackground: Diabetes-associated osteoporosis are partly caused by accumulation of advanced glycation endproducts (AGEs). Glucagon-like peptide-1 (GLP-1) has been shown to regulate bone turnover. Here we explore whetherGLP-1 receptor agonist (GLP1RA) can have a beneficial effect on bone in diabetes by ameliorating AGEs.Methods: In the present study, we evaluated the effects of the GLP-1 receptor agonist liraglutide, insulin and dipeptidyl peptidase-4 inhibitor saxagliptin on Zucker diabetic fatty rats. Meanwhile, we observed the effect of GLP-1 onAGEs-mediated osteoblast proliferation and differentiation and the signal pathway.Results: Liraglutide prevented the deterioration of trabecular microarchitecture and enhanced bone strength. Moreover, it increased serum Alpl, Ocn and P1NP levels and decreased serum CTX. In vitro we confirmed that GLP-1 couldattenuate AGEs-mediated damage in osteogenic proliferation and differentiation. Besides, GLP-1 down-regulated theROS that caused by AGEs and the mRNA and protein expression of Rage .Conclusions: Altogether, our findings suggest that GLP-1 receptor agonist promotes osteoblastogenesis and suppresses bone resorption on obese type 2 diabetic rats to a certain degree. The mechanism of these effects may bepartly mediated by AGEs-RAGE-ROS pathway via the interaction with GLP-1 receptor.Keywords: Glucagon-like peptide-1, Advanced glycation endproducts, Diabetes, Osteoporosis, LiraglutideBackgroundOsteoporosis is a skeletal disorder characterized bydecreased bone mass and damaged bone tissue microstructure, culminating in fragility fractures, pain anddisability [1]. With the increasing incidence of diabetes,†Yanzhen Cheng and Peng Liu contributed equally to this work.*Correspondence: jimzhua@163.com; yangli19762009@163.com1Department of Endocrinology and Metabolism, Zhujiang Hospital,the Second School of Clinical Medicine, Southern Medical University,Guangzhou 510000, Guangdong, People’s Republic of China3Department of Nutrition, Zhujiang Hospital, the Second Schoolof Clinical Medicine, Southern Medical University, Guangzhou 510000,Guangdong, People’s Republic of ChinaFull list of author information is available at the end of the articlediabetes-associated osteoporosis has become more prevalent with high morbidity and fracture risks.Glucagon-like peptide-1 (GLP-1) can be degraded bydipeptidyl peptidase-4 (DPP-4) and stimulates glucosedependent insulin secretion [2]. Studies have shown thatboth DPP4 inhibitors and GLP-1 agonists have beneficialeffects on the bone in patients [3, 4]. But the mechanismsremain elusive.The formation and accumulation of advanced glycation end products (AGEs) were demonstrated as themain causes of diabetes-associated osteoporosis [5]. It’sreported that GLP-1 could attenuate the generation ofAGEs-induced reactive oxygen species (ROS) [6–8]. Itremains unknown whether GLP-1 can ameliorate thedetrimental effects of AGEs in diabetes-related osteoporosis. Therefore, we aimed to identify the potential The Author(s) 2022. Open Access This article is licensed under a Creative Commons Attribution 4.0 International License, whichpermits use, sharing, adaptation, distribution and reproduction in any medium or format, as long as you give appropriate credit to theoriginal author(s) and the source, provide a link to the Creative Commons licence, and indicate if changes were made. The images orother third party material in this article are included in the article’s Creative Commons licence, unless indicated otherwise in a credit lineto the material. If material is not included in the article’s Creative Commons licence and your intended use is not permitted by statutoryregulation or exceeds the permitted use, you will need to obtain permission directly from the copyright holder. To view a copy of thislicence, visit http:// creat iveco mmons. org/ licen ses/ by/4. 0/. The Creative Commons Public Domain Dedication waiver (http:// creat iveco mmons. org/ publi cdoma in/ zero/1. 0/) applies to the data made available in this article, unless otherwise stated in a credit line to the data.
Cheng et al. BMC Musculoskeletal Disorders(2022) 23:465protective pathways that GLP-1 triggered to counteractAGEs-mediated damages both in vitro and in vivo.MethodsMaterialsHuman GLP-1 (7–36) (GLP-1), E xendin(9–39) (exendin),the amebocyte lysate assay kit, dexamethasone, ascorbic acid, β-glycerophosphate, alizarin red, uoresceindiacetate(DCFH-DA), and 3-(4,5-dimethylthiazozyl)-2,5-diphenyl tetrazolium bromide (MTT) were purchased fromSigma (St. Louis, MO, USA). Rabbit anti-Glp1r, rabbitanti- Rage, mouse anti-Gapdh, rabbit anti-Gapdh, rabbitanti-Cyclophilin B, goat HRP-conjugated, rabbit HRPconjugated, and Goat Anti-Rabbit IgG HRP 647 antibodies (Abcam, Cambridge, UK) were used, which werelisted in Table 1. The protein marker (26634) was fromThermoFisher (California, USA). The BCA assay kit wasfrom CoWin Biotech (Beijing, China); Dimethyl sulfoxide(DMSO) and TRIZOL reagent were obtained from Invitrogen (Buenos Aires, Argentina); Fetal bovine serum(FBS) and Dulbecco’s modified Eagle’s medium (DMEM)were all from HyClone (Logan, UT, USA); The PrimeScript one-step Real Time Polymerase Chain Reaction(RT-PCR) kit and S YBR Premix Ex Taq II were fromTakara Biotechnology (Dalian, China); RIPA lysis bufferwas from Beyotime Biotech (Shanghai, China); theDetoxi-Gel column was from Pierce (Rockford, IL, USA);the ECL kit was from Applygen Technologies Inc. (Beijing, China). All other chemicals and reagents were purchased commercially and were of analytical grade.Animal experimentsAll experiments and animal care procedures were carried out in accordance with the principles of laboratoryanimal care and were approved by the Animal Care andUse Committee of the Southern Medical UniversityPage 2 of 13(Guangzhou, China). Twenty-eight male Zucker diabeticfatty rats [ZDF (fa/fa)] and 7 male Zucker lean controlrats [ZLC (fa/ )] were purchased from the LaboratoryAnimal Center of Vital River [Beijing, China; licensenumber, SYXK (Yue) 2011 0074] at 8 weeks of age. ZDFrats had ad libitum access to Purina LabDiet 5008 ratchow (protein 23%, fat 6.5%, carbohydrates 58.5%, fiber4% and ash 8%) and purified water throughout the experiment. Rats at the age of 11 weeks with random bloodglucose levels 300 mg/dl (16.7 mmol/L) were considered to be diabetic. Then they were randomly dividedinto 4 groups of 7 animals per group: i) diabetic controlgroup (ZDF group; n 7):received vehicle (saline) s.c. perday; ii) diabetic group treated with insulin (INS group;n 7):administered long-lasting insulin (insulin glargine,Sanofi, France) s.c.per day; iii) diabetic group treatedwith DPP-4 inhibitor saxagliptin (SAXA group; n 7):given saxagliptin (AstraZeneca, London, England) byusing intragastric gavage at the dosage of 10 mg/kg/24 h;iv) diabetic group treated with Glp1r agonist liraglutide(LIRA group; n 7): injected liraglutide (Novo Nordisk, Copenhagen, Denmark) subcutaneously at the doseof 200μg/kg/12 h. The dosages of the above two drugsare as described previously [9, 10]. Blood glucose, bodyweight and food intake were monitored simultaneouslyevery week, meanwhile blood samples were collectedfrom the tail veins and plasma glucose concentrationswere estimated by a glucose meter (ACCU-CHEK Active,Roche Diagnostics, Basel, Switzerland). At the end of20 weeks, the rats were anesthetized with 2.5% pentobarbital sodium and the bold samples were collected fromleft ventricle for the measurements of plasma glucose,total cholesterol (TC), triglycerides (TG), low-densitylipoprotein cholesterol (LDL-c), high-density lipoprotein cholesterol (HDL-c), calcium, and phosphate, utilizing an automatic biochemical analyzer (Aeroset,American). Besides, glycated hemoglobin (HbA1c) levelsTable 1 Antibodies listAntibody NameDilution ratioProduct No.CompanyRabbit anti-Glp1r antibody (rabbit monoclonal to Glp1r)1:500 (WB)1:200 (IF)ab218532Abcam PlcRabbit anti- Rage antibody (rabbit monoclonal to Rage)1:500 (WB)1:200 (IF)ab216329Abcam PlcMouse anti-Gapdh antibody (mouse monoclonal to Gapdh)1:1000 (WB)ab8245Abcam PlcRabbit anti-Gapdh antibody (rabbit monoclonal to Gapdh)1:1000 (WB)ab181602Abcam PlcRabbit anti-Cyclophilin B antibody (rabbit polyclonal to Cyclophilin B)1:1000 (WB)ab16045Abcam PlcGoat HRP-conjugated antibody (Goat Anti-Rabbit IgG HRP)1:1000 (WB)ab6721Abcam PlcRabbit HRP-conjugated antibody (Rabbit Anti-Mouse IgG HRP)1:1000 (WB)ab6728Abcam Plc1:300 (IF)ab150083Abcam PlcGoat Anti-Rabbit IgG HRP (Alexa Fluor 647) preadsorbedWB Western Blot, IF Immunofluorescence, HRP Horse radish peroxidase
Cheng et al. BMC Musculoskeletal Disorders(2022) 23:465Page 3 of 13were detected in serum sample using VARIANT TURBOinstrumentation (Bio-Rad). Alkaline phosphatase, liver/bone/kidney (Alpl), osteocalcin (Ocn), procollagen1N-terminal peptide (P1NP), C-terminal telopeptideof collagen type 1 (CTX) were determined by mouseenzyme-linked immunosorbent assay (ELISA) (Uscnlife,Wuhan EIAab Science Co, Ltd., Wuhan, China).properties included maximum load (ultimate strength),maximum displacement, stiffness (the linear part of thecurve representing the slope of the elastic deformation),and energy absorption (area under the curve) were calculated based on the load-deformation curve.Analysis of bone structureAGEs-bovine serum albumin (AGEs-BSA) was preparedaccording to previously reported [11]. AGEs-BSA wasproduced by incubation of100mg/ml BSA with100mMribose in 150 mM phosphate buffered saline (PBS), understerile conditions, pH 7.4 at 37 C for 3 weeks. Unincorporated sugars were removed by PD-10 column chromatography and dialysis against phosphate-buffered saline.Control non-glycated BSA was incubated in the sameconditions except for the absence of reducing sugars. TheAGEs-BSA was passed through a Detoxi-Gel column toremove contaminated endotoxin. Endotoxin levels in thepreparation were determined with the amebocyte lysateassay kit and were found to be below 0.25 EU/ml. Thesuccessfully prepared AGEs were assessed by their characteristic fluorescence-emission maximum at 420 nmupon excitation at 340 nm.Analysis of the trabecular bone architecture was carried out in a 2.5-mm-thick region, 1.2 mm distal to thegrowth plate of the knee joint. All specimens were analyzed at a 20 μm nominal resolution with a SHARPmicro-Computed Tomography (micro-CT) scanner andthe associated analysis software (ZKKS-MCT, SHARP,Japan). Images were reconstructed based on Feldkampconvolution back-projection algorithm and segmentedinto binary images (8-bit BMP images) using adaptivelocal thresholding. The same thresholding was appliedto the images to separate the trabecular bones from thebackground, as described previously [11]. The parameters including volumetric bone mineral density (BMD),percent bone volume with respect to trabecular volume,trabecular thickness, trabecular separation, trabecularnumber, structure model index, and cortical thicknesswere measured.Oral glucose tolerance test (OGTT)After a 12 h overnight fast and with free access to waterprovided, the rats in each group were given glucose at aconcentration of 2 g/kg of body weight via intragastricgavage,without anesthesia. Blood samples which werecollected from the tail vein were taken at 0 (prior to glucose concentration), 30, 60, 90 and 120 min. Blood glucose area under curve (AUC) is calculated from the areabetween 0 h and 2 h in the OGTT curve.Food consumption evaluationDaily food intake is calculated by the difference betweenthe amount of food provided and the amount of food leftover after 24 hours, displayed in gram (g) and energy [12].Biomechanical testingAfter slowly thawed, the left femur was placed in a material testing machine (InstronElectroPuls, E1000, USA)on two supports separated by a distance of 20 mm. Atthe same time, a three-point bending test was performedby applying a load at the midpoint of the right femoraldiaphysis whose biomechanical quality was measured ata loading speed of 2 mm/min. When the central loading point was displaced, the load and the displacementwere recorded until the specimen was broken. From therecorded resulting forces and displacements, structuralAGEs‑BSA preparationMature osteoblast derived from mouse long boneTwo one-month-old C57 mice were sacrificed. The boneswere cut from isolated femurs and tibiae, digested with0.8 ml collagenase and then got population for 4 times.Then it was inoculated into a culture medium, whichwas then incubated with α-MEM and 10%FBS mediumat 37 C in a humidified atmosphere of 5% CO2. AGEs,GLP-1 or exendin were added to the culture. Cultureswere grown for 8 days with half medium changes twicedaily.MTT assayThe cells were seeded in 96-well plates. After experimental treatments, following by 150 μl DMSO, colorimetric3-(4, 5-dimethylthiazol-2-yl)-2, 5-dihenyltetrazoliumbromide MTT solution was added to each well. Absorption was measured at 570 nm with a microplate reader.The cell injury was determined by the absorbance measured by MTT assay.Alkaline phosphataseThe cells were rinsed with PBS and then fixed in 10% formalin at room temperature for 15 min. After the fixedsolution was removed, the cells were washed with D.I.water. Adding the 1-Step NBT/BCIP Solution (ThermoScientific), the staining process lasted for up to 1 hour
Cheng et al. BMC Musculoskeletal Disorders(2022) 23:465under monitoring. The staining solution was aspiratedand the cell layer was washed with D.I. water three timesfollowed by air dry.Immunofluorescent stainingAfter treatment, the cells were washed twice with PBSand fixed with 3.7% formalin solution for 10 min at roomtemperature. Then, the cells were permeabilized with0.5% Triton X-100 in PBS for 10 min and blocked with3%BSA in PBS for 1 h. After incubation with the specificprimary antibody (1:200) overnight at 4 C, slides werewashed 2 times with PBS Tween-20 (PBST) for 10 mineach. Secondary fluorescence antibodies (1:300) in PBSTwere incubated for 1 h at room temperature and nucleiwere subsequently stained with DAPI. Utilizing the laserconfocal microscope (FV10-ASW, Olympus, Tokyo,Japan) to captured the images.RT‑PCR for detection of different markersTotal RNA was extracted from osteoblasts and right tibiaafter treatments, using TRIZOL.reagent. Reverse transcription was conducted with0.8 μg of total RNA using the PrimeScript one-step RTPCR kit. Real-time PCR was carried out in a Real-TimePCR System (Stratagene/Agilent Technologies, Wilmington, DE, USA) using SYBR Premix Ex TaqII. The cyclingconditions were as follows: 95 C for 2 min and 40 cyclesof 95 C for 5 sec, 60 C for 30 sec [11]. For each rat, thegene expression was normalized with that of the housekeeping gene Gapdh and expressed as 2 -ΔΔCt. The following primers were used [13, 14]: Gapdh region sense:AGA CAG CCG CAT CTT CTT GT and region antisense:TGA TGG CAA CAA TGT CCA CT; Osx region sense:GGC TTT TCT GTG GCA AGA GGTT and region antisense:CGC TGA TGT TTG CTC AAG TGGTC;Alplregion sense: CCA GAA AGA CAC GTT GAC TGTGG,and region antisense: TCT TGT CCG TGT CGC TCA CCAT; Ocn region sense: AGC TCA ACC CCA ATT GTG AC and region antisense: TCC TGG AGA GTA GCC AAA GC; Opn region sense: GCT AAG CCT CAG CAT CCT TGand region antisense: AAG CAA ACC ACT GCC AGT CT;Rage region sense: ACA GAA ACC GGT GAT GAA GG,and region antisense: ATT CAG CTC TGC ACG TTC CCT.Western blot analysis for detection of different markersAfter one night of starvation in serum-free medium, theosteoblasts were stimulated for 3 days under the aboveculture conditions. Proteins were then extracted fromthe osteoblasts using RIPA lysis buffer. The primaryantibodies were rabbit anti-Glp1r IgG (1:500), rabbitanti-Rage IgG (1:500), mouse anti-Gapdh IgG (1:1000),Page 4 of 13rabbit anti-Gapdh IgG (1:1000), rabbit anti-CyclophilinB IgG (1:1000), and the secondary antibody was goatHRP-conjugated IgG (1:1000) and rabbit HRP-conjugated IgG (1:1000). The blots were cut prior to hybridisation with antibodies during blotting, and the ECLchemiluminescence detection system was used to determine the bands.Determination of ROS generationThe flow cytometry and the probe DCFH-DA were usedto detect the intracellular ROS production. Osteoblastswere grown in 10 cm plates and simultaneously subjected to various culture conditions as described abovefor 2 hours. Afterwards, control medium containing with10 μM DCFH-DA replaced the medium, which then wasincubated in the dark for 30 minutes. Intracellular ROSgeneration was observed under a fluorescent microscope(Olympus, Tokyo, Japan). The flow cytometer was used todetermine the DCF fluorescence, and the data were normalized to the control values.Statistical analysisData were expressed as mean SD and analyzed usingSPSS for Windows version 15.0 (SPSS Inc., Chicago, IL,USA). One-way ANOVA followed by the Newman-Keulstest or Dunnett’s T3 (equal variances not assumed) wasperformed for multiple comparisons. Differences atP 0.05 were considered to be significant.ResultsMetabolic parameters in diabetic ratsThe food intake of ZDF control rats was increasing everyweek, while a decreasing trend of weekly food intakewas observed in the ZDF rats treated with liraglutide(Fig. 1A). The body weights of ZDF rats were heaviercompared to lean rats at all the time points (P 0.001)(Fig. 1B). Insulin significantly increased the weightof ZDF rats. It is noticeable that the weight of bothuntreated ZDF rats and ZDF rats treated with liraglutidedecreased to the same level as the lean group (Fig. 1B).However, the weight did not decrease in the insulin andsaxagliptin treated rats (Fig. 1C).Furthermore, ZDF rats exhibited an elevated blood glucose compared to lean controls (Fig. 1D). After the treatment of insulin, saxagliptin or liraglutide, the glucoseAUC of.OGTT demonstrated impaired glucose tolerance in theZDF, INS group, SAXA group and LIRA group. (Fig. 1E,F) Insulin and liraglutide decreased fasting blood glucose(FBG) (Fig. 1E) and HbA1c level at the end of the 20thweek (P 0.001) (Fig. 1H).
Cheng et al. BMC Musculoskeletal Disorders(2022) 23:465Page 5 of 13Fig. 1 Metabolic parameters in ZDF rats. A Foodtake throughout the study period; B Body weight throughout the study period; C Body weightchanges (at Week 21 from Week 11); D Blood glucose throughout the study period; E Blood glucose profiles during the OGTT at the end of 9 weekstreatment; F AUC of the blood glucose profiles during the OGTT at the end of 9 weeks treatment; G Blood glucose changes (at Week 21 fromWeek 11); H HbA1c at the end of 9 weeks treatment. 11-week-old ZDF rats were randomly assigned into four subgroups: treated with vehicle(ZDF); treated with insulin (INS); treated with saxagliptin (SAXA); treated with liraglutide (LIRA). OGTT, oral glucose tolerance test; HbA1c, glycatedhemoglobin; AUC, area under curve. The Newman-Keuls Multiple Comprison Test was used, and (mean, SD) was displayed above the bar. &P 0.05,&&P 0.01, &&&P 0.001 vs. ZLC group; *P 0.05, ** P 0.01, *** P 0.001 vs. ZDF group; #P 0.05, ## P 0.01, ### P 0.001 vs. LIRA groupLiraglutide ameliorated bone remodeling parametersof ZDF ratsLiraglutide improved bone trabecular microarchitectureof ZDF ratsBone remodeling parameters were listed in Fig. 2A-I. Theserum concentration of Ocn was significantly increasedafter treatment of insulin, saxagliptin and liraglutide(Fig. 2A). Liraglutide increased the serum activity ofAlpl in ZDF rats. However, similar changes could notbe observed in saxagliptin group (Fig. 2B). No statistically significant change in serum P1NP level was noticed(Fig. 2C). CTX was decreased significantly after treatment with liraglutide (Fig. 2D).Besides, biochemical markers in femur were alsodetected (Fig. 2E-H). The treatment of insulin, saxagliptin, and liraglutide could reverse the decreased expression of Opn. Significant increases in Osx levels wereobserved in ZDF rats after in three groups.As displayed by the micro-CT scans, ZDF rats exhibitedfewer, thinner and more broken trabecular bones, as wellas lower BMD in femur compared with the rats in the normal control group (Fig. 3A-J). The trabecular architecturewas remarkably improved in the liraglutide- and insulintreated ZDF rats compared with the control ZDF rats.Liraglutide affected the gene expressions of rageThe expression of Rage in transcriptional level wasdetected after insulin, saxagliptin or liraglutide for9 weeks (Fig. 2I). The expression of Rage mRNA inZDF group significantly increased compared to thelean group (P 0.05). Liraglutide and insulin reducedthe expression of Rage to a level comparable to leancontrols.Liraglutide increased the bone strength of ZDF ratsThree-point bending assessment of cortical bone revealedthat ZDF rats presented with the lower mechanicalresponses, including max load, fracture load and stiffness(Fig. 3K-P). Liraglutide treatment resulted in a significant increase in both fracture load (P 0.05, 70.5%) andstiffness (P 0.01, 38.3%). However, no significant difference was observed in max load, ultimate displacement,yield displacement and total absorbed energy betweenthe liraglutide group and ZDF group.GLP‑1 attenuated AGEs‑mediated damagein the proliferation of osteoblastsGlp1r protein was presented in the long bone-derivedosteoblasts detecting by both immunocytochemistry (Fig. 4A) and western blot (Fig. 4B). The osteoblasts
Cheng et al. BMC Musculoskeletal Disorders(2022) 23:465Page 6 of 13Fig. 2 Effects of 9 weeks treatment on serum and bone remodeling parameters. A-D Serum bone remodeling parameters; E-H mRNA levels ofbone remodeling parameters in femur; (I) mRNA levels of Rage in femur. Ocn, osteocalcin; Alpl, bone alkaline phosphatase; P1NP, procollagen type1 N-terminal peptide; CTX, C-terminal telopeptide of collagen type 1; Opn, osteopontin; Osx, Osterix; Rage, receptor for AGEs. Values are means SD(n 7). The Newman-Keuls Multiple Comprison Test was used. &P 0.05, &&P 0.01, &&&P 0.001 vs. ZLC group; *P 0.05, ** P 0.01, *** P 0.001 vs.ZDF group; #P 0.05, ## P 0.01, ### P 0.001 vs. LIRA groupwere induced by control medium, BSA(200 μg/mL) andAGEs(200 μg/mL) in the absence or presence of the indicated concentration of GLP-1, which was renewed onceevery day. Osteogenic proliferation was evaluated byMTT assay (Fig. 4D). The OD value (0.30 0.01) in AGEsgroup was significantly lower than the control group(0.48 0.01) (P 0.001). After treatments with 50 and100 nM GLP-1, the OD value significantly increased thanthat in AGEs group. These results indicated that GLP-1not only reversed the osteogenesis inhibitory effect ofAGEs, but also ameliorated osteoblasts proliferation in adose-dependent manner.GLP‑1 attenuated AGEs‑mediated damagein the differentiation of osteoblastsThere was an obvious increase in Alpl staining afterGLP-1 was added to mice osteoblasts that undergoing induced osteoblastogenic differentiation for 7 days(Fig. 4C). As shown in Fig. 4E-H, the transcriptionallevels of Ocn, Alp, and Opg were all decreased after exposure to AGEs. Pre-treatment of osteoblasts with 100 nMGLP-1 led to the increased mRNA expressions of Ocn,Alpl, Opg, and Runx2 compared with the AGEs group.GLP‑1 attenuated AGEs‑mediated oxidative stressin osteoblasts partly through the RAGE pathwayOxidative stress was examined by fluorescence microscopy. DCF fluorescence of osteoblasts exposed to AGEswas strikingly increased compared with the controlgroup (P 0.001) (Fig. 5A, B). DCF fluorescence of theAGEs GLP-1 group was significantly lower than thatof the AGEs group(P 0.01). After adding Exendin(Glp1r blockers), DCF fluorescence was recoveredand significantly higher than that of the AGEs GLP-1group (P 0.01).After treatment with AGEs for 96 h, the fluorescenceintensity of Rage was strengthened and significantlyhigher than the BSA group. After GLP-1 treatment, the
Cheng et al. BMC Musculoskeletal Disorders(2022) 23:465Page 7 of 13Fig. 3 Bone effect of ZDF rats after treatment of Liraglutide. A-I The distal femur of structural bone parameters analyzed by micro-CT; B Totalbone mineral density (BMD); C trabecular BMD; D cortical BMD; E Bone volume per total volume (BV/TV); F Trabecular number (Tb.N); G Trabecularthickness (Tb.Th.); H Trabecular spacing (Tp.Sp.); I Structure model index; J Cortical thickness (Ct.Th.); K-P Femoral biomechanical structuralproperties in ZDF rats via three-point bending test, including max load, fracture load, ultimate displacement, yield displacement, stiffness, and totalabsorbed energy. Values are means SD (n 7); The Newman-Keuls Multiple Comprison Test was used. &P 0.05, &&P 0.01, &&&P 0.001 vs. ZLCgroup; *P 0.05, ** P 0.01, *** P 0.001 vs. ZDF group; #P 0.05, ## P 0.01, ### P 0.001 vs. LIRA groupfluorescence intensity of Rage was obviously decreased,and this could be reversed by the addition of Exendin(Fig. 5C). Consistently, both the Rage mRNA and proteins in osteoblasts were significantly higher in theAGEs group than those in the control group. GLP-1significantly down-regulated the Rage expression.Exendin, again, could reverse the effects of GLP-1on the expression of Rage in both transcriptional andtranslational levels (Fig. 5D).DiscussionGLP-1 plays a vital role in bone turnover [15]. In ananimal experiment, GLP-1 or exendin-4 was used totreat alone to reversed the decrease of bone in femursand vertebrae in hyperlipidemia and hypercaloricWistar rats [16]. However, in a clinical trial, T2DMpatients treated with metformin were concurrentlyreceived either exenatide or insulin glargine, only theexenatide group lost body weight significantly and hadmaintained bone mineral density levels after 44 weeksof treatment [17], which is due to weight loss [18], andinsulin administration may contribute to reduction inbone resorption [19]. These results suggest that exenatide may promote BMD as well as weight reductioncompared with insulin. Otherwise, in an open-label,randomized, controlled trial, comparing the effect of37 perimenopausal non-diabetic women treated with1.2 mg liraglutide once daily with no treatment, thesystemic and peripheral bone mineral content (BMC)in the treated group was significantly higher than the
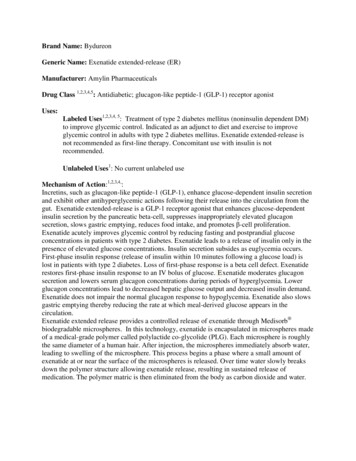
Cheng et al. BMC Musculoskeletal Disorders(2022) 23:465Page 8 of 13Fig. 4 Effect of GLP-1 on the AGEs-mediated damage in proliferation and differentiation of osteoblasts. A, B Glp1r protein was detected byimmunofluorescence and western blot; C Alpl staining, which indicates the early stage of osteoblastogenesis was performed at the indicated timepoints; D Cell proliferation was measured by the absorbance at 570 mm with a MTT assay; E-H. The mRNA expression of osteogenic differentiationmarkers (Ocn, Alpl, Opg, Runx2) of osteoblasts assessed by real-time PCR. Ocn, osteocalcin; Alpl, Alkaline phosphatase, liver/bone/kidney; Opg,osteoprotegerin; Runx2, Runt-related transcription factor 2. Values are means SD from three independent experiments. The Newman-KeulsMultiple Comprison Test was used. *P 0.05, **P 0.01, ***P 0.001 vs. control group; #P 0.05, ##P 0.01, ###P 0.001 vs. AGEs groupuntreated group. Liraglutide increased the bone formation marker (P1NP) without concomitant increase inbone resorption markers (CTX) [3]. Nevertheless, themechanism of GLP-1 on bone turnover in type 2 diabetes remains unknown. In our study GLP-1 was demonstrated to attenuate the AGEs-mediated damage toosteoblast proliferation and differentiation through theRAGE pathway in vitro.Studies illustrated that Glp1r was expressed inmature cells, such as MC3T3-E1 cells [20], osteocytelike MLO-Y4 cells [21]. We focus on mature osteoblastsderived from mouse long bone, which represent bioactivity of osteoblast in vivo better. We proved that Glp1rexisted in the mature murine osteoblasts by immunocytochemistry and western blot. GLP-1 and its receptoragonist can regulate bone metabolism directly becauseof the expression of Glp1r in osteoblasts.Liraglutide exerted anabolic effects on the skeleton innon-obese spontaneous diabetic rats [22]. However, thereare few pieces of evidence to evaluate the effects of GLP-1in obese diabetic models. As a common animal model oftype 2 diabetes, ZDF rats exhibit the same insulin resistance and reduced insulin production as human patients[23]. Previous studies have detected lower bone formation markers and higher bone resorption markers in ZDFrats [24], which were consistent with our results. Aftertreatment of liraglutide, significant attenuation of trabecular bone loss and marked improvement of the trabecularbone structure were observed, which can be attributed tothe conservation of trabecular number and BMD. Furthermore, the ultimate load to fracture increased significantly in the femora of liraglutide-treated compared tothe untreated diabetic animals, indicating an increase inbone density and strength. Generally, diabetic subjectswho gained weight had slightly higher bone mass thannon-diabetic subjects during the initial weight gain phaseof diabetes, however, in the present study, as displayed bythe micro-CT scans, ZDF rats exhibited fewer, thinnerand more broken trabecular bones, as well as lower BMDin femur compared with the rats in the normal control
Cheng et al. BMC Musculoskeletal Disorders(2022) 23:465Page 9 of 13Fig. 5 Effect of GLP-1 on the AGEs-mediated ROS and Rage expression. A, B Intracellular ROS generation was measured with the probe DCFH-DA,and visualized using a fluorescent microscope; C Immunofluorescence was used to detect Rage antibody (red fluorescence)
Analysis of the trabecular bone architecture was car-ried out in a 2.5-mm-thick region, 1.2mm distal to the growth plate of the knee joint. All specimens were ana-lyzed at a 20μm nominal resolution with a SHARP micro-Computed Tomography (micro-CT) scanner and the associated analysis software (ZKKS-MCT, SHARP, Japan).