Transcription
Hunt Allocation Modeling for Migrating Animals:The Case of Baffin Bay Narwhal, Monodon monocerosCORTNEY A. WATT, THOMAS DONIOL-VALCROZE, LARS WITTING, RODERICK C. HOBBS,RIKKE GULDBORG HANSEN, DAVID S. LEE, MARIANNE MARCOUX, VERONIQUE LESAGE,EVA GARDE, STEVEN H. FERGUSON, and MADS PETER HEIDE-JØRGENSENIntroductionparticular challenge for ensuring individual stocks are managed sustainably (Allen and Singh, 2016); thus, amodeling approach that accounts forthis movement and mixing of stocksis needed (Ogburn et al., 2017). In thisway, removals can be attributed to thestock of origin, regardless of the timeof year or location of the hunt.In many cases, genetic samples andphenology of catches are used to estimate the portion of each stock available to hunters at different huntingsites, across seasons (de March andPostma, 2003; Shafer et al., 2014;Doniol-Valcroze et al.1). However,in cases such as narwhals, Monodonmonoceros, where genetic variation isvery low (Palsbøll et al., 1997; Westbury et al., 2019; Louis et al., 2020;Petersen et al.2) other methods suchas telemetry, diet, behavioral studies,or local knowledge may be used to as-doi: https://doi.org/10.7755/MFR.81.3–4.8rison et al., 2018). Migration patternsfollow predictable routes and seasonaltiming such that the exposure to potential interactions with anthropogenicactivities may occur at a number of locations annually each for a short period of time (Rosenbaum et al., 2013;O’Corry-Crowe et al., 2016; Forneyet al., 2017; Watt et al., 2017). Understanding migration of animals andresidency time becomes particularlyimportant for sustainable management of hunted species (Harrison etal., 2018). Movement of animals hasbeen considered particularly importantfor developing and implementing conservation measures (Cooke, 2008; McGowan et al., 2017), but there are fewexamples where movement and harvestdata have been integrated for sustainable management of hunted species(although see Nichols et al., 1995).Sustainable management of huntingtypically divides species into management units, or stocks (hereafter referred to as stocks) that are thought tobe self-sustaining, and often definedbased on genetic indicators, residency time, site-fidelity, or other life history characteristics (Begg et al., 1999;Hobbs et al., 2019). Movement ofanimals among hunting regions andhunting regions in which hunters haveaccess to more than one stock pose aABSTRACT— Hunted animals are oftenmanaged as static management units, orstocks, specific to hunting regions. However, movement of animals between regionsposes a particular challenge for management to ensure that the hunt of individualstocks is sustainable. The incorporation ofgenetic information in stock assessmentscan improve management decisions, but theresolution of genetics may not differentiatestocks, making the use of movement datanecessary. The Joint Working Group of theNorth Atlantic Marine Mammal Commission (NAMMCO) and the Canada-Greenland Joint Commission on Conservationand Management of Narwhal and Beluga(JCNB) has developed a model that allocates catches in different hunting regionsand seasons to different stocks based onmovement data, local knowledge, and expert opinion. The model uses informationon stock size, catches in different hunting areas/seasons, and a matrix which estimates the proportion of animals in eachstock that are available to hunters in different regions and seasons. This matrix canbe informed by quantitative data on stockstructure (e.g., genetics, telemetry) or qualitative information (local knowledge, expertopinion, etc.). Uncertainty in the availability of animals and individual stock sizes isincorporated in a stochastic version. Themodel is presented using a case study ofnarwhals, which are managed as stocksbased on their summer distribution in Canada and Greenland.Marine mammal populations orstocks often have large spatial distributions and follow seasonal migrationpatterns that expose them to taking byhunters or other risks at different timesand locations throughout the year(Heide-Jørgensen et al., 2003; Valenzuela et al., 2009; Foote et al., 2010;Horton et al., 2017), and often acrossmany international jurisdictions (HarCortney A. Watt, Marianne Marcoux, and Steven H. Ferguson are with the Department ofFisheries and Oceans Canada, 501 UniversityCrescent, Winnipeg, MB R3T 2N6, Canada.Thomas Doniol-Valcroze is with Fisheries andOceans Canada, Pacific Biological Station, 3190Hammond Bay Road, Nanaimo, BC V9T 6N7,Canada. Lars Witting is with Greenland Instituteof Natural Resources, P.O. Box 570, DK-3900,Nuuk, Greenland. Roderick C. Hobbs is with theNorth Atlantic Marine Mammal Commission,recently retired from the NOAA’s NMFS MarineMammal Laboratory, and his current addressis 6130 NE 204th Street, Kenmore, WA 98028USA. Rikke G. Hansen, Eva Garde, and MadsPeter Heide-Jørgensen are with the GreenlandInstitute of Natural Resources, Strandgade 91,2. DK 1401 Copenhagen K, Denmark. DavidS. Lee is with the Nunavut Tunngavik Incorporated, Department of Wildlife and Environment,Ottawa ON K1P 5E7, Canada. Véronique Lesage is with the Department of Fisheries andOceans, Maurice Lamontagne Institute, 850,Route de la Mer, P.O. Box 1000, Mont-Joli, QCG5H 3Z4, Canada. Corresponding author is C.A. Watt roze,T., J.-F. Gosselin, and M. O.Hammill. 2012. Population modeling and harvest advice under the precautionary approachfor eastern Hudson Bay beluga (Delphinapterusleucas). DFO Can. Sci. Advis. Sec. Res. Doc.2012/168:iii 31 p. (http://waves-vagues.dfompo.gc.ca/).2Petersen, S. D., D. Tenkula, and S. H. Ferguson.2011. Population genetic structure of narwhal(Monodon monoceros). DFO Can. Sci. Advis.Sec. Res. Doc. 2011/021:vi 20 p. .pdf).125
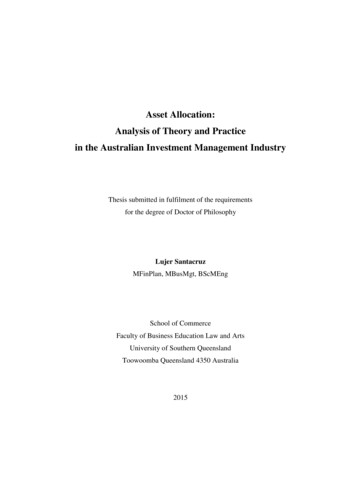
Figure 1.—Summer distribution of narwhal stocks in the Canadian high Arcticand in West Greenland. NSIDC Sea Ice Polar Stereographic North projection isused.sign removals to the stock of origin. Ineither case, when all takes cannot beassigned positively to a single stockthere will be uncertainty in the assignments and a need for a probabilisticassignment scheme.The Joint Working Group consistingof the North Atlantic Marine Mammal Commission (NAMMCO) Scientific Committee Working Group onthe Population Status of Narwhal andBeluga in the North Atlantic and theCanada-Greenland Joint Commissionon Conservation and Management ofNarwhal and Beluga (JCNB) Scientific Working Group developed a modelthat estimates the number of animalsremoved from each stock, using information on movements of each stockto determine which stocks are available to hunters in different hunting ar126eas and seasons. The model has broadapplication to estimating removals inother migrating marine or terrestrialspecies impacted by anthropogenicactivities (e.g., hunting, exposure tonoise, fishery bycatch) in multiplelocations and seasons where mixedstocks are present. We developed themodel and used it in a case study focused on narwhals.Narwhals from the Baffin Bay population are part of the subsistence huntby a number of communities in theArctic in Canada and Greenland. Thispopulation of narwhals is estimatedat approximately 140,000 individuals(Doniol-Valcroze et al.1), and spendssummers in the inlets and fjords ofnortheastern Canada and westernGreenland (Dietz et al., 2001; HeideJørgensen et al., 2002, 2003; Laidreet al., 2004; Dietz et al., 2008). Narwhals show site fidelity to their summering region (Heide-Jørgensen et al.,2002, 2003), with nearly all of the fewanimals tracked by satellite telemetryfor a year, returning to the summering aggregation where they were captured (but see Watt et al.3). To avoidlocal depletion, management of thehunt has been based on these individual summer aggregations of the BaffinBay population, referred to as stocks(Hobbs et al., 2019).There are six defined narwhal stocksin the Baffin Bay population in northern Canada: the Admiralty Inlet,Somerset Island, Eclipse Sound, EastBaffin Island, Smith Sound, and JonesSound stocks (Doniol-Valcroze et al.4)(Fig. 1). In West Greenland there aretwo defined stocks from the BaffinBay population: the Melville Bay andInglefield Bredning stocks (Heide-Jørgensen et al., 2013) (Fig. 1).Narwhals are hunted in a numberof regions across the Canadian Arctic and West Greenland (based on local knowledge; Fig. 2). In Canada, thehunt occurs primarily during summer,but individuals hunted from the Baffin Bay population spend the winter inDavis Strait and Baffin Bay and passthrough a number of hunting areas onthe migration to and from their summering area (Heide-Jørgensen et al.,2013). In addition, whales from someof the Canadian stocks are also available to hunters in West Greenland onthe fall and winter hunting grounds(Heide-Jørgensen et al., 2013).Narwhal stocks have been managedindependently of one another, but because of the mixing of stocks duringthe migration and on the fall and win3Watt,C. A., J. Orr, B. LeBlanc, P. Richard, andS. H. Ferguson. 2012. Satellite tracking of narwhals (Monodon monoceros) from AdmiraltyInlet (2009) and Eclipse Sound (2010-2011).DFO Can. Sci. Advis. Sec. Res. Doc. 2012/046.iii 17 p. .pdf).4Doniol-Valcroze, T., J.-F. Gosselin, D. Pike,J. Lawson, N. Asselin, K. Hedges, and S. Ferguson. 2015. Abundance estimates of narwhal stocks in the Canadian High Arctic in2013. DFO Can. Sci. Advis. Sec. Res. Doc.2015/060:v 36 p. df).Marine Fisheries Review
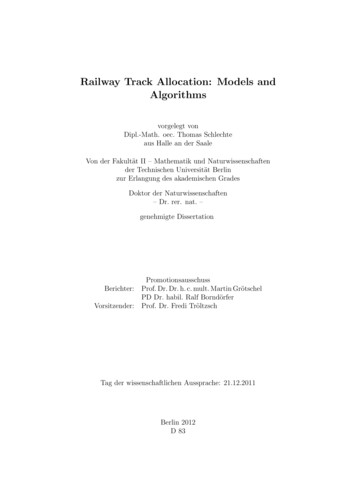
ter grounds, a framework that considers stocks to be shared across multiplecommunities of the two countries wasdeveloped to ensure conservation andsustainable management. We presenta hunt allocation model that has beenapplied to narwhal stocks to demonstrate the utility of the model and itsability to inform conservation andmanagement goals for this marinemammal.Model DevelopmentThe stock allocation model assumesthat in a region with a hunt from a mixture of stocks, the number of animalstaken is proportional to the relativenumber of individuals from each stockthat visit the areas. However, it is oftenthe case that not every animal from agiven stock visits the hunting region;i.e., not all individuals from a stock are“available” for the hunt. Probabilitiesof being taken in the hunt will thus berelative to the portions of each stockthat visit the area (instead of their total abundance). Therefore, to allocateremovals to the specific stocks, themodel requires information on the sizeof each stock, removals (landed catchplus struck-but-lost) in each huntingregion, and the portion of each stockavailable to hunters in the differentlocations and seasons. Hunting communities report “landed catch,” thenumber of successfully landed huntedanimals; a “struck-but-lost” rate whichaccounts for animals that were likelykilled or severely injured but not recovered and in some cases an “under reporting” rate are applied to thelanded catch to estimate total removals(Garde et al., 2019).Allocation MatrixThe allocation matrix, A, which assigns takes from hunting locations andseasons, is developed in the form of atable with one column for each stock,and rows representing the different areas by season where hunts take place.It is devised so that when transposedand multiplied by a vector of removals by each hunt (area and season) ina year, the number of removals fromeach stock can be estimated.81(3–4)Figure 2.—Harvest locations for narwhal in Canada and Greenland.Each cell of the allocation matrix, A,has the value:PNAij ij iΣi Pij N iWhere,Aij is the proportion of the jth huntthat is assigned to the ith stock,Pij is the proportional availabilityof the ith stock to the jth hunt,an element of the proportionalavailability matrix, andNi is the abundance of the ith stock.This model assumes that for eachstock there is a portion of animalsin the stock, between zero and one(Pij), that are available to hunters during the hunting period, on the hunting grounds. Each individual that isavailable is then at equal risk of beingtaken in the hunt. The sum of the Aijshould be 1 for each row of the matrix so that all animals taken in thehunt are assigned to stocks since eachanimal originated from one of thestocks. Note that in areas with huntsfrom mixed stocks, animals will besplit among the stocks because of theuncertainty in the stock of origin. Thesum of the Pij, however, does not necessarily add up to 1 in each row because it is the fraction of each stockavailable to hunters, for instance ifhalf of each of three stocks are available at a location then the sum wouldbe 3/2. Likewise the Pij, does not necessarily add up to 1 in each columnbecause the same stocks can be hunted in several regions over the year andacross their migration.127
Table 1.— Definitions for the five designations given to each cell in the proportional availability matrix.Numberin textDesignation1Defined zero2Probable zero34Partial huntProbable hunt5Defined huntDefinitionImpossible situations such as a summer hunt in a location that was not at a summeringground of the stock, or hunts in areas in other seasons that could not have originated ina particular summering ground based on known movements, e.g., the location was notadjacent to the known migration route wintering ground of the stock.Unlikely to be hunted but proximity during the hunting season could not rule out takescompletely.Data shows a portion of the stock is available to hunters.Proximity between the stock location and hunting region makes movement or migrationto the hunting region almost certain, but where no data exists yet to confirm that thestock is available at the location.Hunts of the stock within their known home range or summer distribution.Proportional AvailabilityTo set up the proportional availability matrix, P, each cell in the matrix,i.e., hunt of a given stock at a locationin a season, is given one of five designations (Table 1), using informationfrom satellite tracking data, geography,seasonal timing, and expert opinion orlocal knowledge. Expert opinion is defined as opinion from those membersof the Joint Working Group that havespent a significant proportion of theircareer studying these animals. Thedesignation determines how the cell iscalculated. Designations “1. Definedzero” and “2. Probable zero” indicatethat a stock is very likely or certainlyunavailable to the hunt. For “3. Partial hunt”, data on structure within thestock suggests that only a portion ofthe stock is available to a hunt. An example is where data indicate that someanimals in a stock travel near shoreand others travel far offshore beyondthe reach of hunters.In this example the data (telemetryor other information), and hunter’sknowledge and expert opinion on thearea hunted are used to determine theproportional availability of the stockat a hunting site by season. The proportion is calculated as the number ofanimals from a stock that visit a hunting site during the hunting season (x)divided by the total number of animalsfrom that stock for which there is data(n).Hunting grounds that are known tohave only one stock available in a specific season, such as in the summeringground of the stock, are given a designation of “5. Defined hunt”, and the128proportional availability will be 1 forthat hunt, with no uncertainty. However, in cases where it is likely that onlyone stock is available but the information on animal availability is insufficient, then these hunts are designatedas “4. Probable hunt.” The distinctionbetween the defined and probable zeros and hunts becomes important inthe development of the stochastic allocation matrix described below.We developed a deterministic version of the model but since there isgeneral uncertainty around the proportional availability in the Partial huntsand some uncertainty also in the Probable zeros and Probable hunts, we alsodeveloped a stochastic version of theproportional availability matrix to account for this uncertainty. The deterministic and stochastic matrices Pdiffer in their treatment of the “probable” values, resulting in different versions of the allocation matrix A. In thedeterministic or “fixed” version of P,cells with defined (designations 1 and5 in Table 1) and probable (designations 2 and 4 in Table 1) zeros andhunts are given the value zero or onerespectively, and for “3. Partial hunt”the values are calculated from the proportion of animals available in thehunting areas from the tracking data(x/n; as explained above).In the stochastic version, the definedzeros and hunts are given the valueszero and one, respectively, as above,while the proportions for partial hunts(designation 3) as well as probable zeros and hunts (designations 2 and 4)are drawn randomly from beta distributions, with the variance (uncertainty) of the beta distribution increasingwith fewer animals with data availableor smaller values of the Z parameter(described below). The fixed matrixcan be used to provide single valueresults. The stochastic matrix can beused for sensitivity analysis and riskassessment on its own or with a stochastic vector of abundance estimatesor hunt takes.Quantifying UncertaintyThere are two main sources of uncertainty in the analysis: uncertaintyin the proportion of animals from onestock that are available to hunters at agiven hunting site (Pij), and errors instock abundance estimates (Nit).Animal AvailabilityUncertainty around the proportionof animals available (Pij) is quantifiedby assuming that the number of animals observed in a certain area followsa binomial distribution with a samplesize equal to the number of animalsfor which there exists data on availability (n) and a probability equal tothe true proportion of the animals inthat stock that visit the area. This trueproportion is unknown but we assumethat the likelihood of any one valuefollows a beta distribution Beta(x 1,n-x 1) (Johnson and Kotz, 1970)where x is the number of animals thatvisited the area.The mean of this distribution is(x 1)/(n 2), which converges towardsthe mean proportion in the fixed version (x/n) with increasing values of xand n. When no connection is documented between a stock and a huntingground, we distinguish between connections that are deemed extremelyunlikely based on expert opinion andconnections that are considered unlikely, but not impossible. The former(“1. Defined zeros” Table 1) are assigned a proportional availability of0, with no uncertainty. The latter (“2.Probable zeros” Table 1) are also assigned a proportional availability of 0,but are given a Beta(1, Z) probabilitydistribution, where Z is an uncertaintyparameter that can vary from 1 to infinity so that the mean of this distribution is 1/(Z 1) (larger values representMarine Fisheries Review
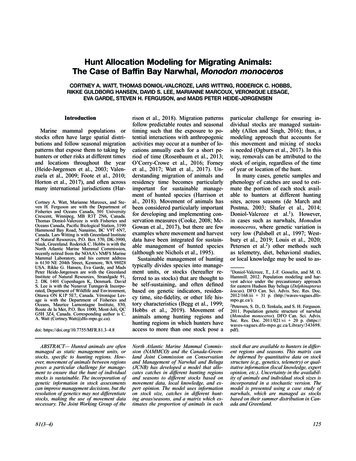
higher certainty i.e., closer to zero).Finally, there is the case of “4. Probable hunt”, which is parameterized bya Beta(Z, 1) distribution with mean (Z/Z 1), and represents cases where thereare no documented movements, but astrong connection is expected (may befrom expert opinion, local knowledge,etc.).In practice, the parameter Z canbe thought of as a hypothetical number of animals for which there is datathat would result in no animals visiting a hunting area (i.e., 0/Z number ofanimals), thus a minimum value for Zwould be the number of animals withdata to date and higher values wouldreflect certainty resulting from othersources (such as expert opinion, localknowledge, other data such as uniqueTable 2.—Fixed availability matrix Pij for narwhals from different summering stocks to different hunting regions(x/n; available (x) / total (n)) based on telemetry data (CCA: Central Canadian Arctic, BIC: Baffin Island Central,BIS: Baffin Island South; see Fig. 2 for hunt locations). “1. Defined zero”, and “5. Defined hunt” are represented by0 and 1, respectively, while 0* and 1* indicates “2. Probable zero, and “4. Probable hunt”. Ratios reflect information from satellite telemetry ingMelvilleBayEtahQaanaaqGrise FiordGrise FiordGrise FiordUpernavikUummannaqDisko BayCCACCACCAArctic BayArctic BayArctic BayPond InletPond InletPond 0011/91/70000000000000000Somerset Admiralty /4010/420/400/420/42EastBaffin 02/261/60000000*0*0000000*00*1111*11*1*stable isotope or trace element ratios,etc.). This parameter was used for sensitivity testing of the model, setting Zto be identical for all cells designatedas “2. Probable zero” and “4. Probablehunt” assuming Z 10,000 as the basecase (i.e., no uncertainty) which approximates the fixed matrix, to assuming Z as low as the n values for eachstock.Inclusion of uncertainty changesPij from a table with fixed values toa table in which each cell is a random variable (see Tables 2 and 3 forexample), and therefore changes theresulting allocation matrix Aij fromhaving fixed values to one where eachcell contains a probability distribution (see Fig. 3 and 4 for example).For cells with “1. Defined zero” or“5. Defined hunt”, these distributionshave essentially zero variance and result in a single value of 0 or 1, respectively. Cells with “2. Probable zero” or“4. Probable hunt” have a distributionwith mean equal to the correspondingvalue in the fixed version of the table,for which variance reflects uncertaintyaround this value. For these probablecells both mean and variance dependon the value of Z. The maximum valueof Z 10,000 results in a distributionnearly identical to “1. Defined zero” orTable 3.—Allocation matrix Aij (with no uncertainty) for narwhals from different summering stocks for different hunting regions (CCA: CentralCanadian Arctic, BIC: Baffin Island Central, BIS: Baffin Island South; see Figure 2 for hunt locations) and catches for each region. Note thatproportions in each line (each site) sum to 1 (all caught animals have to be allocated to a stock). Catches are multiplied by the correspondingallocation proportions for each site, then summed for each stock to yield total removals.81(3–4)HuntSeasonEtahQaanaaqGrise FiordGrise FiordGrise FiordUpernavikUummannaqDisko BayCCACCACCAArctic BayArctic BayArctic BayPond InletPond InletPond InletBICBICBICBISBISBISBISTotal dAdmiraltyInletEclipseSoundEastBaffin 482101661332343167430825811914331180971129
Figure 3.—Allocation matrix Aij with uncertainty in the designation “3. Partial Hunt” but no uncertainty in categories of “2. Probable zero” and “4. Probable hunt” (Z 10,000). Mean proportions are presented in each cell.Abbreviations are defined in Figures 1 and 2.130Marine Fisheries Review
Figure 4.—Allocation matrix Aij with uncertainty in the designation “3. Partial Hunt” and uncertainty in categories of “2. Probable zero” and “4. Probable hunt” (Z 1). Mean proportions are presented in each cell. Abbreviations are defined in Figures 1 and 2.81(3–4)131
Table 4.—Example of removals (and CV%) from each narwhal stock based on the allocation model output forGreenland and Canadian 2013 catches, under several assumptions. Z 10,000 includes uncertainty in the designation “3. Partial hunt” but assumes no uncertainty for “4. Probable zero”, while Z 1 includes maximum uncertaintyfor “4. Probable zero”. Fixed N assumes no uncertainty in abundance estimates while variable N includes uncertainty in abundance ast BaffinIsland098792195271198119Z 10,000fixed %)Z 1fixed 12(13%)Z 10,000variable (20%)Z 1variable 0%)111(25%)StocksFixed Allocation Matrix“5. Defined hunt”, respectively. Lowervalues of Z ultimately result in different means and larger coefficients ofvariation in the allocation matrix (described below in the case study and inFig. 3 and 4, and Table 4 where we explore Z values of 1 and 10,000).AbundanceAbundance estimates with givenmean (N) and coefficient of variation(CV) are assumed to follow a log-normal distribution with parameters μ andσ given by:µ logandN2N 2 (1 CV 2 )σ log(1 CV 1 )Monte-Carlo sampling is used to integrate uncertainty in abundance vectorsNit in the allocation matrix Aijt. Draw100,000 samples from a beta distribution for each cell in Pij and 100,000samples from a lognormal distribution for each value of Nit and calculatethe value of Aijt for each cell and eachsample.Stock Allocation ModelWith the development of the allocation matrix, At, the full model is then:St T(At) HtWhere,St is a vector of the number of narwhal taken in hunts from eachstock in year t,132T(At) is the transposed A matrix inyear t, andHt is a vector of the numbers ofnarwhal taken in hunts at eachhunting area by season in year t.As noted above, both At and Ht maybe stochastic, thus St could also bestochastic.Narwhal Case StudyTo highlight the applicability of themodel we use an example of narwhalhunted from eight different stocks:Smith Sound, Jones Sound, InglefieldBredning, Melville Bay, Somerset Island, Admiralty Inlet, Eclipse Sound,and East Baffin Island (Fig. 1), ineleven different regions (Fig. 2) and inmultiple seasons in some regions, for atotal of 24 hunts.RemovalsFor this case study we use landedcatch data reported by the huntingcommunities in Canada and Greenlandcorrected for struck-but-lost animalsin 2013 (Table 5; Watt and Hall5). Thestruck-but-lost factors (landed catchesare multiplied by the struck-but-lostfactors to estimate total removals) applied to the Arctic Bay, Pond Inlet,and Central Canadian Arctic hunts are1.35, 1.15, and 1.09, respectively, andare based on loss rates reported by the5Watt,C. A., and P. Hall. 2018. Catch statisticsfor narwhal (Monodon monoceros) in Canadafrom 1970-2015. Can. Tech. Rep. Fish. Aquat.Sci. 3270:vi 209 p. (http://waves-vagues.dfompo.gc.ca/).Table 5.—Removals of narwhal by season (landedcatches including estimated struck-but-lost animals)for hunts in Canada and Greenland in 2013 (CCA: Central Canadian Arctic, BIC: Baffin Island Central, BIS:Baffin Island South; see Figure 2 for hunt locations).HuntSeasonEtahQaanaaqGrise FiordGrise FiordGrise FiordUpernavikUommannaqDisko BayCCACCACCAArctic BayArctic BayArctic BayPond InletPond InletPond 31180communities of Arctic Bay, Pond Inlet,and Kugaaruk, Nunavut, Canada, foryears between 2005 and 2010 (Wattand Hall5). An average struck-but-lostfactor of 1.23 determined from thesereported communities was used forhunts in Baffin Island Central, GriseFiord, and Baffin Island South (Wattand Hall5). For hunts in Upernavik afactor of 1.15 is used, and for hunts inEtah, Qaanaaq, Ummannaq, and Disko Bay a factor of 1.30 was applied(Garde et al., 2019). The catch data isdivided by season to reflect the seasonal availability quantified in the allocation matrix.Seasonal dates were defined basedon narwhal movements in and out ofthe summering region for Canada andGreenland. For Greenland, spring wasdefined as 1 April–9 August, summeras 10 August–22 September, fall as 12September–31 October, and winter as1 November–31 March. For the Canadian catch data, spring was definedfrom 1 April–23 July, summer as 24July–24 August, fall as 25 August–30November, and winter as 1 December–31 March.AbundanceThe most recent abundance estimatefor each stock from aerial surveys thatMarine Fisheries Review
have accounted for perception andavailability bias is presented in Table 6(Heide-Jørgensen et al., 2010; DoniolValcroze et al.4; Hansen et al.6).Proportional Availabilityand Allocation MatricesThere are eight columns in the proportional availability and allocationmatrices for narwhals that representthe individual summer stocks (Fig. 1).Twenty-four rows represent the hunting grounds (Fig. 2) divided by seasonwhere applicable; thus, for each stockand hunt there is a cell in the matrix.The value in each cell of the availability matrix was determined based onsatellite telemetry data for narwhalscollected over the last 25 years byboth Canada and Greenland and expertopinion and local knowledge about theconnection among stocks and huntingregions based on the designations 1–5defined in Table 1.A fixed version of the availability matrix defines “2. Probable zero”and “4. Probable hunt” as 0 and 1, respectively (Table 2). When applied tothe abundance estimates, this yields afixed version of the allocation matrix(Table 3). Catches are applied to thecorresponding allocation proportionsfor each site, then summed for eachstock to yield total removals. However, when uncertainty is considered,each cell contains a probability distribution, and a stochastic version ofthe proportional availability matrix fornarwhals is produced (Table 7). Theresulting distributions in the allocationmatrix include uncertainty i
applied to narwhal stocks to demon-strate the utility of the model and its ability to inform conservation and management goals for this marine mammal. Model Development. The stock allocation model assumes that in a region with a hunt from a mix-ture of stocks, th