Transcription
PAPERwww.rsc.org/softmatter Soft MatterElectrostatically tuned rate of peptide self-assembly resolved by multipleparticle tracking{{Thierry Savin and Patrick S. Doyle*Received 11th January 2007, Accepted 24th May 2007First published as an Advance Article on the web 24th July 2007DOI: 10.1039/b700434fHydrogels formed from the self-assembly of oligopeptides are being extensively studied forbiomedical applications. The kinetics of their gelation, as well as a quantitative description of theforces controlling the rate of assembly has not yet been addressed. We report here the use ofmultiple particle tracking to measure the self-assembly kinetics of the model peptide FKFEFKFE(KFE8). KFE8 forms well-defined b-sheet intermediates and is often used as a model peptidesystem that forms a fibrous network in aqueous solvent. We find that increasing the pH of thissystem from 3.5 to 4.0 decreases the time of KFE8 gelation by almost hundredfold, from hours tominutes. A remarkable self-similarity between measurements performed at different pH suggeststhat, although accelerated by the pH increase, gelation follows an invariable mechanism. Wepropose a semi-quantitative interpretation for the order of magnitudes of gelation time using asimple model for the interaction driving the self-assembly in terms of the Derjaguin–Landau–Verwey–Overbeek (DLVO) theory. Such understanding is important for the development ofcurrent and future therapeutic applications (e.g. drug delivery).1 IntroductionNew synthetic biological materials formed by the self-assemblyof designed peptides have shown considerable potential forbiomedical applications. Notably, successful functional tissuerecovery was recently observed by locally injecting solutions ofthese peptides into brain and heart lesions.1,2 In these studies,the authors used ionic self-complementary oligopeptides thatform b-sheet structures through a hierarchical self-assembly,ultimately resulting in a fibrous network.3–6 The latter thenserved as a scaffold allowing cells’ re-growth.7,8 A fundamentalproperty of these materials for biomedical applications is therapid sol–gel mechanical transition they undergo whenimmersed in physiological conditions.The peptide called KFE8 (two repeats of the sequenceFKFE, see the molecular structure given in Fig. S1 of theESI{), is one of the simplest self-assembling peptides thatforms fibrous matrices. Consequently this design, orvery similar ones, has been extensively studied as a modelsystem.4–6,9–12 KFE8 self-assembles into a helical bilayer ofb-sheet intermediates, with hydrophobic side chains betweenthe two layers5,6 (see Fig. S1 in the ESI{ for an illustration ofthis molecular arrangement). Additionally, these fibers sharemany features with the amyloid fibrils found in proteinconformational diseases, and are thus also used as modelsystems to study the formation of amyloids.12Massachusetts Institute of Technology, Department of ChemicalEngineering, 77 Massachusetts Avenue, Room 66-270, Cambridge,Massachusetts, 02139, USA. E-mail: pdoyle@mit.edu.;Fax: 1 617-258-5042; Tel: 1 617-253-4534{ Electronic supplementary information (ESI) available: molecularmodel of peptide, peptide solution titration, peptide interaction in thecrossed cylinders geometry. See DOI: 10.1039/b700434f{ MPT, multiple particle tracking; MSD, mean-squared displacement;TFA, trifluoroacetic acid1194 Soft Matter, 2007, 3, 1194–1202We asked ourselves what drives the self-assembly of themodel system KFE8, and how fast it occurs. The mechanismby which these peptides coalesce to form a network is notclearly understood, but it is known that self-assembly issensitive to the pH and the ionic strength of the solution, dueto the ionizable side chains. Caplan et al.4,10,11 tentativelyexplained this dependence in terms of the Derjaguin–Landau–Verwey–Overbeek (DLVO) theory. They hypothesized thatself-assembly of KFE12 (three repeats of FKFE) is promotedby the hydrophobic effect,13 but hindered by electrostaticrepulsion of the charge-like faces of the molecule. When themolecule carries zero net charge, or when the charges arescreened, self-assembly of fibers occurs extremely rapidly(seconds or less). On the other hand when the molecules arecharged, self-assembly is slower (few hours or more). Howeverthe studies by Caplan et al. related the effect of relievingelectrostatic peptide repulsion only to the late equilibrium stateof the formed gel, through a binary sol–gel rheologicalassessment. Other studies were focused on early timeintermediate structures’ formation.5,6,12 In particular, molecular dynamics simulations have shown that the hydrophobiccontacts precede the growth of backbone hydrogen bonds.12The kinetics of the network formation can be partly resolvedusing circular dichroism (CD) spectroscopy.5 These measurements reported a steady increase in b-sheet structures and aconcurrent decrease in the presence of coils. However, theknowledge of how these fibers interact and contributeprogressively to the formation of a solid network cannot beassessed with CD spectroscopy. Here we use multiple particletracking (MPT) microrheology to follow the hydrogel formation of the KFE8 self-assembling peptide.14 Intermediate statesof the evolving system most likely contain fragile structures,that will either be disrupted by bulk rheometry, or have arheological signature below the detection limit of a standardThis journal is ß The Royal Society of Chemistry 2007
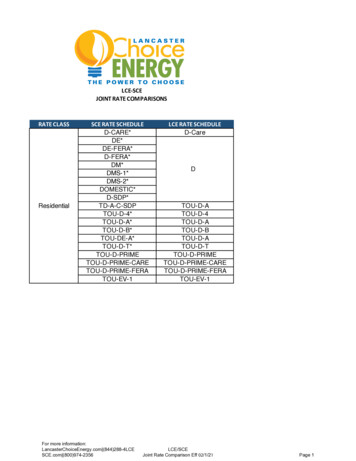
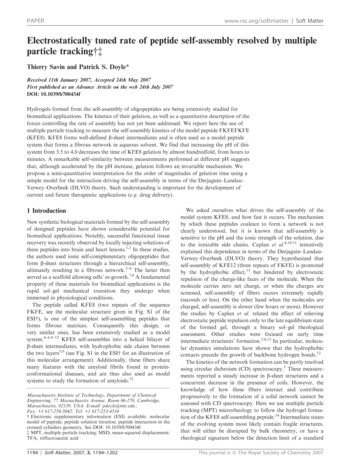
rheometer. In this regard, microrheometry is well suited toreport accurate measurements on weak forming gels, withoutbreaking their structural components.15,16 Another advantageof MPT microrheology is that measurements are fast(yminutes or less) and that the state of the sample, containedin a closed chamber, is not effected by external factors (e.g.evaporation). This characteristic is in dramatic contrast withbulk rheology, where measurements are usually longer, andelaborate sample preparation techniques are needed tocircumvent evaporation.4 In this study, MPT allows us toshow in particular that although the KFE8 self-assembly rateis dramatically tuned from hours to minutes by the variation ofpeptide net charge at different pH, the mechanism of gelationremains unchanged.2 Results2.1 Monitoring the kinetics of self-assemblyThe lyophilized powder of peptide KFE8 was mixed indeionized filtered water to a concentration of 0.1 wt% (1 mgml21), and microspheres were added to the solution. Due toresidual trifluoroacetic acid (TFA) from peptide synthesis, thepH of the solution was y3.3. We adjusted the pH by addingNaOH into the solution to reach a concentration [NaOH]0 thatwe chose from a titration of the peptide-powder solution (seethe titration curve, Fig. S2 in the ESI{). We then performed atime series of MPT measurements as the self-assembly wasoccurring in the observed sample of KFE8 solution. For eachtime point during the gelation, we calculated the onedimensional ensemble averaged mean-squared displacement(MSD) SDx2(t)T as a function of the lag time t to quantify thedynamics of the embedded Brownian probes. We report theresults of this computation in Fig. 1A corresponding to aminecoated beads of 1 mm diameter, in a solution of 0.1 wt% KFE8crude powder at pH 3.5 ([NaOH]0 0.65 mM). The times ofgelation explored range from 3 min to 5 days. At the beginningof the gelation, when no gel network has been formed in thesample, the dynamics of the particles are the ones obtained in apurely viscous fluid (SDx2(t)T 3 t, as indicated by the dashdotted line in Fig. 1A). This initial viscosity can be evaluatedfrom the slope of SDx2(t)T 2Dt using the expression of theself-diffusion coefficient D kBT/(6pag), where kB is theBoltzmann’s constant, T the absolute temperature (T 23 uCin all our experiments), g the viscosity of the fluid and a theparticle radius. We find g 2 mPa s, that is about twice theviscosity of water, at this early time of gelation. As the selfassembly occurs, the MSD continuously decreases since themotion of the probes is progressively more constrained by theformation of fibers in their surrounding. At long times ofgelation when the equilibrium state of the peptide system isreached (see further discussions later in the text), the MSD isalmost a constant plateau (SDx2(t)T SDx2p T independent oft) indicating that the fluid behaves as an elastic material at thefrequencies measured here, from 0.1 to 10 Hz. At this point,the elastic modulus G is evaluated using G 2kBT/(6paSDx2p T).We find G 1 Pa, indicating the presence of a weak gel withFig. 1 Ensemble averaged MSD SDx2(t)T of probes (1 mm diameter, amine-coated) embedded in the self-assembling KFE8 system, reported atdifferent times during gelation, from 3 min to 120 h. The concentration of peptide powder is 0.1 wt%, and the pH of the solution was set to 3.5. (A)The variation of SDx2(t)T versus t for different times of gelation tgel. The dash-dotted line indicates the scaling SDx2(t)T 3 t. (B) SDx2(ti)T at twolag times ti 0.1 (triangles) and 1 s (squares), versus tgel. The solid symbols are extracted from (A) (at values of t shown in (A) by the dashed lines).(C) The value of the local power-law a(ti) versus tgel at the same two lag times than (B), ti 0.1 (diamonds) and 1 s (circles). The solid lines in (C)indicate the limiting values 0 and 1 for a(t). In (B) and (C), the open symbols are a reproducibility check.This journal is ß The Royal Society of Chemistry 2007Soft Matter, 2007, 3, 1194–1202 1195
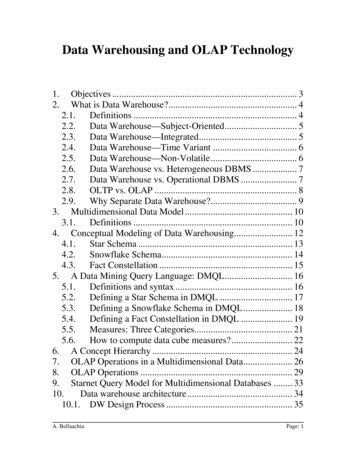
the same elasticity to that found using bulk rheology on asimilar system at comparable concentration.17To follow the kinetics, it is convenient to represent theevolution of the MSD, evaluated at a given lag time, with theself-assembly progression.18 In Fig. 1B we plot the quantitySDx2(ti)T, calculated at two lag times t1 0.1 s and t2 1 s, asa function of the time of gelation tgel. Also, in Fig. 1C we showthe variation of the local power-law a(ti) calculated at the sametwo lag times as a function of tgel. The local power-law, ordiffusive exponent, is defined by: d logSDx2 ðtÞT:(1)aðtÞ dðlogtÞWe observe on these plots that both the MSD SDx2(ti)T andthe diffusive exponent a(ti) remain constant for gelation timesgreater than 1000 min, suggesting that the system has reachedan equilibrium state. This time scale is consistent with thecharacteristic kinetics of structure formation apparent on theAFM micrographs measured by Marini et al.5 These latterexperiments were performed at a lower pH (y3.3), meaningthat the gel-formation kinetics are expected to be slower (seesection 2.3). However, we can presume from the figures in ref. 5that the gel has reached an equilibrium state at a time between2 and 30 h.Also, we observe on the curves presented in Fig. 1C that thelocal power-law values are independent of the lag time at whichthey are calculated, for any point in time during gelation. Bylooking at the MSD in Fig. 1A, we notice indeed that for all tgel,SDx2(t)T exhibits a pure power-law dependence with t overalmost the entire range of accessible lag times. As noticedearlier, this power-law varies from 1 at the beginning of the selfassembly, indicating a purely viscous behavior, and reachesalmost 0 at the equilibrium state of the gel, characteristic of apurely elastic behavior on the accessible range of frequencies.We have validated our experimental protocol by reproducingthese kinetics data under identical conditions in a separateexperiment (c.f. open symbols in Fig. 1B and 1C). We observegood reproducibility, in terms of both the amplitude of SDx2(t)Tand a(t) at various lag times, and also in their evolution with tgel.However, we note that the last point of SDx2(t)T at tgel 1500 min, characterizing the equilibrium state, differs by about40% between the two experiments, indicating the sensitivity ofthis final state of the system to small variations, beyond control,in the experimental conditions.itself positively charged (see inset of Fig. 5 and later in thetext), we evaluate here the influence of a possible interactionbetween the bead and the peptide. Moreover, this comparisonis performed with similar particle sizes, so we truly isolate theeffect of surface chemistry. We present in Fig. 2 the kineticsresults at the lag time t2 1 s using these two different surfacechemistries. Note that the MSD values reported in Fig. 2A arescaled by the probe radius a. We observe in this plot that theMSD of the carboxylated particles (negatively charged) is, ingeneral, smaller than the one exhibited by the amine-coatedparticles (positively charged). This trend is consistent withother microrheological studies comparing the response ofprobes strongly and weakly attracted to their surroundingnetwork.19 We can hypothesize for example that the carboxylated beads are attached to the fibers through electrostaticattraction, connecting meshes and limiting locally the networkfluctuations and hence their own motion. We used 1 mmdiameter amine-modified probes in section 2.3 to eventuallylimit these sorts of weak interactions with peptide2.2 Probes’ surface chemistry and sizeIdeally, the measurement technique should not interfere withthe self-assembly mechanism of gelation. Here, the probeparticles could exhibit unwanted interaction with the assemblyprocess. To characterize the effect of surface chemistry and sizeof the probe particles, we performed the experiment describedabove with another surface coating of the probes and adifferent size. First, we applied MPT on 0.925 mm diametercarboxylate-modified probes in a solution of KFE8 powder ata concentration of 0.1 wt% with pH set at 3.5 (same as in theprevious section). At this pH, carboxylate-modified probes arenegatively charged whereas the amine-modified particles arepositively charged. The peptide in solution at this pH being1196 Soft Matter, 2007, 3, 1194–1202Fig. 2 Scaled MSD a 6 SDx2(t)T and local power-law a(t) forparticles of different surface chemistries and sizes, embedded in theself-assembling KFE8 system as a function of self-assembly time tgel.The concentration of powder is 0.1 wt%, and the pH of the solutionwas set to 3.5. The lag time is t 1 s. (A) The filled squares correspondto 1 mm diameter amine-coated probes, the open squares are for0.925 mm diameter carboxylate-modified probes, and the triangles arefor 0.518 mm diameter carboxylate-modified particles. (B) The filledcircles are for 1 mm diameter amine-coated probes, whereas the opensymbols are for 0.925 mm (circles) 0.518 mm (diamonds) diametercarboxylate-modified probes. The solid black lines in (B) indicates thelimiting values 0 and 1 for a(t).This journal is ß The Royal Society of Chemistry 2007
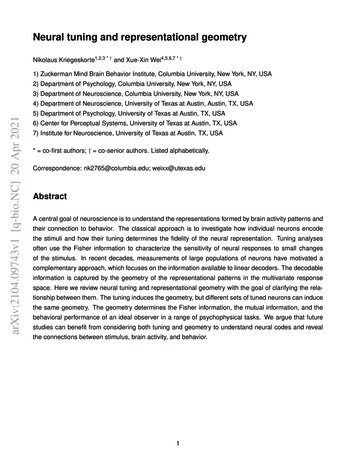
self-assembly. At the beginning of self-assembly, however, thescaled values are identical in the absence of a formed network.The amplitude of the difference between the MSDs obtained atlong gelation times with these two chemistries is neverthelesssmall (the equilibrium values for SDx2(1 s)T with carboxylatemodified probes are about 50% lower than with amine-coatedprobes, a discrepancy comparable to the one obtained in thereproducibility test mentioned previously), and the localpower-law as shown in Fig. 2B are almost identical at alltimes of gelation.We next performed a kinetics study using 0.518 mm diametercarboxylate-modified probes, and the results are also presentedin Fig. 2. We observe that the scaled MSDs for these smallerbeads, as well as the local power-law they exhibit, arecollapsing onto the data for the bigger beads with the samecarboxylate surface chemistry. The independence of thequantity a 6 SDx2(t)T with the probe radius suggests thatthe particles are probing a continuum environment at thelengths scale of their diameter (at least for a . 0.5 mm). Notethat this is consistent with estimates of the averaged mesh sizeof a KFE8 system at similar concentration, calculated fromAFM micrographs or electron micrographs of similar systemsat comparable concentrations.7 Also the aforementionedsimilitude in the dynamics of probes bound and non-boundto the fiber matrix corroborates the idea of a continuousnetwork at the length scale of the probe.These findings suggest that bulk rheometry can be extractedfrom the ensemble-averaged MSD using the generalizedStokes–Einstein relation.20 We show in Fig. 3 the resultingrheological data obtained from the MSD. The storage and lossmodulus, respectively G9(v) and G0(v), were calculated at thefrequency v using G*(v) G9(v) iG0(v) with:G ðvÞ&kB Texp½ipað1 vÞ 2 3pa SDx2 ð1 vÞTC ½1zað1 vÞ (2)where C is the gamma function, as described in ref. 21 and 22.We observe the qualitative behavior described in the previousFig. 3 Evolution of the storage modulus G9(v) (solid squares) and ofthe loss modulus G0(v) (open circles) as a function of the self-assemblytime for a KFE8 powder solution with concentration of 0.1 wt% and apH of 3.5. The values G9(v) and G0(v) were calculated from theensemble averaged MSD of 1 mm diameter amine-modified particles ata frequency v 1 Hz. Changing the size and/or the surface chemistryof the probe particles does not significantly affect these results.This journal is ß The Royal Society of Chemistry 2007section, that is the material is almost purely viscous at thebeginning of the self-assembly, and its storage modulusprogressively increases to become larger than the loss modulus,meaning that the material is essentially elastic at long times. Attime tgel . 1000 min, the gel’s rheological properties remainsteady.2.3 Characteristic time of self-assemblyIn order to quantify the influence of the pH on the kinetics ofgelation, we must define a characteristic time of self-assemblythat we can evaluate from the MPT measurements. The criticalgel point t0gel of the sol–gel transition of a gelling system is the firstinstant at which the connectivity of the network extends over theentire sample. At the time t0gel , the longest relaxation time of thecritical gel diverges and a power-law behavior is observed forboth G9(v) 3 va0 and G0(v) 3 va0 over a wide range offrequencies.23 This power-law dependency is presumably relatedto the fractal scaling properties of the network clusters.24In our study we have access to a frequency range spanning twodecades, 0.1 Hz , v , 10 Hz, with good statistical accuracy (seeFig. 1A). Over this range we observe that the MSD exhibits apower-law behavior SDx2(t)T 3 ta at all times of gelation.Application of the generalized Stokes–Einstein relation showsthat in this case, both G9(v) 3 va and G0(v) 3 va over thecorresponding range of frequencies. It is likely however that thesystem exhibits some relaxation dynamics whose characteristictimes lie outside this range, at a certain time of self-assemblybefore and after the gel point. However, given the frequencywindow available here, the gel point cannot be determined usingsolely the power-law criteria mentioned above. Nevertheless wecan postulate a characteristic value for a0 to determine thecritical gel time. Using dynamic scaling based on percolationtheory with the Rouse limit of hydrodynamic interactions, onesfind 0.5 , a0 , 0.66.25–27 The latter Rouse dynamics model witha0 0.5 has been successful in describing rheology near the gelpoint.25,28 Such criteria allows the definition of the gel point (t0gel ,G90 G00 ) which in that case corresponds to the gelation time atwhich the curves for G9 and G0 cross each other, as seen in Fig. 3.In Fig. 4 we present the results for the gel-point time as afunction of the pH for a KFE8 powder solution with aconcentration of 0.1 wt%. We performed these MPT measurements using 1 mm diameter amine-coated probes, and with aconcentration of [NaOH]0 between 0.65 and 1 mM. The valuesof t0gel for each pH reported in Fig. 4B were extracted from theevolution of the local power-law a with the gelation time (aspresented in Fig. 4A) by using the criteria a a0 0.5 to definethe gel point. We observe that the self-assembly is faster as thepH increases. For an elevation of pH from 3.5 to 4, the gel timeis decreased by almost two orders of magnitude, from y70 minto y1 min. The amplitude of this variation is fairlyindependent of the choice of a0 for the gel-point criteria inthe viscoelastic region 0.2 , a0 , 0.8, meaning that anotherchoice of a0 in this range would lead to values of t0gel scaled bythe same constant factor for all values of pH as compared tothe one in Fig. 4B.We also report in Fig. 4B the evolution of the characteristicelastic modulus G90 G00 at the gel point characterized by thecrossover between the elastic and viscous behavior. WeSoft Matter, 2007, 3, 1194–1202 1197
Fig. 4 Gelation kinetics of KFE8 powder solution with concentration 0.1 wt% as a function of the pH. (A) The local power-law of the MSD at alag time t 1 s, plotted as a function of the gelation time tgel for pH 3.5, 3.65, 3.75, 3.85 and 4 (see legend on the figure). The critical gel point t0gelis uniquely obtained at a a0 0.5, as represented by the dashed line. (B) The resulting t0gel (squares) and G90 G00 (circles) as a function of the pH.The range of modulus reported here (1024 to 1 Pa) is the same as the range displayed in Fig. 3. The dashed lines are WpH versus pH for the threevalues of s indicated (see section 3.2.3, the prefactor is arbitrary chosen to fall in the range shown here). (C) The same results as presented in (A) (thesame symbols are used to distinguish the pH), but the gelation time tgel has been scaled by the gel-point time t0gel obtained at the corresponding pHfor each curve. (D) The value of the MSD as a function of the gelation time scaled the same way as in (C). The inset in (D) shows the evolution ofthe local power-law versus the magnitude of the MSD. All the quantities presented here are evaluated at t 1 s and v 1 Hz.observe that even though the kinetics are dramatically changedby the increase of pH, the mechanical properties are notsignificantly affected by the pH at the gel point. Thisobservation suggests that in this range of pH the selfassembling peptide, as probed by particle tracking at the gelpoint, passes through an identical mechanical state independent of the pH. We can extend this observation by presentingthe kinetics measurements scaled by the characteristic gel timet0gel extracted from Fig. 4A. In Fig. 4C and 4D we present theevolution of a(1 s) and SDx2(1 s)T, respectively, as a functionof tgel/t0gel for each value of pH. We observe a remarkableoverlap of these curves. The scatter of the points at lategelation time, tgel/t0gel . 10 is within the reproducibility controlpresented in Fig. 1 for the equilibrium state. This self-similaritystrongly suggests that the increase of the pH from 3.5 to 4.0does not affect the mechanism by which peptides self-assemble,but merely increases the rate. This observation will be the basisof the gelation model presented in the next section. The inset ofFig. 4D summarizes this self-similarity in the observableparameter space (a,SDx2T) at a lag time t 1 s, but the sameresult holds for other lag times investigated in this study (datanot shown).1198 Soft Matter, 2007, 3, 1194–12023 DiscussionIn this section, we propose interpretations of the trendsobserved experimentally by using simplified and semi-quantitative models, that nevertheless capture the expected physics ofthe phenomena. Simplifications in these models allow us toreduce the range of adjustable parameters to solely geometricconsiderations. First, we question if the initial viscosity of thepeptide solution can be explained by the presence of the earlynon-connected structures that were directly observed inprevious studies.5 Second, we suggest a model of theinteraction driving the self-assembly that accounts for theobserved characteristic gelation times.3.1 Peptides’ structure at early stateWe measured the viscosity of the peptide KFE8 solution at thebeginning of gelation for a pH of 3.5, and we found it to betwice the viscosity of the aqueous solvent in which the peptidepowder is mixed. From the direct observations of peptides’early state structure,5,29 we assume that, at short gelation times(tgel), the KFE8 mixture is a monodisperse solution of peptideribbons that we model as cylinders with radius R 3.5 nm (seeThis journal is ß The Royal Society of Chemistry 2007
Fig. S1 in the ESI{) and length L that can be related to n, thenumber of peptide molecules per ribbon segment. One turn ofthe helix contains about 100 KFE8 molecules and is about20 nm long,6 and so L n 6 0.2 nm. We use n n21 6 4 61023 m23 for the number density of rods in solution (asobtained with 80% purity of a 0.1 wt% KFE8 powder dissolvedin the solvent, see the titration model presented in the ESI{).The transition from a dilute to a semi-dilute regime for adispersion of such cylinders occurs when n is greater than n* L23. In our case, we calculate that this transition occurs whenfibers are longer than L* # 100 nm, which is the typical size ofinitial ribbons reported in ref. 5. This indicates that thedispersion is expected to be between the dilute and semi-diluteregime. The zero-shear rate viscosity of a dispersion ofBrownian rods in this intermediate regime can be written interms of the rotational diffusion coefficient Dr of the rods:30g&g0 zvkB TvkB Tz30Dr,0 10Dr(3)where g and g0 are the dispersion and solvent viscositiesrespectively, and Dr,0 is the limit of Dr at infinite dilution (inthis limit, the above expression becomes g # g0 2nkBT/(15Dr,0) for the dilute regime). An accurate expression of therotational friction coefficient fr kBT/Dr,0 for long cylinderscan be found in ref. 31 and 32:fr kB T pg0 L3xz0:64 1:659z 2f ðlnlÞ with f ðxÞ Dr,0x{1:5x3lnl(4)where l L/R is the aspect ratio of the cylinder. An expressionfor Dr,0 can be calculated from the above equation. Using atube model, Doi and Edwards estimated Dr bDr,0(nL3)22,where b is a numerical constant equal to about 1000.30Combining the above equations, we finally obtain the intrinsicviscosity of the dispersion:½g g{g0 l2 f ðlnlÞ l6 f ðlnlÞ 2w&zwg090lnl30p2 blnl(5)in terms of the volume fraction w pR2Ln 0.3%. Solving eqn(5) for L with (g 2 g0)/g0 1, we find L # 500 nm,corresponding to earlier ribbons of about 25 helical turns long.Note that we can count about 10 helical turns per precursorribbon on the AFM micrograph obtained in ref. 5 with thesame concentration of peptide powder, after 8 min of selfassembly (although the peptide-powder mixing protocol wassignificantly shorter), and at a pH # 3.3. With this value of Lwe calculate n/n* # 30, which usually indicates the transitionfrom dilute to semi-dilute behavior,32 thus confirming the useof eqn (3). The model above neglects the contribution of theelectrostatic repulsion between the charged rods. However inthe semi-dilute regime, this interaction merely results inincreasing L, the characteristic size of the excluded volumeeffect, to an effective length of rods that incorporates the rangeof the electrostatic repulsion, L k21 (where k21 is the Debyelength, see next section).33 This range of k21 # 10 nm, asevaluated later in the text, is much smaller than the physicallength L # 500 nm. Thus the effect of charges on eqn (5) canbe neglected. Moreover for such high aspect ratio objects (hereThis journal is ß The Royal Society of Chemistry 2007l # 150), the drag coefficient is weakly dependent on the finegeometry of the body,31 thus allowing us to model the helicalfibers (whose pitch is 20 nm, much smaller than L) by simplecylinders.3.2 Self-assembly rate tuned by electrostatic double layerinteractionsWe must assume a geometric scenario for the elementarycoalescence of initial peptide structures in order to model theinteraction driving the self-assembly of KFE8. In a simplifiedmodel, we assume that the b-sheet formed by the peptides is asemi-infinite block with a given surface s of interaction bywhich two identical blocks could eventually connect. Thisgeometry has already been used on the same system by Hwanget al.6 to develop their model of peptide-surface charge interms of the electrostatic double layer theory. We assume thatthe early short fibers are somewhat represented by these blocksof material. Though this choice might not be the mostadvanced, the resulting theory remains, however, fairly simple,and allows us to calculate reasonable orders of magnitude forthe interaction. An alternate scenario for the geometry of theinteraction is investigated in the ESI{.3.2.1 Modeling the peptide charge. In the electrostatic doublelayer model, the charged blocks are bathed in a solution ofions. To calculate the total surface-charge density s and theelectrostatic potential ys at the surface of the blocks, Hwanget al.6 used the local chemical equilibrium condition of theb-sheet in the solution.13 They found: s maxs {10pH{pKEe{y s z10pH{pKE ze{yse{y s z10pH{pKK(6) es ðekkB T Þ is the scaled surface-charge density, andwhere s ey ðkB T Þ is the scaled potential at the block’s surface. Inyssour notations, e is the elementary electric charge and e ere0 wither and e0 being the dielectric constant of water (y80) and thepermittivity of vacuum, respectively. The �ffiffiffiparameter, written k 2e2 ce{1 ðkB T Þ, is a function of theion concentration c [OH2] [T2] that itself depends on the pHthrough c 10pH214 [T]0(1 10pKT2pH)21, where [T]0 and pKT 0.52 are the initial concentration and dissociation pK value ofTFA, respectively. Also in eqn (6), pKE 4.3 and pKK 10.8 arethe dissociation pK constants of the glutamic acid EH and of theLysine KH , respectively (since the model presented here is local,these surface dissociation pK constants are the standard values ofthe isolated amino acids34,35). The quantity smax 0.26 C m22 isthe maximum possible surface charge of the block, as calculatedfrom the dimensions of the KFE8 molecule: two positive groupson an area 3.1 6 0.4 nm2 exposed to the bulk (se
Electrostatically tuned rate of peptide self-assembly resolved by multiple particle tracking{ . KFE8 forms well-defined b-sheet intermediates and is often used as a model peptide . these peptides into