Transcription
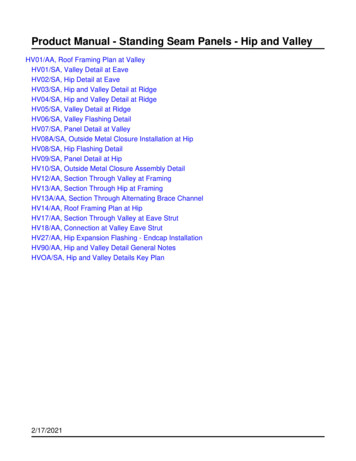
San Fernando Valleyindicators2000BURBANK CALABASAS GLENDALE LOS ANGELES SAN FERNANDO 10SFV Indicators 2000 Rev 8.indd108/19/00, 3:59 PM
Economic Allianceof the San Fernando Valleyboard of directors2000-2001EXECUTIVE BOARD OF DIRECTORSBOARD OF DIRECTORSChairman David W. FlemingExecutive Vice Chair Robert L. ScottVice Chair Cathy MaguireTreasurer Thomas R. SouléPresident and CEO Bruce D. AckermanEx Officio (No Term) Bruce Ackerman CCE,President and CEO, Economic AllianceRepresentativesUnited Chambers of Commerce: J. Richard Leyner,Tom Soulé, Gerald CurryValley Industry and Commerce Association: CathyMaguire, Walter Mosher, Robert L. ScottSmall Manufacturers Association of California:David GoodreauSan Fernando Valley Conference and VisitorsBureau: Justin AldrichValley Economic Development Center: WayneAdelstein, Marvin SelterValley International Trade Association: MartinGopeltSouthland Regional Association of Realtors: MillieJonesValley Leadership Institute: Barbara PerkinsEducational Community: Tyree Wieder, RockyYoungBurbank: Robert Ovrom (City Manager)Calabasas: Lesley Devine (Councilmember)Glendale: Sheldon Baker (Councilmember)Los Angeles: William Violante (Deputy Mayor)San Fernando: Silverio Robledo (Mayor Pro Tem)At Large Members:David W. FlemingWilliam C. AllenLeRoy ChaseIke MasseyGary ThomasTERM ENDING NOVEMBER 2001Justin Aldrich, Autry Museum of Western HeritageHarlan Barbanell Ph.D., LAUSDJane Boeckmann, Valley MagazineRev. Zedar Broadus, NAACPNate Brogin, The Brogin CompaniesWendy Brogin, The Brogin CompaniesBarry Cohn, Imperial BankGary Forsch, Roscoe HardwareDavid Goodreau, Small Manufacturers AssociationLee K. Harrington, LAEDCHorace Heidt, Horace Heidt ProductionsEx Officio Members:Bruce AckermanDebbie AdelsbergRoberto BarraganBonny HermanDavid IwataDebra Sakacs2TERM ENDING NOVEMBER 2000Wayne Adelstein, Valley Business JournalLee Kanon Alpert, Alpert & BarrWilliam C. AllenRobert Arias, One to OneBert Boeckmann, Galpin MotorsWilliam Borellis, ConsultantJeff Brain, Valley VotePriscilla Brehm, Morton Capital ManagementLeRoy Chase, Boys and Girls ClubsGerald E. Curry, Law Offices of Gerald E. CurryLesley Devine, City of CalabasasJames Dunn, Airtel Plaza HotelVictor J. Gill, Burbank Glendale Pasadena AirportCecilia Glassman, ConsultantMartin Gopelt, Comerica BankRichard Hardman, Northridge Chamber of CommerceMarie Harris, RetiredJanel Huff, California Trade and CommerceJeff Krivis, First Mediation Corp.Nancy LaSota, RetiredJoe Lucente, Fenton Avenue Charter SchoolDale Ma, AAA Fast FoodsRafi Manoukian, City of GlendaleJames G. Morris, Morris & Assoc.Walter Mosher Ph.D., Precision DynamicsRobert Bud Ovrom, City of BurbankGloria Pollack, Time Warner CommunicationsWilliam Blinky Rodriguez, CISCarol Rowen, Los Angeles Board of HarborCommissionersJeffrey A. Schwartz, Autoweb.comRoger Seaver, Northridge Hospital Medical CenterMarvin Selter, CMS Inc.Irwin Silon, RetiredRobert M. Tague, City of BurbankGary M. Thomas, The Aaron GroupMatthew A. Toledo, Los Angeles Business JournalAndrea M. Troutman, Los Angeles TimesFred Weinhart, Management Services UnlimitedBonny Herman, VICAHelen Hernandez, The Legacy Group InternationalIrma Horvath, Pacific BellWilliam Hosek Ph.D., CSUNMillie Jones, SRARMannon Kaplan CPA, Miller, Kaplan, Arase & Co.Gerald Katell, Katell PropertiesRichard Katz, Katz ConsultingSteven W. Lew, Universal StudiosCathy Maguire, The Gas Co.Ike Massey, Daily NewsJulian Montoya, Burrito KingSanford Paris, Paris Industrial ParksBob Patterson, City National BankBarbara Perkins, VLIBenjamin M. Reznik, Jeffer, Mangels, Butler &Marmaro LLPSilverio Robledo, City of San FernandoIrwin Rosenberg, Laidlaw Transit Inc.Mike Rueff, The Rueff Family FoundationDebra Sakacs, United Chambers Of CommerceCorine Sanchez, El Proyecto del BarrioRobert L. Scott, Scott & Assoc.Barry Sedlik, Southern California Edison Co.Phillip Flip Smith, Flip’s TiresLinda Smith, Union Bank of CaliforniaThomas R. Soulé CPA, Thomas R. Soulé CPAPauline Tallent, Tallent & Associates, RealtorsTom Teofilo, World Trade Center AssociationCandice Vorhies, VITAJulia C. Wilson, Los Angeles TimesTERM ENDING NOVEMBER 2002Sheldon Baker, City of GlendaleKenneth Banks, K.B. InsuranceKen Bernstein, LA ConservancyRoberto Barragan, VEDCDallas Boardman, Dallas Boardman & Assoc.Pam Corradi, The Pam Corradi CompanyDavid W. Fleming, Latham & WatkinsSondra Frohlich, Sherman Oaks Chamber of CommerceGus Garcia III, Rydell Automotive GroupSandy Miller Goldman, BFIRichard Goodrich, Bank of AmericaJoseph Gray, American Express Financial AdvisorsSusan Harris, Pacific BellDavid Honda, D.S. Honda ConstructionRoss Hopkins, Ross Hopkins & Assoc.Don Hudson, Warner Center PropertiesMike Jimerson, Boeing RocketdyneAndrew Kane, Arthur AndersonJ. Richard Leyner, Capital Commercial Real EstateMichael Mizrahi, The Gas Co.Ken W. Patton, Glendale CollegeGregory Posner, Kaiser PermanentWalter Prince, Executive Sweet ServicesDavid Rattray, Unite LARobert Rodine, The Polaris GroupNancy Schmidt, First Western BankJim Sherman, West Hills Hospital Medical CenterShirley Svorny Ph.D., CSUNArthur Sweet, A & E Development Co.C.K. Tseng, Northridge TravelBill Violante, City of Los AngelesFrancisco Uribe, GTETyree Wieder Ed.D., LA Valley CollegeRandy Witt, Randy Witt ProductionsKen Worthen, RetiredDarroch Rocky Young Ed.D., LA Pierce CollegeSan Fernando ValleySFV Indicators 2000 Rev 8.indd208/19/00, 3:59 PM
SAN FERNANDOVALLEYINDICATORS 2000COMMUNITY INDICATORS FOR THESAN FERNANDO VALLEY, CALIFORNIATopics in order of priority1.Education, Graduation & Test Scores2.Transportation & Commuting3.Employment & Jobs4.Crime & Public Safety5.Population & Density6.Housing Affordability7.Air Quality8.Water Quality & Availability9.Residential Real Estate Trends10. Commercial Real Estate Trends11. Health Care Availability & Disease12. Income Distribution / EquityScore10410189828277655957535247These scores are a numerical presentation of the relative importance that the community places on various issues. Participants assign a degree of importance, which isweighted and translated to develop an overall result. A higher score indicates greaterconcern. Additional source: San Fernando Valley Almanac 2000The residents and business community of the San Fernando Valley wish to thankTHE JAMES IRVINEFOUNDATIONfor their ongoing support of this project, and of community indictors projects and regionalinitiatives throughout the State of California. Copyright 2000, Economic Alliance of the San Fernando Valley and the Civic Center. All rights reserved.San Fernando Valley Indicators 2000 is a publication of the Economic Alliance of the San Fernando Valley,15205 Burbank Boulevard. Second Floor, Van Nuys, California 91411 (818) 782-7738 produced by Civic Center,23679 Calabasas Rd. #507 Calabasas, CA 91302 (818) 712-9500This San Fernando Valley Indicators 2000 publication is a workingdocument. It includes discussionand assessment of 12 importantCommunity Indicators for the geographic San Fernando Valley. Dialogue material has been derivedfrom numerous meetings andforums - including the Summit 2000held in February of 2000 at Universal City, California. A cross-section ofseveral hundred community leaderswere engaged for input on topicsand issues originally raised in thecourse of five smaller CommunityIndicator Forums.Community Indicators are basedupon shared values, and track theoverall “Quality of Life” in a givenregion.They also relate to the sustainability of that quality of life.The James Irvine Foundation sponsors this and other such projectsthroughout California, which lookbeyond traditional political boundaries in dealing with communityissues.Economic development and qualityof life concerns converge in theprocess of developing CommunityIndicators. In today’s business climate, employers are increasinglymore aware of the need for livablecommunities, quality resources, andaccess to amenities.Each Community Indicator tells astory about an important local issue.To be useful, indicators need to becredible, understandable and measurable. Most importantly, indicatorshave to be actionable based uponidentified controlling forces.Community Indicators 2000SFV Indicators 2000 Rev 8.indd3308/19/00, 3:59 PM
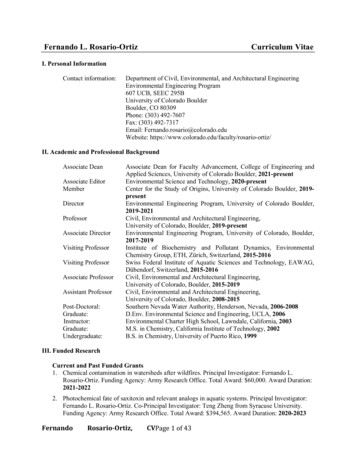
– Glendale showed 53% in 3rd and 53% in the11th – Las Virgenes reached 82% in 3rd and80% in the 11th. – LAUSD scored 27% in 3rdand 37% in the 11th – with the county-widetotals reaching 36% in 3rd and 41% in the 11th.Education,Graduation &Test ScoresCommunity OpinionsCommunity Issue Ranking: 1 of 12Score: 104Education is repeatedly identified as oneof the most important issues and oneof the greatest challenges to the area. Ahealthy economy, and broad-based prosperitydepend upon a competent and educated workforce. Generally test scores in the Las Virgenesschool district are higher than any of the surrounding jurisdictions. Shown on the charts arethe Limited English Proficiency test takers inyellow – the non-LEP group in burgundy –with the combined scores in blue. The chartdepicts the percent of test takers scoring atabove the 50th percentile – based upon thenational averageThere is consensus as to the pressing needfor higher education in the “New Economy.”Many believe that schools need to be governedon a local level to be responsive to the communities they serve – that school boards thatare too far-removed from schools tend to beself-serving – and tend to disenfranchise parents. The business community needs to becomemore involved. Some suggest that teachers havetoo many protections and privileges, and notenough incentives to excel. Teachers’ unionsare seen as not acting in the best interests ofstudents and communities much of the time.Generally, the Los Angeles Unified School District is seen as too large, poorly managed, unaccountable and out of control.Poverty was also cited as a major cause foreducational challenges. Most agree that low testscores are a result of low literacy rates in poorerneighborhoods, and within immigrant populations. Further problems are created when poorperformance is compounded by high dropoutrates. There are great disparities in home studyenvironments; with some having computers andInternet access, and others unable to even finda quiet place to study. There are some fearsIn the third grade, combined reading scoresin Burbank Unified hovered just under 50%– trailed by Glendale Unified at 45%. LasVirgenes was well above the national averageat 81%, with Los AngelesUnified 10 points below3rd Grade Reading Stanford 9 1999the county-wide averageof 21%.Math scores in the thirdand eleventh grade werea slightly different story.Burbank scored 57% in3rd grade and 54% in the11th – Glendale scored58% in 3rd and 54% inthe 11th – Las Virgenesscored 85% in 3rd and79% in the 11th – withLAUSD reaching 32% in3rd and 37% in the 11th.County-wide scores were48% in 3rd and 40% inthe 11th.Motivation is cited as a key to involvement andperformance. Students don’t always perceivethe benefits of education, particularly thosewith no well-educated role models. Under-educated parents often lack information or are apathetic toward learning. Some believe that thereis a lack of commitment by educators to seteducational standards – as opposed to beingprimarily driven by social goals. Resourceshortages are often given as a major cause forsubstandard performance.Overall, there is a concern that poor schoolsdrive families out of the San Fernando Valley –but also, that the media tends to exaggerate alot of the problems.Community RecommendationsSchools need to have meaningful objectivesand goals, and identify a clear mission.The implementation of the mission relies oninvolvement by educators, parents and businesses. Many believe governance should be ona local level – and there is a strong sentimentthat the Los Angeles Unified School Districtshould be reorganized into two or more smallerdistricts. Many urge the development of teacherand administrator incentives – with strongerguidelines and greater discipline.A need is seen for more flexibility in highereducation and for more emphasis in developingmarketable vocational and career skills. Business-education partnerships should be broadened, along with internships and job placementprograms. Economic development servicesshould be marketed at community colleges.90%By the eleventh grade,Burbank’s combinedreading scores weredown 9 points to 40%,Glendale’s scores weredown 10 points to 35%,with Las Virgenes dropping by 11 points to 70%.The LAUSD increasedfour points from 21% to25%, but was still wellbelow the county-wideaverage of 36%.that limited English proficiency, and relatedprograms, such as bilingual education, detractfrom the overall quality of general education.80%70%60%All50%NO LEP40%LEP30%20%Better public school teachers and more discipline are recommended. Priorities should bereviewed, and resources reprogrammed withadded compensation for teacher excellence.Some suggest that funds are adequate but areimproperly deployed – with others arguing theneed for greater teacher compensation as thecritical factor for educational .A.CountyStatewide11th Grade Reading Stanford 9 199980%70%60%50%All40%The rise in new-immigrant school population isseen as a great challenge. But, some suggestthat the current immigration surge is temporaryand will subside. Non-native second languageinstruction is seen as useful – with emphasis onlife skills.NO LEPLEPBetter Internet access is recommended, alongwith better equipment – especially at the community college level. Creative alternatives areurged, such as recycling of computers and otherassets from donor companies – since computersand the Internet are considered very importantto equalizing modern educational opportunities.Agents for Change30%Given the high immigrant population, it isunderstandable that language test scores showthe most consistentimprovement over time.Burbank scored 54% in3rd and 56% in the .A.CountyStatewideThose with the power and jurisdiction to makea difference include: local school boards, StateDepartment of Education, teachers associationsand unions, PTAs, students, parents, businessinterests who need quality workers, local residents, city officials, county officials, state officials, federal government, and the people of theSan Fernando Valley.San Fernando ValleySFV Indicators 2000 Rev 8.indd408/19/00, 3:59 PM
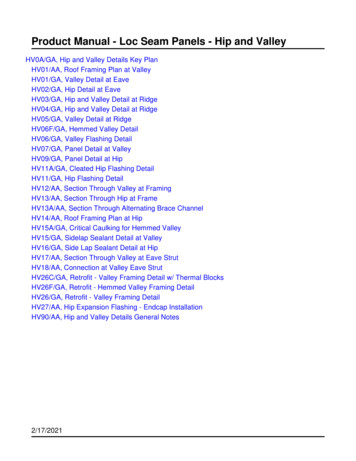
to pay for themselves and contribute to environmental mitigation.Local government has difficulty keeping upwith the challenge of maintaining the highwayinfrastructure.Transportation& CommutingIncentives should be offered to encourage flexible working hours. It is important to trendaway from the 9 to 5 workday and one-sitecommutes. Public transportation needs to bepromoted and the public educated in its use andbenefit.The promise of efficient mass public transitin the area has failed to materialize. What transit exists is not practical for regular use bythe average commuter. Its usefulness is almostentirely confined to the transit-dependent population – those entirely lacking in other options.Community Issue Ranking: 2 of 12Score: 101There is an absence of support or understandingof the public transit system. Given the decadesof promises, and lack of mass transit with practical use for Valley commuters, residents tendto be pessimistic.WResources are extremelylimited, and it has beendifficult trying to reachconsensus on either routesor technologies. Leadershave been criticized forfailing to provide thecommunity with a vision.And politics, perceived asanathema to the interestsof transit patrons, are seenas playing too big a role.Most believe that inefficiency is rampant at theMetropolitan Transportation Authority, as well as atCaltrans.Community OpinionsTransportation problems are primarily productsof poor planning, both in infrastructure andland use. This is compounded by significantpopulation growth and the overloading of anaging infrastructure. A massive freeway systemwas developed in Southern California betweenthe end of World War II and the 1960s.This replaced a fixed-rail public transportationsystem that once boasted over 1100 miles oftrack and routes.Because of the populations’s new-found mobility, between 1950 and 2000 Southern California’s development has tended to sprawl.Beginning in the 1960s, some areas ran outof vacant land and became “built-out.” Thisbegan the cycle of in-fill development, whichcontinues to make such areas more and moredense. This, in turn, increases traffic volumesand transportation demand.Fixed workday hours have tended to lead torush hour jams, with “rush hour” growing fromone to as many as four hours in both the morning and afternoon periods. Southern Californiais one of the most automobile-oriented societies in the world, with people believing “youare what you drive.” Cars are used for business, shopping, and for access to jobs, schools,and entertainment. Unlike other cities such asNew York and Chicago, which grew up aroundpublic transportation, Southern California grewup primarily in the post-war era of the freewayand the car. Attitudes toward public transportation range from indifferent to negative.AM Level of Service - Key Intersections100%Percentage of Sample nityRecommendationsFFC20%BCBB19951997AA0%1992Mass transportation needsto be given higher priority.Although many do notbelieve the situation can be100%resolved, activists still holdout hope that the area90%Fcan be competently served80%by a multi-modal systemof buses, light rail, sub70%ways and shuttles. AdeE60%quate parking would beessential to making use50%easy and convenient. Bus40%routes and timetables needto be effectively integrated30%Dinto rail systems.20%System lines need to go10%where people want or needCto go – with short0%1992headways and convenientschedules. Transit decisions should be based onreality, rather than theory. Some think thatlight rail is the only economically feasible solution for long distance lines. Although currentlynot under active consideration, freeway alignedmonorail systems historically have had greatsupport among voters in the area.It is felt that drivers need more incentives touse public transit. There should also be moreencouragement for the use of carpools. Busesneed to be cleaner in order to help attract ridership. Bus and carpool lanes should be a priority in the Sepulveda Pass portion of the SanDiego freeway, and eventually the CahuengaPass portion of the Hollywood Freeway.Highway and freeway systems need to beexpanded and extended, with better planningand design. Because of public resistance, manyhighways planned over the last 50 years havebeen shelved. More toll roads should be builtPercentage of Sample Groupith its ever-growing population, transportation has been identified as oneof the most challenging issues facingthe San Fernando Valley. Because most areasof the Valley are built-out, the practical optionsfor transit corridor upgrades and expansion arelimited. Residents tend to be resistant to suchprojects due to fears of major long-term disruptions, and the accompanying displacement ofexisting homes and businesses.The City of Los Angeles Department of Transportation is tracking the level of service in 17key intersections in the Valley using grades Athrough F.In 1997, morning traffic in the Valley was marginally improved from 1992 when about 90%of the sample group intersections were at LevelD or below. However, 1999 saw the worst conditions since 1993 in the sample group, with noA or B levels, and an increasing trend towardD and F levels.The P.M. statistics are even less encouragingwith 1999 showing about two-thirds ofthe intersections functioning at unsatisfactorylevels.Affordable housing should be clustered closerto the employment base, with ready accessto transportation. Zoning laws and communityplans should be revisited to accommodate newinfrastructure models. Older planning theories19931999PM Level of Service - Key uld be reconsidered based on today’s realities.It is argued that the Valley should be allowed tohave its own transit authority – that more fundsneed to be dedicated to transportation, andthat those responsible for expenditures need tobe held accountable. Residents are anxious tohave the Metropolitan Transportation Authority complete the Valley portion of the existingtransit plan.Agents for ChangeThose with the power and jurisdiction to makea difference include: Metropolitan Transportation Authority, county officials, city officials,state officials, Caltrans, federal officials, andthe voters. Some believe that the problemstems from nobody taking the lead and thatthose who have the jurisdiction and power donot use it well.Community Indicators 2000SFV Indicators 2000 Rev 8.indd5508/19/00, 3:59 PM
The Valley is host to an extraordinary numberof entrepreneurs and self-employed individuals.These people provide products and servicesthat strengthen the economy. Industries andemployees tend to cluster in areas where thereare labor, vendor and technology pools. Chiefamong Valley clusters are the high-tech andentertainment categories, which offer relativelyhigh-paying jobs.Employment& JobsCommunity Issue Ranking: 3 of 12Score: 99Community RecommendationsSufficient development opportunities are necesobs and employment are critical to thesary to retain and attract businesses. Small busivitality of any community. The Valley isnesses need to be encouraged, and allowed tocurrently following a national trend of lowgrow without unnecessary governmental interunemployment. Having lost a number of aeroference.space and scientific positions throughUnemploment Percentagethe decade - the area has been fortunatein that new jobs have developed toUnemploymentreplace them. Many of the new jobs are0.00 to 3.667.023.66 to 4.62high-quality positions in growth indus4.62 to 5.505.374.289.385.50 to 6.496.49 to 7.053.29tries such as technology and entertain7.05 to 7.905.345.514.847.90 to 209.06ment.Jseen as a useful forum for employers andemployees to meet.The school system has to be effective forresidents and employers. Business educationpartnerships need expanding to help developworkforce readiness. School to career businesseducation programs need to be expanded.The educational system needs to synchronizewith employers to develop job skills and careertracks for needs projected five to ten years inthe future.There is a sense that some governing jurisdictions are too large to develop local consensus –and that local bodies would better provide community empowerment and accountability.Left unchecked, suburban sprawl willcontinue to generate an ever-increasingdemand for jobs, for expanded infrastructure and for community amenities.Adequate political will and support isnecessary for development and for longterm redevelopment of communities.Percentage by Zip Code6.635.274.33The number of unemployed in theValley actually increased slightly, byabout 1500 from 1998 to 1999 butthe unemployment rate decreased dueto the overall increase in jobs and anincrease in the labor force.4.643.666.366.495.987.083.28 3.287.897.65.927.914.335.522.357.947.06 6.925.034.624.524.493.653.665.61 4.726.777.96 7.42 3.486.49 8.096.958.9 10.477.075.26.597.623.96Population in Labor Force - UnemployedSan Fernando Valley - Percentage of Labor ForceCommunity OpinionsEmployment Trends 1998-99The economy is always a major factorin employment. A sagging economygenerally results in high unemploymentrates. On a local basis, a favorable business climate, optimism, and communitydevelopment have had a major effect onemployment growth.1,000,000897,645S.F. Valley 386,128400,000300,000-Proper education and development of the workforce is critical to healthy employment matchups. Companies moving into the area orexpanding, want to know where their employees will come from.Colleges and public schools have a need toexcel, to provide job training and discipline,and to help develop solid work ethics.Quality of life is one of the most important elements for attracting good jobs and employees.Pop 16 in Labor Force Pop 16 in Labor ForceEmployedUnemployedPersons in LaborForcePop 16 Not in LaborForceIt would be useful to take a fresh lookat zoning and planning. Some urge discouraging apartment-type development,while others believe there is a need formore high-density, low-income housing.Most agree that improved transit willbenefit employees, giving access to abroader range of job options.Realizing that some sectors, such asaerospace, are in attrition for the foreseeable future, more efforts should be madeto attract or develop a broader groupof mid-pay to high-pay jobs. Resourcesshould be dedicated to specific areas ofstrength and synergy for the future – andnot trying to recapture lost industries andopportunities from the past.S.F. Valley 1998600,000As with other issues, immigration isseen as having a significant impact onemployment statistics. There are agreat number of new residents who areunskilled or minimally skilled. Mostare qualified only for low-paying, entrylevel jobs in the area – with still moreengaged in day labor or domestic services. The service and restaurant sectors tendto provide entry-level opportunities for thoseseeking full-time, documented positions.6922,992700,000865,393Persons Employed800,000841,594900,0005.89Pop 16 in ArmedForcesIt is recommended that local municipalitieslower the cost of doing business, reduce taxes,ease government restrictions, and adopt business-friendly policies. This includes expeditingthe development process.Some suggest that, to the extent possible, freemarket policies be followed, and that government regulations be continually reduced.Others believe in more tax incentives and credits for businesses that create quality jobs –and that there should be more governmentalincentives for employers to stay in the Valley.One-stop centers should be developed andaggressively marketed. Small business loanprograms should be expanded. Job fairs areGovernance needs to be close to thecommunity – with strategies and policiesbeing developed through informed consensus. Public opinion polls can bevery useful in establishing more broadly-basedconsensus, and developing community buy-in.Public forums are often seen as cateringto vocal minorities, rather than gauging thebroader population.Agents for ChangeThose with the power and jurisdiction to makea difference include: businesses, parents, residents, city, county state, and federal officials.Some believe that community developmentdepartments of cities, urban planners, planningcommissions and neighborhood councils canalso perform key functions.San Fernando ValleySFV Indicators 2000 Rev 8.indd608/19/00, 3:59 PM
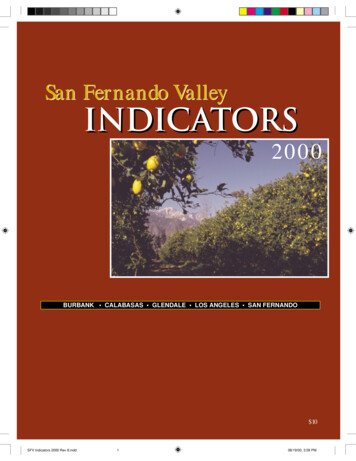
Criminal Activity in The San Fernando Valley 1993-1998Crime &Public Safety120,000Part I Offenses100,000Community Issue Ranking: 4 of 12Score: 8299,68995,72780,00085,30474,17060,000Crime in the Valley has followed anational trend, decreasing consistentlyover the last 5 years – and in equal measures among the jurisdictions. There has beena steady drop in Part One crimes per 100,000population. These Part One Offenses include:Homicide, Forcible Rape, Robbery, Larceny,Auto Theft, Arson, Aggravated Assault, andBurglary. Overall criminal activity decreasedby a full 40% in the Valley between 1993 and1999. In major crimes per 100,000 residents,areas compare as follows: Los Angeles City5,178 – Los Angeles City, Valley Portion 4,579– Los Angeles County 4,399 – San FernandoValley 3,949 – City of San Fernando 3,041 –City of Burbank 3,024 – City of Glendale 2,624– City of Calabasas 1,876 and City of HiddenHills 944.Fire Class RatingsThe purpose of fire class ratings is to determinea community’s ability to control damage, basedon facilities, training, equipment, distances,procedures, and other factors. This is done ona scale of one to ten – one being best. Onlya handful of cities nationwide receive a ratingof one. Glendale and Los Angeles rate 1. LosAngeles also serves the City of San Fernando.Burbank rates a 2 – and the three Los AngelesCounty stations in the Calabasas area rate 4,4 and 9 – in part because they service moredifficult terrain.Community OpinionsCrime statistics are improving. The Valley isperceived as a safe place to live, and crimewise,the area is headed in the right direction. Olderpeople often have a greater sense and fear ofHomicide, Forcible Rape,Robbery, Larceny, AutoTheft, Arson, Aggr.Assault, and 99719980crime. This is fed, in part, by a media tendency to sensationalize criminal activity.Economic conditions and cycles have importantimpacts on crime levels. There is believed to bea shortage of affordable housing. Some suggestencouraging developers and upscale buyers toinvest in depressed areas to encourage rehabilitation and revitalization.believe there is a need to upgrade programs foryouth, sports programs, music programs, andafter- school care.By increasing commerce, more jobs are created, and youth can be kept busy. Youth jobopportunities may be enhanced through thereinstatement of apprentice-style systems withappropriate educational programs and tie-ins.It is believed that a direct correlation can be made betweencrime and socio-economic conditions. Population density, joblessness and poor economics areall core influences. In teens,idleness can often result from alack of after-school activities orother meaningful pastimes. Criminals tend to attract other criminals,and the problems are compoundedby a proliferation of drugs in certain areas.CommunityRecommendationsStiffer laws, more enforcement and more policehave been suggested – along with better training, screening and improved police oversight.The focus needs to be placed on preventive measures, even in times wh
indicators 2000 BURBANK CALABASAS GLENDALE LOS ANGELES SAN FERNANDO San Fernando Valley 10 SFV Indicators 2000 Rev 8.indd 1 08/19/00, 3:59 PM