Transcription
Automatic cell counter for cell viabilityestimationJasna Lojk1, Luka Šajn2, Uroš Čibej2, Mojca Pavlin112Faculty of electrical engineering, University of Ljubljana, Ljubljana, SloveniaFaculty of computer and information science, University of Ljubljana, Ljubljana, Sloveniaemail: mojca.pavlin@fe.uni-lj.siAbstract - Despite several methods that exist in differentfields of life sciences, certain biotechnological applicationsstill require microscopic analysis of the samples and inmany instances, counting of cells. Some of those are drugdelivery, transfection or analysis of mechanism fluorescentprobes are used to detect cell viability, efficiency of aspecific drug delivery or some other effect. For analysis andquantification of these results it is necessary to eithermanually or automatically count and analyze microscopeimages. However, in everyday use many researchers stillcount cells manually since existing solutions require eithersome specific knowledge of computer vision and/or manualfine tuning of various parameters.Here we present a new software solution (namedCellCounter) for automatic and semi-automatic cellcounting of fluorescent microscopic images. This applicationis specifically designed for counting fluorescently stainedcells. The program enables counting of cell nuclei or cellcytoplasm stained with different fluorescent stained. Thissimplifies image analysis for several biotechnologicalapplications where fluorescent microscopy is used. Wepresent results and validate the presented automatic cellcounting program for cell viability application.We give empirical results showing the efficiency of theproposed solution by comparing manual counts with theresults returned by automated counting. We also show howthe results can be further improved by combining manualand automated counts.I.INTRODUCTIONCell counting is one of the most fundamental tools inbiology, medicine, and other life sciences. Severalmethods exist for quantification of different phenomena,but substantial part uses fluorescent dyes in combinationwith various protocols in order to analyze differentprocesses. Fluorescently stained cells can be analyzedusing flow cytometry[1], spectrofluorometry[2] and/orfluorescent microscopy[3]. There are of course otherexisting solutions for counting cells without the use offlorescence, like counting with counting chambers(hemocytometer)[4], but those can be time consuming andalso require detachment of the cells, which can result intheir loss and damage. Fluorescent microscopy is also astandard method for visualization and quantification ofdifferent phenomena and many researchers rely onmicroscopic images and image analysis tools to obtainreliable quantitative data. Cell counting using microscopicimages can be automated, and several semi-automatic andfully automatic solutions have been developed. Inpractice, however, such solutions require some additionalinput regarding various image parameters, such asthresholds, approximate nuclei distances, contrast settings,etc. These parameters require specific knowledge ofimage processing, which is not common among lifescience experts.Currently, several programs for cell counting arealready available. From many commercial solutions, suchas MetaMorph [5] (Molecula Devices, Downingtoetn, PA,USA), BioQuant [6] (Image Analysis Corporation,Nashville, TN, USA), Image-Pro [7] (Media Cybernetics,Bethesda, MD, USA) and SynenTec [8], to free softwaresuch as ITCN ImageJ Plugin [9] (US National Institute ofHealth, Bethesda, MD; USA), CellProfiler [10],UTHSCSA ImageTool (University of Texas HealthScience Center, San Antorio, TX, USA) [11] and CellC[12]. However, all of the existing solutions require someadditional input or even some image pre-processing of theraw images, which is not only time-consuming but canalso be also less user-friendly for life scientists [13].Besides the human factors, full automatisation of cellcounting faces several technical obstacles. Some of themost common problems, are: i) a wide variety of assaysand cell types resulting in a range of objects which arehard to generalize, ii) this can be even more problematicdue to uneven illumination and other equipment relatedfactors, such as electronic and/or optical noise that lead toimages having variable contrast and quality [14], iii) cellscan have a varying density in the cell culture and canoverlap [15], iv) extracellular debris and internal cellstructures can interfere with the recognition algorithm,giving false results and v) depending on the microscopytechnique used, images can have low contrast thereforedetection of individual nuclei in multinucleated cells isdifficult.In this article we present a novel structured method foreffective cell counting which does not require any specificknowledge of image processing. The method isspecifically designed for counting fluorescently stainedcells, that are used in many applications from assays formeasuring cell viability [16] to determination oftransfection efficiency [17–19]. We also show that thepresented solution has been already intensivelyimplemented for cell counting of different sets ofexperiments and it has drastically improved the typicalworkflow of researchers, as it is shown in our empiricalevaluation.
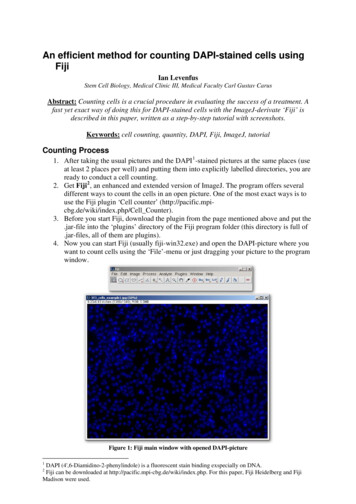
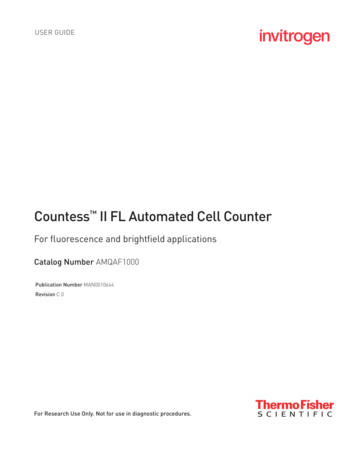
using the Contrast Limited Adaptive HistogramEqualization (CLAHE) algorithm [21–23]. It differs fromordinary histogram equalization in the respect that theadaptive method computes several histograms, eachcorresponding to a distinct section of the image, and usesthem to redistribute the brightness values of the image. Itis therefore suitable for improving the local contrast of animage and bringing out more detail. In our solution, theimage is cut into 64 (8 8) disjoint sections andhistogram equalization is applied on each partindependently. Within each image part, local maximumand minimum pixel intensity are calculated and theintensities are proportionally adjusted to the scale rangingfrom 0 to 255. The individual parts are then recomposedagain using interpolation at image borders. The finalimage has better contrast and can reveal more localinformation (Fig. 2).Figure 1. Schematic overview of the cell-countingmethodII.MATERIALS AND METHODSA. Algorithm usedThe presented program was written in C\# and uses anopen source C\# framework designed for developers andresearchers in the fields of Computer Vision andArtificial Intelligence (AForge.NET [20]). The algorithmused in the program can be viewed as a simple dataflowof images passing through various image processingalgorithms. The sequence of these algorithms wasdetermined empirically by trying to overcome as manyproblems on a sample set of images as possible. Theschematic overview of our method is shown in Fig. 1 andwill be described in detail below.The algorithm first addressed the problem of the imagecontrast, which is can be really low on microscopicimages and not necessarily distributed evenly throughoutthe image due to uneven illumination or other opticalproblems. The contrast of the image is thus improvedNext step is converting grey-scale images to black-whiteimages where the object borders are defined using athreshold algorithm. In this step, Otsu Thresholdalgorithm [24], [25] was used, as it gave slightly betterresults compared to other tested algorithms (Huang,Renyi entropy method, and other). In this algorithm, thethreshold value 𝑡 is defined as the value that gives theminimal intra-class variance defined by:ω(t) σ12 (t) ω2 (t)σ22 (t)where 𝜔1 (𝜔2 ) is the probability that the pixel value inthe image is lower (higher) than 𝑡 and 𝜎12 ( 𝜎22 ) is thevariance of the pixel values lower (higher) than 𝑡.In cell cultures, cells tend to grow in close proximity,touch or even overlap, resulting in connected objects onthe images. To split the overlapping (touching) objects,the Watershed algorithm [26] was applied. The image iseroded on the watershed lines, which usually representexactly the borders between different cells. This enablesthe detection of individual cells, even multinucleated andoverlapping cells (Fig. 2). Next, the connected regions arecounted using classical blob detection algorithm [27],which counts the objects separated by black background.Although the counting algorithm is robust, as we willshow in the following sections, the miscounts can stilloccur on more problematic images. To correcterroneously counted objects, a function was added to theuser interface that enables the user to add or removeobjects from the count with a mouse click. This will beFigure 2. A sequence of images produced by the program on a sample image.
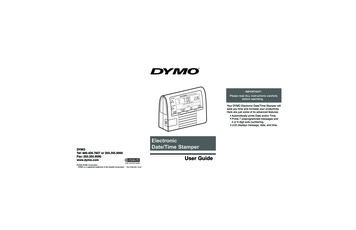
referred as a semi-automatic counting henceforth.B. Cell culturingThe experiments used for program validation weredone on Chinese hamster ovary cells (CHO) grown inHam's tissue culture medium for mammalian cells (HAM)supplemented with 10% fetal bovine serum (FBS) at 37 Cin 5% CO2-enriched air at saturation humidity. Allexperiments were performed on 24 h old cell cultures inexponential growth phase.C. Nanoparticles and cell viabilityThe cell viability experiment was performed as describedpreviously [12]. Briefly, cells were incubated withincreasing concentration of polycationic polymer coatedmagnetic nanoparticles for 24 h and stained with twofluorescent dyes; Hoechst 33342, which stained all cellnuclei, and propidium iodide (PI), which differentiallystained only dead cells. At least 15 visual fields at 200 magnification were taken of each sample for each usedfluorescent dye using a fluorescent microscope (Zeiss200, Axiovert, Germany). The images were recorded byMetaMorph imaging system software (Visitron,Germany) and saved in TIF format.D. Cell countingThe algorithm was developed and optimized based onmicroscopic images obtained from several different typesof experiments and experimental repeats, but forevaluation of the program efficiency, one randomexperiment was selected.Cells on the images of the selected experiment werecounted using only CellCounter (automatic), by manuallycorrecting CellCounter’s results (semi-automatic) and bymanually counting using ImageJ software (manual)(v1.45s, National Institute of Health, USA). Three peoplecounted the experiment independently to determine interpersonal error. Counting time was noted for each countingstep. Results are expressed as mean standard error (SE).III.RESULTS AND DISCUSSIONWe have developed an algorithm for automatic cellcounting of fluorescently stained cells. As an example toevaluate the program, cells were stained with bluefluorescent dye Hoechst and with red fluorescent dye PI.The program can also be used to count cells or objectslabeled with other fluorescent markers, like greenfluorescent protein (GFP) [13], [14].The algorithm of our program works by improving thecontrast of bright objects on the images (in our casefluorescently stained nuclei and/or cytoplasm) andconverts the obtained grey-scale images to black-whiteimages on which the automatic counting is applied. Assuch, the program does not require images with objectsthat have only clear borders and was found quiteflexible/robust in determining accurate numbers of cellseven if the quality of images is not ideal. As seen fromFig. 3, the program is able to count cells on out of focusimages with relatively small errors. This allows lessaccurate and thus faster acquisition of images forcounting. Also, because the algorithm does not rely onsize or shape of the objects, the program can be applied tofluorescent images of any appropriately stained cell line,as already confirmed for several different cell types(results not shown).Cells of the same experiment were stained with Hoechst,which stains all cell nuclei, thus giving us the totalnumber of the cells (Fig. 4), and with PI, which onlystains dead or damaged cells (Fig. 5, Fig. 6). Thiscombination of dyes can be used to determine cellviability [12]. To obtain the number of viable cells, whichwas the purpose of the experiment, the number of deadcells was subtracted from the number of all cells (Fig. 7).Figure 3. A demonstration of the robustness of the program. The figures are images of Hoechst stained nuclei on the samevisual field obtained on different out of focus planes, under (B, C, D) or above (F, G, H) the plane in focus (E). The totalnumber of cells was obtained by manually counting the cells on phase contrast image. Above each image are given thetotal number of automatically counted cells and the percentage of the cells compared to manual count. The fluorescentimage in focus (E) gave a 100% counting accuracy.
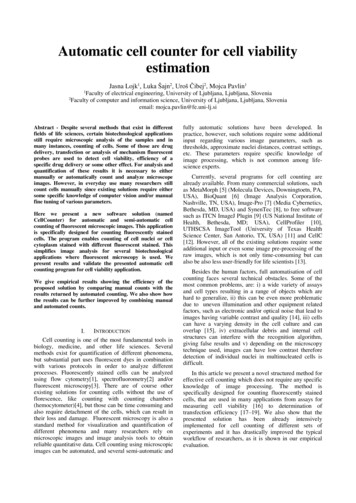
All images were counted by three users to obtain theinter-personal error and the differences in obtainedcounting results for all three applied counting methods;manual, semi-automatic and automatic counting.Figure 4. Comparison of counting results obtained bycounting fluorescently stained cell nuclei to determine thetotal number of CHO cells after exposure to increasingconcentration of nanoparticles for 24 h. Three countingmethods were used: manually by counting Hoechstpositive cells using ImageJ software, semi-automaticallyby correcting CellCounter counts and automatically byusing CellCounter only. The results presented the averagepercentage of viability for separate samples compared tonon-exposed control obtained by independent counting ofthe same experiment by three users with correspondingstandard error (N 3).Figure 5: Comparison of counting results obtained bycounting fluorescently PI stained cell to determine thenumber of dead CHO cells as a measure of cytotoxicityof increasing concentration of nanoparticles for 24 h.Three counting methods were used:manually bycounting PI positive cells using ImageJ software, semiautomatically by correcting CellCounter counts andautomatically by using CellCounter only. The resultspresented are average cell numbers for separate samplesobtained by independent counting of the same experimentby three users with corresponding standard error (N 3).Figure 6. Comparison of counting results obtained bycounting fluorescently stained cell nuclei to determine thenumber of dead CHO cells as a measure of cytotoxicityof increasing concentration of nanoparticles for 24 h.Three counting methods were used:manually bycounting PI positive cells using ImageJ software, semiautomatically by correcting CellCounter counts andautomatically by using CellCounter only. The resultspresented the average percentage of toxicity for separatesamples compared to the number of all cells in nonexposed control obtained by independent counting of thesame experiment by three users with correspondingstandard error (N 3).Figure 7. Comparison of counting results obtained bycounting fluorescently stained cell nuclei (stained withHoechst) reduced by the number of dead cells (stainedwith PI) to determine the viability of CHO cells exposedto increasing concentration of nanoparticles for 24 h.Three counting methods were used:manually bycounting Hoechst positive cells using ImageJ software,semi-automatically by correcting CellCounter counts andautomatically by using CellCounter only. The resultspresented are average cell numbers for separate samplesobtained by independent counting of the same experimentby three users with corresponding standard error (N 3).The counting results for all three counting methodsshowed reasonably good correlation and small standarderrors, indicating also a relatively low inter-personal erroras shown in Figs. 4-7. The differences between manual orsemi-automatic counting and automatic counting aremostly due to two or more objects in substantial contactbeing counted as one or due to objects positionedpredominantly outside of the margin of the image.Generally, we observed better performance in imageswith fewer and randomly scattered objects. On the otherhand, the program had problems recognizing the rightobjects on images with low contrast, either images withno cells or with dimly stained cells. Still, the obtaineddifferences are small compared to the expected deviationsbetween repeated experiments, indicating the algorithm isrobust enough and can be used as a helpful aid for imageanalysis.Simultaneously, time required for counting with eachcounting method (automatic, semi-automatic or manual)was recorded for all three users. As seen from Fig. 8, the
program significantly reduces the time necessary to countthe acquired images from hours (manual counting) tominutes (semi-automatic counting) or even seconds(automatic counting), depending on the required accuracyof the results.object (cell) is labeled so the user can quickly assert theaccuracy of the counting event.IV.CONCLUSIONSIn this article, we present an alternative solution forautomatic and semi-automatic counting of cells onfluorescent microscopic images. As we showed in thispaper, the program enables consistent, robust, fast andadequately accurate determination of fluorescent cellsand can therefore be applied to a range of differentapplications in different fields of life sciences wherefluorescent labeling is used for quantification of differentphenomena.Figure 8. Comparison of counting time using threecounting methods: manually by counting Hoechst and PIpositive cells using ImageJ software, semi-automaticallyby correcting CellCounter counts and automatically byusing CellCounter only. The results presented are averagecounting times for separate samples of three independentusers with corresponding standard error (N 3).Moreover, the requirements of installation of CellCounterprogram are minimal, the interface is user friendly (Fig.9), requiring no additional image manipulation or tuningof parameters to get reliable results (RAW images asobtained from the microscope can be used). Images canbe loaded through the interface or by simple drag anddrop action. The program counts the cells automaticallyas soon as the user selects the image, and allows simplecorrections to the program count by adding or removinghits on the selected image with simple mouse clicks. Theprogram also enables to skip a non-representative image.The results are automatically ordered and can be easilycopied to clipboard to transfer them to the editingprogram of choice.Figure 9. A screenshot of the CellCounter programinterface showing the result of one automatic count. EachACKNOWLEDGMENTThe authors would like to thank David Karlaš for the helpwith the program and Klemen Strojan and Maja Jankovecfor their help with the manual cell counting. This workwas supported by Slovenian Research Agency withinproject J4-4324, young researchers program and MRICUL IP-0510 Infrastructure program.REFERENCES[1] M. Rieseberg, C. Kasper, K. F. Reardon, and T.Scheper, “Flow cytometry in biotechnology,” Appl.Microbiol. Biotechnol., vol. 56, no. 3–4, pp. 350–360,Aug. 2001.[2] J. R. Lakowicz, Principles of FluorescenceSpectroscopy, 3rd ed. Springer, 2006.[3] D. J. Stephens and V. J. Allan, “LightMicroscopy Techniques for Live Cell Imaging,”Science, vol. 300, no. 5616, pp. 82–86, Apr. 2003.[4] F. J. Dein, A. Wilson, D. Fischer, and P.Langenberg, “Avian Leucocyte Counting Using theHemocytometer,” J. Zoo Wildl. Med., vol. 25, no. 3,pp. 432–437, Sep. 1994.[5] Metamorph meta-imaging-series/metamorph.html[6] BioQuant - http://lifescience.bioquant.com/[7] Image-Pro http://www.mediacy.com/index.aspx?page IPP[8] SynenTec - http://www.synentec.com/[9] S. R. Gallagher, “Digital Image Processing andAnalysis with ImageJ,” in Current ProtocolsEssential Laboratory Techniques, John Wiley &Sons, Inc., 2008.[10] A. E. Carpenter, T. R. Jones, M. R. Lamprecht,C. Clarke, I. H. Kang, O. Friman, D. A. Guertin, J. H.Chang, R. A. Lindquist, J. Moffat, P. Golland, and D.M. Sabatini, “CellProfiler: image analysis softwarefor identifying and quantifying cell phenotypes,”Genome Biol., vol. 7, no. 10, p. R100, 2006.[11] “UTHSCSA ImageTool.” [Online]. tml.[Accessed: 02-Apr-2014].[12] J. Selinummi, J. Seppälä, O. Yli-Harja, and J. A.Puhakka, “Software for quantification of labeled
bacteria from digital microscope images by automatedimage analysis,” BioTechniques, vol. 39, no. 6, pp.859–863, Dec. 2005.[13] J. Byun, M. R. Verardo, B. Sumengen, G. P.Lewis, B. S. Manjunath, and S. K. Fisher,“Automated tool for the detection of cell nuclei indigital microscopic images: application to retinalimages,” Mol. Vis., vol. 12, pp. 949–960, 2006.[14] R. M. Haralick and L. G. Shapiro, “Imagesegmentation techniques,” Comput. Vis. Graph.Image Process., vol. 29, no. 1, pp. 100–132, Jan.1985.[15] K. Li, E. D. Miller, L. E. Weiss, P. G. Campbell,and T. Kanade, “Online tracking of migrating andproliferating cells imaged with phase-contrastmicroscopy,” in IN: PROC. IEEE CONF. COMP.VISION AND PATT. RECOG. WORKSHOP, P. 65.IEEE COMPUTER SOCIETY PRESS, LOSALAMITOS, 2006, p. 65.[16] V. B. Bregar, J. Lojk, V. Suštar, P. Veranič, andM. Pavlin, “Visualization of internalization offunctionalized cobalt ferrite nanoparticles and theirintracellular fate,” Int. J. Nanomedicine, vol. 8, pp.919–931, 2013.[17] M. Kanduser, D. Miklavcic, and M. Pavlin,“Mechanisms involved in gene electrotransfer usinghigh- and low-voltage pulses--an in vitro study,” pp.265–271, Feb. 2009.[18] T. Marš, M. Stražišar, N. Kotnik, K. Pegan, J.Lojk, Z. Grubič, and M. Pavlin, “Electrotransfectionand lipofection show comparable efficiency for invitro gene therapy of primary human myoblasts,”unpublished, 2014.[19] I. Marjanovic, M. Kandušer, D. Miklavčič, M.Manček Keber, and M. Pavlin, “Comparison of flowcytometry, fluorescence microscopy andspectrofluorometry for analysis of gene electrotransferefficiency,” unpublished, 2014.[20] “AForge.NET Framework.” [Online]. k/.[Accessed: 02-Apr-2014].[21] S. A. Ahmad, “Analysis of CompoundEnhancement Algorithms (CEA) based on AdaptiveHistogram Equalization (AHE) on Intra-oral DentalRadiographs Images,” Int. J. New Comput. Archit.Their Appl. IJNCAA, vol. 4, pp. 902–916, 2011.[22] H. D. Cheng and X. J. Shi, “A simple andeffective histogram equalization approach to imageenhancement,” Digit. Signal Process., vol. 14, no. 2,pp. 158–170, Mar. 2004.[23] K. Zuiderveld, “Contrast limited adaptivehistogram equalization,” pp. 474–485, 1994.[24] N. Otsu, “A Threshold Selection Method fromGray-Level Histograms,” Syst. Man Cybern. IEEETrans. On, vol. 9, pp. 62–66, 1979.[25] X. Xu, S. Xu, L. Jin, and E. Song,“Characteristic analysis of Otsu threshold and itsapplications,” Pattern Recognit. Lett., vol. 32, no. 7,pp. 956–961, May 2011.[26] L. Vincent and P. Soille, “Watersheds in digitalspaces: an efficient algorithm based on immersionsimulations,” IEEE Trans. Pattern Anal. Mach.Intell., vol. 13, no. 6, pp. 583–598, Jun. 1991.[27] F. Chang, C.-J. Chen, and C.-J. Lu, “A lineartime component-labeling algorithm using contourtracing technique,” Comput. Vis. Image Underst., vol.93, no. 2, pp. 206–220, Feb. 2004.
Automatic cell counter for cell viability estimation Jasna Lojk1, Luka Šajn2, Uroš Čibej2, . and automated counts. I. INTRODUCTION Cell counting is one of the most fundamental tools in biology, medicine, and other life sciences. . manually counting using ImageJ software (manual) (v1.45s, National Institute of Health, USA). Three people