Transcription
Quaterly Carbon Market ReportSeptember Quarter 2021Table of ContentsReport objective3Report disclaimer3Executive summary51. Australian carbon credit units (ACCUs)81.1.1.2.1.3.1.4.1.5.2.3.4.Supply and demand balanceFactors impacting supplyFactors impacting demandMarket tradingKey dates810131416Large-scale generation certificates (LGCs)172.1.2.2.2.3.2.4.2.5.1718232425Supply and demand balanceFactors impacting supplyFactors impacting demandMarket tradingKey datesSmall-scale technology certificates (STCs)263.1.3.2.3.3.3.4.3.5.2627323233Supply and demand balanceFactors impacting supplyFactors impacting demandMarket tradingKey datesVoluntary market demand344.1.4.2.4.3.4.4.4.5.3436394243Voluntary demand for Australian units and certificates2020 retrospective - voluntary markets grow their shareLooking forwardPricesOther units5.Market spotlight: Small and mid-scale solar PV outlook446.Emissions reduction47Glossary49List of acronyms and abbreviations52
Report objectiveCarbon markets play a key role in Australia’s efforts to reduce emissions. The Clean Energy Regulator hasprepared this report to support the effective operation of Australia’s carbon markets.This report consolidates information across the 3 national carbon markets that the Clean EnergyRegulator administers for the September quarter 2021 (July 2021 to September 2021) and providesinformation on supply and demand trends and opportunities to inform market decisions.Report disclaimerAll figures are sourced from the Clean Energy Regulator unless otherwise referenced. All statements inthis report reflect current policy settings, other than in specific instances where the AustralianGovernment has announced or is consulting on proposed policy changes.This Quarterly Carbon Market report represents the views of the Clean Energy Regulator at the date ofpublication. The Clean Energy Regulator is providing this information to the market to increase markettransparency, help identify genuine low-cost carbon abatement opportunities, and assist entities thatproduce or need to source units and certificates under the schemes the Clean Energy Regulatoradministers. The Clean Energy Regulator has used its best endeavours to ensure the quality of theinformation in this document, but cannot guarantee its accuracy or completeness. The Quarterly CarbonMarket report is not legal, business or financial advice. You should obtain independent professionaladvice on your particular circumstances before making any investment decisions. The information isprovided as general information only. Neither the Clean Energy Regulator nor the Commonwealth ofAustralia will accept liability for any direct, incidental or consequential loss or damage resulting from theQuarterly Carbon Market report, or the information provided through the Quarterly Carbon Marketreport, or the availability or non-availability of the Quarterly Carbon Market report.Version historyVersion1.00Date26 November 2021Changes
OFFICIALExecutive summaryEmissions in the electricity sector are declining quickly due to rapid renewables deployment displacingthermal generation. A record 32% of electricity generated in the NEM in Q3 2021 was from renewableenergy. The 2021 calendar year is likely to average around 30%, double the 15% share in 2017.Results from the September 2021 quarter (Q3) confirm total emissions reduction from the ERF and RETschemes remain on track for an estimated 57 million tonnes carbon dioxide equivalent (CO2-e) for thecalendar year - approximately 17 million tonnes from ERF and 40 million tonnes from the RET - using theconservative method that calculates the implicit avoided carbon content of renewable generation1.A less conservative estimate of avoided emissions from RET incentivised generation, based on estimatesof the intensity of thermal generation displaced2 would put total emissions reduction from the ERF andRET for this year at around 75 million tonnes CO2-e.The 13th ERF auction held on 13 and 14 October 2021 resulted in 6.8 million ACCUs contracted underoptional delivery contracts at an average price of 16.94 per ACCU. There were no fixed deliverycontracts.This confirms the market sees value in optional delivery contracts to underwrite projects while providingthe flexibility to sell the ACCUs to those who need them for voluntary emissions reduction ambition orstatutory obligations.Ahead of COP26 in Glasgow, the Government announced a commitment toward net zero emissions by2050.ACCU supply continues to growNew supply of ACCUs was 4.8 million units in Q3 – nearly double the supply in Q3 2020. This took totalsupply for the first 9 months of 2021 to 13.6 million, a 25% increase over the same period in 2020.Supply is now likely to exceed 2021 expectations of 17 million units.The outlook for ACCU supply is positive. This quarter saw 54 new projects registered in the ERF bringingthe total for the year to 145 projects, 67% higher than for the same period last year.Two significant milestones were also achieved in Q3 – the registration of the 1000th ERF project and theissuance of the 100 millionth ACCU.On 29 September, the new carbon capture and storage (CCS) method was made available followingapproval by the Minister for Industry, Energy and Emissions Reduction. The Minister also announced the2022 priorities for ERF method development which included transport (including EV charging), hydrogen(including injection of clean hydrogen into the gas network), an integrated farm method, carbon captureuse and storage, and savanna fire management.Further information is available in Chapter 1.Investment in large-scale renewables is trending upAs predicted in the Q2 report, Q3 was a very strong result for final investment decisions (FID) with 1.1GW of capacity announced. This brings the 2021 total to 1.9 GW. The Clean Energy Regulator is1The implicit avoided carbon content approach multiplies estimated small and large scale RET incentivised generation (megawatt hours)multiplied by the rapidly reducing average emissions intensity of all grid generation (tonnes CO2-e per megawatt hour). The avoided carboncontent of renewable energy will ultimately decline as thermal generation becomes a smaller part of electricity generation.2 The thermal generation displaced approach multiplies estimated RET incentivised generation by the emissions intensity of average thermalgeneration (which is higher than the average emissions intensity of all grid generation).5
OFFICIALexpecting a similar level of capacity to achieve FID in Q4, likely bringing the full year total to the high endof its original 2 to 3 GW estimate and potentially exceeding the 2.7 GW from 2020.See chapter 2 for more information.Rooftop solar remains resilient despite Covid-19 lockdownsAdded rooftop solar capacity from the SRES for 2021 is expected to set a new record at approximately3.2 GW as installations are expected to rebound in Q4 following easing Covid-19 restrictions.Despite extended Covid-19 lockdowns in New South Wales, Victoria and the ACT, small-scale solarsystem installation held ground in Q3 with total installed capacity on par with Q3 2020.As stated in the Q2 report, total added capacity could have exceeded 3.6 GW this year in the absence ofCovid-19 lockdowns.The Integrity Review of the Rooftop Solar PV Sector was released on 16 September 2021, along with theGovernment response. The report recommends major changes to the SRES to lift integrity andaccountability in the rooftop solar PV sector, protect consumers and ensure emission reductions occur.Consultation on draft amendments to regulations is expected to occur in Q4 this year.LGC supply is strong but market balance remains tightLGC supply increased by 9.2 million in Q3 and is expected to be in the upper end of the 37 to 40 millionestimated for 2021. This means eligible generation will be close to 40,000 gigawatt hours (GWh), wellabove the 33,000 GWh statutory demand target.Nevertheless, total supply and demand for LGCs is likely to remain tight to 2023, and possibly beyond, asvoluntary cancellation continues to increase and 17 million LGCs are needed to claim 1 billion inshortfall charges from prior years.LGC supply and demand is discussed further in Chapter 2.Voluntary demand continues to growTotal Australian carbon unit and certificate cancellations for 2021 are 2.7 million, up 24% year on year atthe end of Q3. The ACT government cancellation of 2.2 million LGCs is an addition to this.Climate Active participants contributed a significant 20% of the voluntary demand for both LGCs andACCUs, while cancellation of LGCs for GreenPower also increased by 34% compared to 2020.3An in-depth look at the voluntary demand market is available at chapter 4.New carbon market initiatives gain momentumThe Australian Carbon Exchange moves to the procurement stage later this year with 13 partiesshortlisted. These entities have been invited to tender for exchange trading and related market servicesand/or registry related services. Further information can be found on our dedicated Australian CarbonExchange web page.Final consultation on the pilot design of the Corporate Emissions Reduction Transparency (CERT) reportwas completed in October. We expect the CERT report to be launched later this year. CERT provides aframework for Australian companies (above the NGER publication threshold) to publicly report on theirnet emissions position and emissions reduction commitments, and progress, in a clear and consistent3This is excluding LGCs cancelled by the ACT government.6
OFFICIALway. It will also support climate-related disclosures by Australian companies and give investors,shareholders and the public a clearer picture of action taken by companies to reduce net emissions.Unit and certificate pricesACCU spot prices increased steadily reaching 26, up 7 at the end of Q3. Trades post the end of Q3 sawthe reported spot price increase to 37 in early November.The difference between the average optional delivery contract price and the reported spot price is nowaround 20.Reported spot trades during this period of material increase in price have been on relatively smallvolumes and reflect short term supply/demand dynamics. The Clean Energy Regulator is monitoringthose trades closely in the Australian National Registry of Emissions Units (ANREU) as the over-thecounter market is relatively thin. Total ACCU holdings in ANREU accounts increased from 9.6 million atthe end of Q2 to 10.9 million at the end of Q3.Further data and analysis on this can be found in Chapter 1.During Q3, LGC spot prices increased by 7.15, reaching 40.40—the highest price since January 2021.This matches historical patterns as electricity retailers secure supply in the lead up to the annualstatutory surrender on 14 February next year.Small-scale Technology Certificates (STC) spot prices remained stable for the quarter.Table ES.1 Price trend, September quarter 20214CertificatetypeSpot price AUDACCU 26.50 7.20LGC 40.40 7.15STC 38.75- 0.15(30 September2021)4QuarterlytrendData sourced from Jarden and TFS Green.7
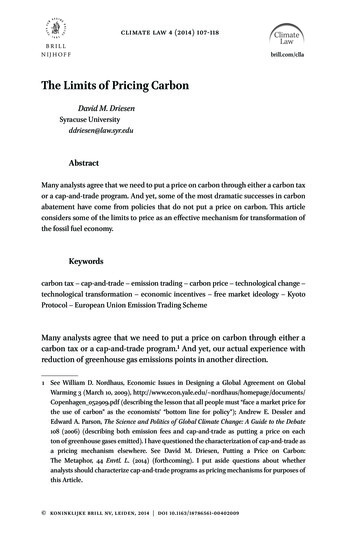
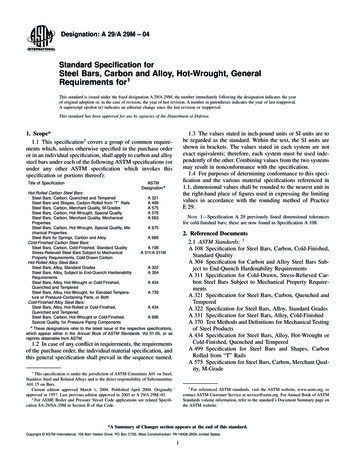
1. Australian carbon credit units (ACCUs)Key messages ACCU spot prices increased by more than 7 in Q3 to 26.50 before climbing to 37.00 in early November. 6.8 million tonnes of abatement was contracted at an average price of 16.94under optional delivery contracts at ERF Auction 13. ACCU supply in 2021 is up 25% compared to the same period last year with 4.8million ACCUs issued in Q3.oTotal supply is likely to exceed expectations for 2021 and reach 17.3million ACCUs.oThe coal mine waste gas variation and the carbon capture and storagemethod made in Q3 will substantially strengthen supply in the shortterm. Total ACCU holdings in ANREU accounts increased to a record 10.9 million units,up 12% from Q2. Project registrations were 67% higher than for the same period last year with 54registrations in Q3, bringing total new projects for 2021 to 145.oThe ERF surpassed 1000 registered projects on August 26 and the 100millionth ACCU was issued on September 6.1.1. Supply and demand balanceSupply of 4.8 million ACCUs was added to Australian National Registry of Emissions Units (ANREU)accounts during Q3 2021, while the total demand from ERF contract deliveries and voluntarycancellations totalled 3.7 million units (see Figure 1.1). The balance of ACCUs held in the ANREUincreased for the second consecutive quarter to a record 10.9 million units, up 12% on the 9.7 millionACCUs held at the end of Q2 2021 (see Table 1.1).8
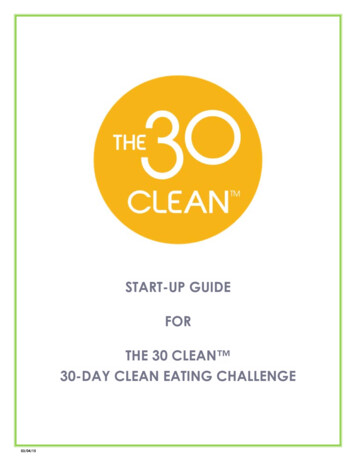
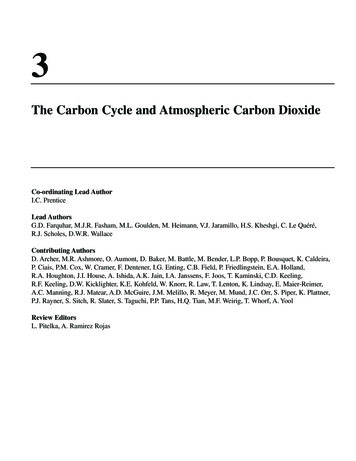
Figure 1.1 ACCU supply and demand balance (millions), 2019 to 2021Table 1.1: Balance of supply and demand September quarter 2021 close5Balance/supply of ACCUs from June quarter 2021ACCUs issued September quarter 2021ERF contract deliveriesSafeguard cancellations 6Voluntary cancellationsACCU relinquishment7Net balance at the end of September quarter 20219,711,9824,814,773- 3,444,6510-220,358010,861,746During 2021, total ACCU holdings have increased 70% with accounts in all categories increasingsubstantially. ACCUs held by project proponents8 increased 52% to 6.4 million, while holdings by‘Business and Government enterprises’9 increased by 69% to 2.2 million. ‘Intermediary’10 accountsincreased 156% from 0.9 million to 2.3 million at the end of Q3 (see Figure 1.2).At the end of Q3, there were 15 accounts in the ‘intermediary’ category. In the past year, a total of 2.8million units have flowed into these accounts from project proponents, business and governmententerprises, while 1.4 million ACCUs have been transferred out of these accounts. Of the ACCUstransferred out, 0.4 million were voluntarily cancelled by 9 account holders.5Within a specified period, supply of ACCUs refers to ACCUs issued. Demand of ACCUs incorporates 3 sources including Commonwealth ERFcontract deliveries, safeguard mechanism cancellations and state and territory government and private sector voluntary cancellation.6Safeguard mechanism cancellations does not include deemed cancellations. A ‘deemed cancellations occurs when ACCUs issued under an ERFproject at a safeguard facility, in a particular year, are delivered to the Commonwealth under an ERF contract.7 For more information see the Relinquishing ACCUs section of Australian carbon credit units.8 Project proponent - Account holder is connected to one or multiple ERF projects.9 Business and Government enterprise - Account holders that do not have direct link to ERF projects. These include safeguard entities, voluntaryparticipants, local government entities that are accumulating for voluntary or compliance purposes.10 Intermediary - Account holder’s facilitate trading of units between the supply and demand sides of the market.9
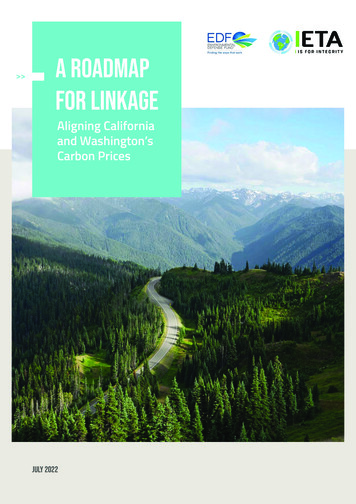
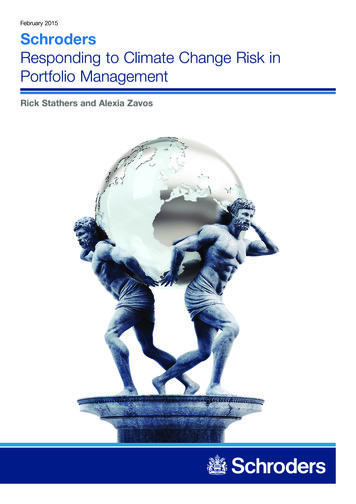
Figure 1.2: Breakdown of ACCU holdings by market participation (millions), March quarter 2018 to September quarter 20211.2. Factors impacting supplyCreditingMore than 100 million ACCUs have now been issued under the ERF. The 100 millionth ACCU was issuedto the Wilinggin Fire Project, a savanna burning project located on the Wilinggin Indigenous ProtectedArea in the Kimberley in Northern Western Australia. In Q3, 4.8 million ACCUs were supplied to themarket, almost double the 2.5 million units supplied in Q3 2020.A total of 561 projects are generating ACCUs (see Table 1.2). This is 11% more than the same time lastyear. Of these, 16 projects were credited for the first time during Q3 2021, contributing 450,639 ACCUsto supply. These 16 projects took, on average, 2.5 years to progress from registration to crediting andincluded 15 vegetation methods.Table 1.2: Crediting status of projectsCrediting statusNo. of projectsProjects generating ACCUs546Projects yet to receive ACCUs11489Conditionally registered361Unconditionally registered128The 4.8 million ACCUs issued in Q3 can be attributed to 3 method types: vegetation (47%), waste (40%)and savanna burning projects (12%) (see Figure 1.3).11Once projects are registered, they have a crediting period between 7 and 25 years depending on the method.10
Figure 1.3. ACCUs issued per method type (millions), March quarter 2019 to September quarter 2021Projects in NSW dominated ACCU supply in Q3 with 33% of the total units issued, followed by QLD with28%. The majority of ACCUs issued in these states were for vegetation projects (see Figure 1.4).Figure 1.4: Total number of ACCUs issued12 per method type by location, September quarter 2021 and scheme-to-dateThe outlook for ACCU supply remains positive. A total of 13.6 million ACCUs have been issued in 2021and supply is expected to exceed the 17 million estimated for the year by the Clean Energy Regulator.12Does not include revoked projects.11
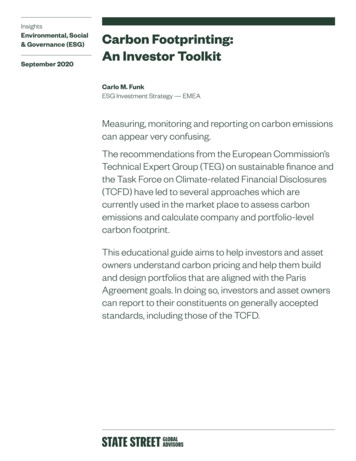
A total of 41 projects have been issued ACCUs for the first time in 2021, supplying 1.3 million ACCUs orjust under 10% of the year’s supply to date.Development of new and varied methods is also expected to unlock material volumes of supply to theACCU market in the short term. The carbon capture and storage method and the coal mine waste gasvariation are now available under the ERF after being approved in late September 2021. In November,Beach Energy Ltd and Santos Ltd registered the Moomba carbon capture and storage project which isexpected to start generating a supply of 1.7 million ACCUs per annum from 2024.Applications from 58 landfill gas projects to transition to the 2021 method variation are being assessedwith a further 57 applications expected by 31 December 2021. The method variation extends creditingfor these projects for a further 5 years and is anticipated to supply up to an additional 21.6 million ACCUsto the market over that period.ProjectsThe ERF has passed 1000 registered projects, finishing Q3 at 1,035 projects. The registration ofAgriProve’s Street Carbon Project saw the scheme reach this key milestone. This soil carbon project willrun on a sheep and cropping farm at Gollan, New South Wales.There were 54 project registrations in Q3, 10 more than the same period in 2020 (see Figure 1.5). A totalof 145 projects have now been registered in 2021 compared with 87 in the same period in 2020. Thisincrease in registrations can mainly be attributed to soil carbon projects.Australian Integrated Carbon (AIC) registered 7 projects in the quarter, bringing its portfolio to 17projects. This increase in registration activity by AIC in the lead up to Auction 13 resulted in optionaldelivery contracts being secured against 9 projects (including 2 projects registered on 1 October 2021). Italso coincided with Mitsubishi’s move to acquire a 40% stake in the company.Figure 1.5: New registered projects per method type, March quarter 2019 to September quarter 202112
State investment buildsThe Tasmanian Government has allocated an additional 900,000 to the Landcare Action Grants Programand expanded the eligibility criteria to include carbon farming activities. This funding allocation is on topof 1.8 million previously allocated to the program. In addition, the state also unveiled the CarbonFarming Advice Pilot Rebate Program. This program is available to Tasmanian primary producers seekingadvice from approved advisors on the costs and benefits of accessing carbon credits, auditingrequirements, and on-ground actions that are eligible for carbon credits. The total funding allocated tothe program is 250,000.The second round of applications for the Queensland Government’s Land Restoration Fund (LRF), withup to 5 million funding available per project, closed on 8 October 2021 with shortlisted applicants to benotified in early December.Expressions of interest to Western Australia’s 15 million Carbon Farming and Land Restoration Programclosed on 20 August 2021 and preparation has begun for launching Round 2 in early 2022.The consultation period on the Northern Territory’s Greenhouse Gas Emissions Offsets Policy has nowclosed. The draft policy includes a proposal to prioritise the cancellation of Territory-generated ACCUsagainst Territory offset requirements.1.3. Factors impacting demandTotal demand in Q3 was 3.7 million ACCUs, 5% higher than Q3 2020 (see Figure 1.6). Commonwealthcontracts remained the largest source of demand at 94%. The proportion of voluntary and state andterritory demand remained stable with that observed in Q3 2020 at 6%.The total demand from fixed delivery contracts is not anticipated to increase in line with supply. This willensure an increasing supply of ACCUs to the secondary market. This is supported by the clear preferenceof bidders for optional delivery contracts at Auction 13 (see below for more detail).Figure 1.6: Actual and estimated demand13 for ACCUs (millions), 2019 to 2021Commonwealth demandThe total demand for ACCUs under Commonwealth contracts immediately after Auction 13 increased to209 million tonnes. Of this, fixed delivery demand accounted for 188.2 million tonnes, while the balanceof 20.8 million tonnes were optional delivery contracts. Although very small volumes of optional13Estimated demand is comprised of demand from scheduled delivery against Commonwealth contracts as at 30 September 2021 andestimated voluntary demand. Scheduled delivery against Commonwealth contracts include optional delivery contracts. ACCUs contractedagainst an optional delivery contract may not be delivered to the Commonwealth.13
deliveries have been made (8,818 tonnes), in general, the Clean Energy Regulator does not expectoptions to be realised.Auction 13 awarded 24 optional delivery contracts for 6.8 million ACCUs at an average price of 16.94per tonne. There were no fixed contracts awarded. In total, 85% of the bids on offer were purchased,demonstrating that scheme participants were bidding competitively with the average price paid wellbelow the spot price. The Clean Energy Regulator’s obligation under the law is to buy at the lowest priceand will buy up the long-run supply curve, not the short run supply curve.Optional delivery contracts de-risk and support investment in projects, while allowing projectproponents to contract for delivery at a higher price with others. This can facilitate additional supply inthe secondary spot market. The clear preference for optional delivery contracts highlights howAustralia’s carbon market is evolving. To date, 70,000 ACCUs from projects with optional deliverycontracts with the government have been sold on the secondary market.Commonwealth demand from contracts is anticipated to consume two-thirds of the total 2021 ACCUsupply of 17.3 million. Demand from fixed delivery contracts is set to increase next year. After this,contract deliveries on average remain flat over the 2022 to 2028 period at an average 13.7 millionACCUs/year before dropping significantly and tailing off.Figure 1.7: Commonwealth delivery for current portfolio of projects (volume of ACCUs, millions), 2015 to 20331.4. Market tradingMarket activity increased throughout Q3 2021, compared to the previous quarter, with 1.8 millionACCUs traded through 114 transactions (see Figure 1.10). The increase in market activity since the startof the year reflects a mix of accumulation strategies by some account holders; internal transfers withinANREU to package disparate parcels of ACCUs to meet demand by a third party and increased voluntarycancellations.14
Figure 1.8: ACCU market transactions (excluding ERF transactions), January 2019 to September 202114Spot priceOver the quarter, the ACCU spot price increased more than 7 from 19.30 to 26.50 (see Figures1.11 and 1.12).15 Prices have continued to rise post quarter reaching 37.00 in early November. Onseveral occasions there has been a step change in price trading off relatively small volumes. The CleanEnergy Regulator has and will continue to monitor trades for any potential unusual patterns. The risingspot price provides a signal to the market to invest in new ERF projects to meet anticipated growthfrom private demand.Figure 1.9: Historical ACCU spot prices ( AUD), January 2019 to September 20211514ACCU market transactions refer to the transfer of ACCUs between separate entities or groups and does not include issuances andcancellations of ACCUs. Transactions involving the transfer of ACCUs between project proponents, between project proponents and projectdevelopers, and between accounts belonging to the same company and/or subsidiaries are excluded.15 Data sourced from Jarden and TFS Green.15
Figure 1.10: ACCU spot prices ( AUD), September quarter 2021161.5. Key datesDateEventSignificance1 November 202117National Greenhouseand Energy Reporting(NGER) and Safeguardapplication deadlineDeadline for NGER reporters and Safeguard entitiesto submit:8th Annual AustralasianEmissions ReductionSummit 2021This annual event, hosted by the Carbon MarketInstitute (CMI), will showcase world-leadingknowledge sharing, commercial interactions andcapacity building, helping delegates to manageclimate risk and opportunities.9-10 December 2021 2021-22 NGER datacalculated and production adjusted baselineapplications (for baselines commencing 1 July2020).16Data sourced from Jarden and TFS Green.The usual NGER and Safeguard application deadline is 31 October following the end of the financial year. In 2021 the deadline has beenextended to 1 November, as 31 October falls on a weekend.1716
2. Large-scale generation certificates (LGCs)Key messages A record 32% average of electricity generated in the National Electricity Market (NEM)in Q3 2021 was renewable, with the 2021 calendar year average likely to slightly exceed30%.o 603 megawatts (MW) of new large-scale renewable energy capacity was approved18 in Q3,bringing the total for 2021 to 1.2 GW, a decrease from the 2.7 GW approved over the sameperiod last year.o The share of renewable generation in the NEM has doubled since 2017.Approximately 2 gigawatts (GW) of capacity expected to be accredited in 2021,with over 1.4 GW under application at the end of the quarter.Investment in large-scale renewable energy power stations appears to be trending up,signalling additional future utility scale build and generation.19o1.1 GW achieved a Final Investment Decision (FID) in Q3 compared to 44 MW inQ1 and 725MW in Q2, bringing 2021 total capacity to 1.9 GW.oMarket intelligence suggests FID for 2021 will be at the upper end of, and mayexceed, the 2 to 3 GW range predicted by the Clean Energy Regulator. LGC spot prices, following a normal seasonal pattern, increased sharply in Septemberfinishing the quarter at 40.40. LGC supply in 2021 is expected to be at the upper end of 37 to 40 million range predictedby the Clean Energy Regulator.2.1. Supply and demand balanceLGCs available for the 2021 assessment year is expected to be at the upper end of the estimated 43 to 46million range. This consists of 6.1 million LGCs carried forward from previous years, and the expectedcreation of 37 to 40 million LGCs in 2021.Approximately 32.6 million LGCs will be required to be cancelled to meet obligations against the 2021Renewable Power Percentage.20 Demand from liable entities eligible for shortfall charge refunds isestimated to be an additional 2.7 million LGCs. Cancellations against voluntary targets in 2021 isexpected to exceed 5.5 million LGCs, including 2.2 million LGCs that have been cancelled by the ACTgovernment towards their 100% renewable energy target.The LGC balance after the 2021 assessment year is likely to be at the upper end of the 2.3 to 5.3 millionrange (see Table 2.1). This relatively tight balance suggests that shortfall will be taken in the 202118This means accredited for scheme entry to be eligible for LGCs for every net megawatt hour of generation.Investment is defined as the capacity reaching a Final Investment Decision (FID).20 The Renewable Power Percentage (RPP) is set each year in regulation under the Renewable Energy (Electricity) Act 2001. For 2021 the RPP is18.54%.1719
assessment year to allow sufficient LGC liquidity. There is still 1 billion in consolidated revenuerepresenting over 17 million LGCs that can be redeemed under the 3-year rule.21Table 2.1 Estimated LGC supply and demand balance in 2021 assessment yearSupplyDemandLGCs available from previous assessment yearsa 6.1 million2021 LGC supply (available for 2021 surrender) 37 to 40 millionLegislated demand for 2021b-32.6 millionShortfall charge refundsc-2.7 millionACT Government scheme-2.2 millionOther Voluntary cancellationsc-3.3 millionEstimated total balance for 2021 assessmentyear 2.3 to 5.3 millionNotes:a Number reflects LGCs created before 2021 but still registered as available in the REC Registry as at 15 February 2021.b Number assumes no shortfall is taken for the 2021 assessment year.c These values are estimates for 2021 and could vary significantly based on commercial decisions.2.2. Factors impacting supplyLGC supplyLGC supply was 9.2 million in Q3, taking total supply for the first three quarters of 2021 to 26.4 million –a 22% increase from the same period in 2020.Further supply growth is expected with LGC creations typically peaking in Q4 (see Figure 2.1). This islikely due to generators with a baseline creating when they exceed baselines (typically in Q4) andgenerators creating LGCs before the end of the year enabling these LGCs to be used against therespective year’s liability22.Q4 2021 may also see above usual level of hydro generation with the Bureau of Meteorology forecastingthe November 2021 to January 2022 period is likely to be wetter than normal.23 This may result inincreased level of LGC creations from hydro generation in Q4. As such total LGC creations for 2021 isestimated to be at the upper end of the 37 to 40 million range.A balance of 26.2 million LGCs was held in the REC Registry at the end of the Q3.21Entities with a LGC shortfall of more than 10 per cent of their liability for a year incur a shortfall charge. Under certain circumstances, theseentities can subsequently surrender additional certificates and obtain a refund of the shortfall charges previously paid, les
The lean Energy Regulator has . Australia will accept liability for any direct, incidental or consequential loss or damage resulting from the Quarterly Carbon Market report, or the information provided through the Quarterly Carbon Market . ACCUs, while cancellation of LGCs for GreenPower also increased by 34% compared to 2020.3