Transcription
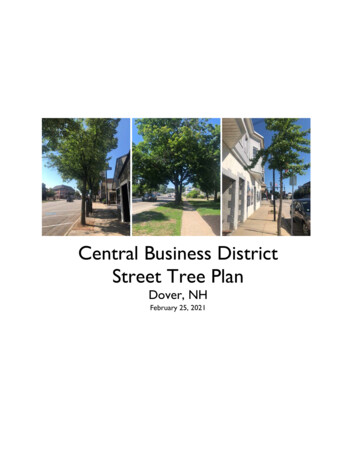
Central Business DistrictStreet Tree PlanDover, NHFebruary 25, 2021
AcknowledgementsThis Central Business District (CBD) Street Tree Plan was developed as part of a coastal resilience projectfunded by the New Hampshire Department of Environmental Services Coastal Program. The overall goal ofthe project includes strengthening the City of Dover’s resilience to climate change by improving the City’surban landscape through various mechanisms and providing education on innovative approaches tostormwater design.The project was overseen by a Project Team comprised of the following individuals:Steve Bird, City PlannerGretchen Young, Environmental Projects EngineerBill Boulanger, Deputy Director of Community ServicesKyle Pimental, Strafford Regional Planning CommissionJackson Rand, Strafford Regional Planning CommissionLiz Durfee, EF Design& Planning, LLCThe City’s Forest Sub-committee members assisted with defining the scope of and reviewing the Plan:Anna BoudreauRobert EckertSteven FellowsAmy Kramer PerryRick SchnableThis project would not have been possible without the time and effort of the volunteers who participated inthe street tree inventory data collection. The following individuals assisted with the inventory:Kristine BowdenAnna ClarkRebecca DiGirolomoDaniel EltringhamBarbara FerraraDick FerraroSteven FrickHeidi HenningerLeslie HerdCaroline KanaskieKassandra PearlTom RydeRick SchnableDennis ShanahanStrafford Regional Planning Commission staff Alaina Rogers and Stephen Geis also assisted with street treedata collection.The Project Team would also like to thank the following individuals who reviewed and provided guidance onthe recommended species list included in Appendix G of this Plan:Rebecca DiGirolomo, Natural Resources Field Specialist, Forestry UNH Cooperative ExtensionA.J. Dupere, Urban Forester, NH Division of Forests and LandsGreg Jordan, Rockingham County ForesterThe Plan was prepared by EF Design & Planning, LLC and Strafford Regional Planning Commission.This project was funded, in part, by NOAA's Office for Coastal Management under the Coastal ZoneManagement Act in conjunction with the New Hampshire Department of Environmental Services CoastalProgram.
Table of ContentsIntroduction . 1A)Guiding Principles & Objectives of this Plan . 3B)Role & Value of Street Trees . 4CBD Street Tree Inventory . 6A)About the Inventory . 6B)Findings . 7Tree Canopy Cover Analysis. 16A)About the Tree Canopy Cover Analysis. 16B)Findings . 16C)Socio-Economic Analysis. 20Street Tree Management . 23A)Tree Selection . 23B)Site-Specific Street Tree Design Considerations . 25C)Suggested Species for the CBD . 27D)Installation. 29E)Maintenance . 31Implementation . 33A)Prioritized list of planting locations in CBD . 33B)Management Needs. 37AppendicesAppendix A 2020 CBD Street Tree Survey QuestionsAppendix B 2020 Street Tree Inventory InstructionsAppendix C 2020 Street Tree Inventory Species ListAppendix D 2020 Street Tree Inventory Map SetAppendix E 2020 Tree Canopy & Socio-Economic Data MapsAppendix F Pertinent Local Regulations and GuidelinesAppendix G Matrix of Recommended Street Tree Species (sortable Excel database)Supplemental Data: GIS Database with Street Tree Inventory DataCentral Business District Street Tree PlanDover, NH
FiguresFigure 1. Map of Dover and the Central Business District (CBD) . 2Figure 2. Map of trees surveyed during the 2020 CBD inventory. 8Figure 3. Most prevalent street tree species in the CBD . 9Figure 4. Diameter at breast height (DBH) of street trees in the CBD (Q Quartile) . 10Figure 5. Height of street trees in the CBD (Q Quartile) . 10Figure 6. Overall condition of sites surveyed . 11Figure 7. Overall condition trees by species . 11Figure 8. Map of overall condition of street trees in the CBD . 12Figure 9. Type of maintenance needs identified in the CBD . 13Figure 10. Number of maintenance needs identified per street tree. 13Figure 11. Size of street tree pits. 14Figure 12. Tree condition by tree pit size . 14Figure 13. Map of trees identified as being appropriate for the site they are located in . 15Figure 14. Side of building that tree is located on . 16Figure 15. City-wide estimated tree canopy cover (Source: USDA NAIP, US Census Bureau) . 17Figure 16. Estimated tree canopy cover in the CBD (Source: USDA NAIP). 18Figure 17. Tree canopy cover and land cover (Source: USDA NAIP, NH GRANIT) . 19Figure 18. Tree canopy cover with overall social vulnerability index ranking of census tracts in Doverrelative to other census tracts in New Hampshire (Source: USDA NAIP, CDC SOVI, US CensusBureau). . 22Figure 19. US Forest Service tree selection guidelines for maximizing stormwater runoff and improvingair quality (Source: US Forest Service) . 24Figure 20. Regulations and guidelines for tree planting in Dover . 26Figure 21. CBD tree planting guidelines and spacing . 29Figure 22. Site preparation and planting checklists (Source: NH Division of Forests and Lands and USForest Service State and Private Forestry Service) . 30Figure 23. Location of empty tree pits/planting sites . 34Figure 24. Location of tree pits with stumps . 34Figure 25. Location dead or dying trees. 34Figure 26. Location of ash trees in the vicinity of Central Avenue and Main Street. 34Figure 27. Street tree density map . 36TablesTable 1. Tree canopy and socioeconomic data for Census tracts in Dover. 21Table 2. Basic principles of trees in urban design (Source: Adapted from CNU) . 25Table 3. CBD Street tree maintenance schedule. 32Table 4. CBD Street Tree Management Recommendations . 37Central Business District Street Tree PlanDover, NH
IntroductionThis Street Tree Plan includes:Section 1: Guiding principles and objectives for the plan and a discussion of the role and value ofstreet trees.Section 2: Information about the CBD street tree inventory that was conducted in the summer of2020 and an analysis of inventory results.Section 3: A summary of a City-wide GIS-based canopy cover and socio-economic data assessment.Section 4: A discussion of CBD street tree management, including species selection and street treedesign considerations, installation, and maintenance.Section 5: An implementation schedule to increase resiliency based on street tree inventory findings.This Street Tree Plan (hereafter the “Plan”) also includes several appendices with the inventory surveyquestions, inventory instructions, list of species found in the CBD, CBD inventory map set, canopycover and socio-economic data map set, a summary of pertinent local regulations and guidelines, and amatrix of recommended species for the CBD.This Plan implements Action Item #45 from the Natural Resources Master Plan Chapter: Maintain andaccurate inventory of City tree and develop and urban tree plan that provides tree planting and removalguidelines.Figure 1 shows a map of the CBD and extent of the street tree inventory. Street trees are trees plantedin the right-of-way, often in a tree pit in the sidewalk or in the grassy median between the sidewalk andstreet.Central Business District Street Tree PlanDover, NH1
Figure 1. Map of Dover and the Central Business District (CBD)Central Business District Street Tree PlanDover, NH2
A)Guiding Principles & Objectives of this Plan Strive for compatibility with complete streets practicesProvide practices to mitigate and adapt to climate changeGuide equitable tree planting across the cityServe a resource to inform day to day decisions of staffImprove integrated, efficient, and effective management of street trees and infrastructurePrioritize retention of existing trees when possible, but recognize the need to remove trees thatare no longer appropriate for a siteAdhere to goals, objectives, and findings documented in the City’s Master PlanImplement Dover’s vision for 2023, which includes: enhanced environmental quality andsustainability are actively pursued and inherent in all the city’s activities Excerpts from the City’s Climate Master Plan By the end of the century average summer temperatures could be up to 11 F warmer thanthe historical average from 1980 to 2009. Extreme heat waves may also become morefrequent, putting additional stresses on human health, infrastructure, and the electrical grid.Local impacts include droughtThe City recognizes increases in frequency and intensity of extreme precipitation due toclimate change will exacerbate stormwater runoff and the grit-suspended solids that carrymany of the pollutants of most concern, including bacteria, chloride, sediment, andnutrients.Infiltration is a low-impact way to replenish groundwater rather than convey runoff directlyto surface water bodies.Climate change will cause warmer temperatures, which can increase ground-level ozoneformation and may increase the number with days when air quality is poor.As temperatures rise, summer heat waves will become longer and more frequent. Facedwith these longer hot stretches plus increased population and growing demand, theregional power grid and energy providers will be challenged to supply adequate power.Periods of extreme heat also decrease the efficiency of power plants and place additionalstress on the system, especially when demand for electricity is highest. Dover’s mosturbanized areas, in the downtown core, may experience increases in the urban heat islandeffect (urban areas become significantly warmer than the surrounding rural areas due tohuman activities). That would create additional stresses for people living and workingthere.Underserved and vulnerable populations— including low-income persons and families, theelderly, and individuals with disabilities—may be more sensitive to climate change-relatedimpacts.Incorporate additional trees and native vegetation, while also preserving mature trees, intothe downtown landscape and other City-owned properties in order to help lower surfaceand air temperatures by providing shade.Central Business District Street Tree PlanDover, NH3
B)Role & Value of Street TreesThe urban forest includes trees in parks, landscapedboulevards, gardens, greenways, river corridors, wetlands,preserves, and trees on residential, commercial, and industrialproperty within cities and towns. Street trees are a critical partof an urban forest. Street trees are a public resource thatprovide a wide range of ecological, social, and economicbenefits.Street trees provide an important ecological role in the urbanenvironment. They create habitat for birds, insects, and wildlifeand support conservation of urban biodiversity. Native, denser,and larger trees typically provide better habitat for species suchas birds. 1Another key role that street trees play is providing ecosystemservices, which are benefits that people obtain fromecosystems. One ecosystem service that trees provide istemperature regulation. Tree planting is a highly effectivestrategy for cooling urban environments. 2 In the summer,leaves and branches typically reduce the amount of sunlight andsolar radiation below the tree canopy by 70-90%, dependingon the species. 3 By providing shade, street trees help toreduce the phenomenon referred to as the urban heat islandeffect, in which urbanized areas experience highertemperatures – 1 to 7 F higher in the day – than outlyingareas due to the prevalence of buildings, roads, and otherinfrastructure that absorb and re-emit the sun’s heat morethan natural landscapes. 4 Shaded surfaces may be 20 to 45 Fcooler than peak temperatures in non-shaded areas. Treesplanted on the western side of a building typically offergreater cooling benefits than those located on other sides. 5, 6Evapotranspiration associated with trees can future reducetemperatures in urban areas. Evapotranspiration is thecombination of evaporation from land and transpiration, orthe opening of stomata and release of water vapor, fromplants. This has a cooling effect on the atmosphere.Evapotranspiration increases as temperature increases andcan lower peak summer temperatures by 2-9 F . 7If designed properly trees can provide asignificant return on investment andbecome assets that increase with valueover time.-Congress for New UrbanismIn Dover’s Central BusinessDistrict, where forested landcomprises less than 5% of the landarea and over 90% of the district isdeveloped, street trees are criticalto cooling the urban environment.Enhancing the urban tree canopy isone strategy to adapt to climatechange and increasingly warmertemperatures.Street trees shade Central Ave buildingsStreet trees provide benefits in winter as well by acting as a wind break. Properly placed trees that donot block southern facing windows can reduce winter heating bills by 20-50%. 8, 9Trees also aid in stormwater management. By intercepting rainwater and reducing and filtering runoff inthe canopy and root zone, street trees contribute to stormwater management and improve the waterquality in receiving water bodies and groundwater. 10, 11 By drawing moisture from the soil, trees increasethe soil water storage capacity during rainfall events. They also enhance permeability of soils. 12 TreeCentral Business District Street Tree PlanDover, NH4
roots loosen soils as they grow, which increases infiltration. Trees with tap roots and deeper and morevertical roots have been found to promote greater infiltration than species with fibrous roots and morelateral, shallower roots. 13 Greater infiltration reduces stormwater runoff, helps to mitigate flooding, andpromotes groundwater recharge. Increasing the prevalence of street trees enhances stormwatermanagement in the City.Trees filter air pollutants and capture and store carbon dioxide, which helps to improve local air qualityand mitigate greenhouse gas (GHG) emissions. 14 In parking lots and along streets, trees that shadeparked vehicles keep them cooler and reduce evaporative emissions of volatile organic compounds fromgas tanks. 15 Leaves remove pollutants such as particulate matter, nitrogen oxides, sulfur dioxide, carbonmonoxide, and ground-level ozone from the air through a process called dry deposition. 16These regulating services have numerous social benefits, ranging from public health to enhancing thepedestrian realm. A reduction of pollution has been shown to reduce negative health consequencesassociated with poor air quality. 17 The cooling effect of trees can reduce heat-related illness, which isparticularly important in urban areas where residents are at a greater risk of heat stress and will becomeincreasingly at risk as extreme heat events occur more frequently. 18 In addition to cooling, the shadeprovided by trees reduces direct exposure to harmful ultraviolet rays. An even distribution of canopycover throughout a community supports social equity.Street trees contribute to placemaking and aesthetics of communities. They can soften the appearanceof wide streets, large parking lots, utilities, and structures, 19 as well as reduce urban noise. 20 Plantingtrees in medians and along streets has been shown to help slow traffic and create safer conditions formotorists and pedestrians. 21 Trees also improve urban residents’ connection with nature.Central Business District Street Tree PlanDover, NH5
In addition to environmental and social benefits, street trees in urban environments provide economicbenefits to individuals and the City. Trees and vegetation increase residential property values by around3 to 10 percent. 22 Studies have shown that customers stay longer at shopping centers with landscaping,thus increasing revenue at local shops. Trees that shade buildings reduce the demand for air conditioningby 30 percent, providing property owners with energy savings, reducing energy demand by 20-50percent, and reducing emissions associated with energy demand. 23, 24 Research has shown that a young,healthy tree can provide a net cooling effect that is equivalent to 10 air conditioning units operating for20 hours a day. 25 In addition to cooling, shading can also slow pavement deterioration, which reducesmaintenance and can extend the life of roadways and other infrastructure. 26Integrating Nature into Context-Specific Urban DesignThe Congress for New Urbanism (CNU) recommends using the rural-urban transect as a tool forintegrating nature into context-specific urban design. This approach emphasizes that the primary role oftrees in the suburban to urban core transect zones is to enhance the habitat of people. CNU notes thatwhile environmental benefits are realized through the urban forest, compared to the natural and ruraltransect zones, the social and economic benefits of trees in urban areas are typically greater than theenvironmental benefits. Secondary benefits include managing stormwater, reducing urban heat island,reducing energy costs, and providing wildlife habitat. In this context, the CBD falls within the core urbanlandscape, or T6 zone, shown in the diagram below, where social and economic benefits are prioritized andmaximized over environmental benefits. In surrounding suburban and rural districts, the reverse may apply.A version of the rural-urban transect diagram with six successional zones from nature to urban core(Source: DPZ, Congress for New Urbanism)CBD Street Tree InventoryA)About the InventoryAn inventory of all street trees in the CBD was conducted from mid-July to mid-September 2020. Thegoal of the inventory was to map the location of street trees and compile information about the species,planting site, and health of each tree. This information will be used to inform future planting andmanagement of street trees within the district.Central Business District Street Tree PlanDover, NH6
The inventory consisted of a multi-step process. First, the Project Team (see inside cover) revieweddata collected in several municipal street tree inventories in the U.S. and assembled an initial list of datato collect on each street tree in the CBD. This attribute list was further refined with input from Citystaff.Next, SRPC built an online survey using ESRI’s Survey123 app. This survey could be readily accessed byvolunteers after downloading the app to a mobile device. Paper surveys were also made available tovolunteers. A copy of the paper survey is included in Appendix A.A comprehensive set of instructions was developed to provide volunteers and staff with informationabout the survey, how to obtain the app, and how to respond to each question. Both the list of surveyquestions and instructions created for the CBD street tree inventory were designed to allow the City toreplicate the inventory in other zoning districts in the future. The CBD Street Tree InventoryInstructions are included in Appendix B.Volunteers were recruited via the City’snewsletter, distribution of a call for volunteersto boards and commissions, and through aposting on NatureGroupie. Over 20 individualsreached out to learn about the inventory.Sixteen volunteers participated in the inventoryand contributed a total of 72.25 volunteerhours. Staff contributed 29.25 hours in the field.After all streets in the CBD had beeninventoried, staff processed and analyzed thedata collected.B)FindingsStreet tree inventory data was collected at atotal of 378 sites within the CBD. Stumps anddead trees comprised nine and three of thesites, respectively, and were not identified byspecies. Eight empty planting sites were found.Figure 2 shows the location of the surveyedtrees along streets in the CBD. The location ofeach tree was obtained using the Survey123geolocate feature, which generally has a fivemeter accuracy, and then edited by SRPC inArcGIS to align with streets.Central Business District Street Tree PlanDover, NHVolunteers submitted a photo of each tree theysurveyed7
Figure 2. Map of trees surveyed during the 2020 CBD inventoryCentral Business District Street Tree PlanDover, NH8
Staff performed a cursory QAQC on some trees that were identified as species that would not typicallybe found in the US Department of Agriculture’s Plant Hardiness Zone 5, which is the zone that Dover islocated in. The result was a list of 44 different species. The most common species were linden, alsoknown as basswood (Tilia americana) and little leaf linden (Tilia cordata), which accounted for a total of 68of the living trees (19%) in the CBD. Norway maple (Acer plantanoides) (13%) followed by green ash(Fraxinus pennsylvanica) (11%) and red maple (Acre rubrum) (9%) were the next most common species.The 12 most prevalent species accounted for 289, or approximately 75%, of all living trees surveyed inthe CBD. The remaining 25% consisted of 29 other species (Figure 3). A complete list of species isincluded in Appendix C.10090Number of Trees80706050403020100Figure 3. Most prevalent street tree species in the CBDThe diameter at breast height (DBH), or diameter of the trunk at approximately 4.5 feet from theground, and the estimated tree height were collected for each tree. As expected, the size of trees in theCBD was variable. The box and whisker plot in Figure 4 shows the average DBH of 18.9 inches(indicated by the “x”), median DBH of 13.5 inches (indicated by the horizontal line in the middle of theshaded area), the interquartile range comprising the middle 50% of data points (indicated by the shadedbox), and the outliers (shown as dots that extend beyond more than 1.5 times the upper (43 inches) andlower (1 inch) quartiles). As shown in Figure 4, there were numerous outliers, indicating that errors mayhave occurred when calculating the DBH or inputting the data.Figure 5 shows the estimated tree height average, median, interquartile range, and outliers. The averagetree height was 34.1 feet and the median height was 30.9 feet. Similar to DBH, it is assumed that outliersmay be due to data collection and inputting errors.Central Business District Street Tree PlanDover, NH9
Q4 85Q3 45Avg 34.1Q4 43Q3 22Avg 18.9Med 13.5Q2 7.5Q1 1Figure 4. Diameter at breast height (DBH) ofstreet trees in the CBD (Q Quartile)Med 30.9Q2 18.2Q1 0.8Figure 5. Height of street trees in the CBD(Q Quartile)Volunteers were asked to rate the overall condition of each tree, as well as provide input on a series ofmaintenance issues. The pie chart in Figure 6 displays the overall condition at each site surveyed. Amajority (58%) of trees were ranked as being in good condition. Over one quarter of trees were in faircondition. The remaining 16% of sites had trees that were in poor condition, were dead or dying, or hadstumps and empty planting sites. Figure 7 displays the overall condition of the trees surveyed by species.Of species with 10 or more trees within the CBD (shown in Figure 2), three species had over 50% ofindividuals ranked as dead or dying, poor, or fair condition: green ash, red oak, and amur maple. Each ofthe 11 American Elm trees were ranked as being in good condition. The geographic distribution of treecondition is shown in the map in Figure 8.Data was collected on eight different categories of maintenance issues, including the presence of injuryor damage; disease or pests; pruning, watering, and mulching needs; sidewalk or curb damage fromroots; overhead utility wires; or adjacent or overhead streetlights. This information may be used by theCity to allocate staff and contractor time to specific maintenance activities as well as prioritize trees thatrequire the attention of professional arborist. Figures 9 and 10 display the findings from the maintenanceneeds data collection. Pruning, watering, and mulching were commonly identified maintenance needs(Figure 9). Forty percent of trees surveyed required pruning, while 37% required water and 29% neededmore mulch. Little vandalism was recorded.Additionally, there were overhead wires above 37% of the trees surveyed and streetlights near 22% ofthe street trees. An affirmative response to the questions on the presence of overhead wires andadjacent or overhead lights does not necessarily mean there is an immediate need for maintenance,rather it indicates the potential for greater pruning needs than a tree that is not located in proximity tothis infrastructure. It also indicates that future replacement trees should be appropriately sized andmaintained to avoid conflicts with utilities.At approximately 16% of surveyed sites, there was evidence of damage to the sidewalk or curb due toroot uplifting. This is an indication that the tree is too large for the street tree pit and available growingCentral Business District Street Tree PlanDover, NH10
space. It may also indicate that the root system of the particular species may not be appropriate giventhe constraints of the site.Seventy-six percent of the trees surveyed were identified as having one to four maintenance needs.Sixteen percent required no maintenance in any of the nine maintenance needs categories (Figure 10)Dead orDying4%Stump orEmpty Pit4%Poor8%Fair26%Good58%Figure 6. Overall condition of sites surveyedOverall Tree Condition of SpeciesNine o
This Plan implements Action Item #45 from the Natural Resources Master Plan Chapter: Maintain and accurate inventory of City tree and develop and urban tree plan that provides tree planting and removal guidelines. Figure 1 shows a map of the CBD and extent of the street tree inventory. Street trees are trees planted
