Transcription
November 2013
DISCLAIMERFORWARD LOOKING STATEMENTS Certain information contained in this presentation, particularly information regarding future economic performance, finances, andexpectations and objectives of management, constitutes forward-looking statements. Forward-looking statements can be identifiedby the fact that they do not relate strictly to historical or current facts and generally contain words such as “believes,” “expects,”“may,” “will,” “should,” “seeks,” “approximately,” “intends,” “plans,” “estimates” or “anticipates” or similar expressions. Our forwardlooking statements are subject to risks and uncertainties, which may cause actual results to differ materially from those projected orimplied by the forward-looking statement. For discussion of some of the important factors that could cause these variations, pleaseread the "Risk Factors" section and elsewhere in the Company’s Annual Report on Form 10-K (File No. 001-35308), filed on May 29,2013 with the U.S. Securities and Exchange Commission. Forward-looking statements contained in this presentation are based on assumptions that we have made in light of ourmanagement’s experience in the industry as well as our perceptions of historical trends, current conditions, expected futuredevelopments and other factors that we believe are appropriate under the circumstances. You should not place undue reliance onforward-looking statements, which speak only as of the date hereof. We do not undertake to update or revise any forward-lookingstatements after they are made, whether as a result of new information, future events, or otherwise, except as required by applicablelaw.USE OF NON-GAAP FINANCIAL MEASURES This presentation includes certain measures presented on a basis other than in accordance with generally accepted accountingprinciples (GAAP), including Income from Operations, as adjusted and Net Income, as adjusted. These amounts are not analternative to GAAP. Management believes that these measures provide investors with transparency by helping to illustrate theunderlying financial and business trends relating to the Company's results of operations and financial condition and comparabilitybetween current and prior periods. Investors are encouraged to review the reconciliation of such measures to the most directlycomparable GAAP term, included as an Appendix to this presentation.2
JET SET LUXURY
INVESTMENT HIGHLIGHTS Global luxury lifestyle brand with compelling growth metrics Design vision led by world-renowned, award-winning designer Poised to take share in growing global accessories product category Proven retail format offers jet-set in-store experience Strong relationships with premier wholesale customers Growing licensing business Experienced management team4
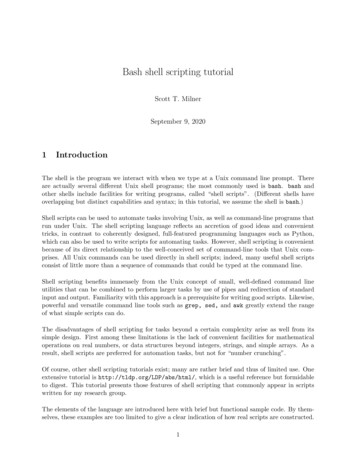
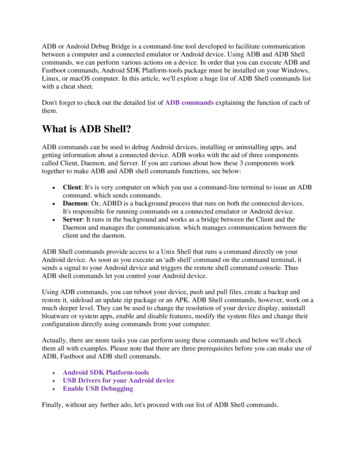
GROWING GLOBAL LUXURY MARKET The global luxury goods market is estimatedto grow from 283 billion in 2012 tobetween 320 billion and 333 billion in2015E (1)―Growth fueled by emerging markets andaccessories Accessories were 27% of total sector sales in2012―Grew by 14% in 2012Worldwide Luxury Goods Market (1)( 20122015E2012 Revenue Split by Category2012 Revenue Split by GeographyOtherRest of WorldArtJapan2%3%Hard Luxury22%27%26%9%Apparel20%Perfumeand Cosmetics5%35%Asia Pacific(Excl. Japan)20%27%31%AccessoriesAmericasSource: Bain & Company Luxury Goods Worldwide Market Study, 11th Edition, October 2012(1) All figures derived from the Luxury Goods Worldwide Market Study are based on an exchange rate of 1.33 to 1.005320 - 333Europe
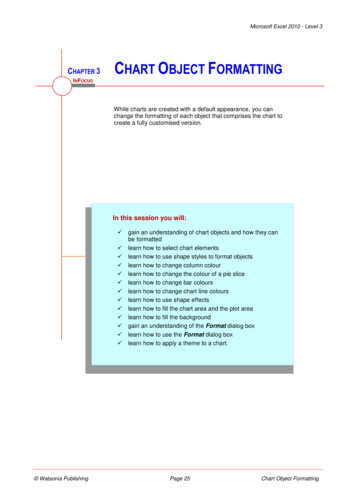
REVENUE BY PRODUCT Accessories and related merchandise accounted for 83% of total net sales during the secondquarter of FY 2014, compared to 79% during the same period last year We expect these products to continue to grow and become an increasingly important driver ofglobal comparable store sales growthProduct MixFY 2014 Q2Women’s Apparel,Men’s Apparel17%83%Accessories andRelated Merchandise (1)(1) Includes handbags, small leather goods, footwear, watches, jewelry, eyewear and fragrances6
MICHAEL KORS COLLECTIONS Introduced in 1981 Introduced in 2004 Reflects the pinnacle of luxury inaccessories, womenswear andmenswear Positioned to address a youngerdemographic in the accessible luxurysegment Cornerstone of Michael Kors semiannual runway shows Focuses on the accessories market Establishes the aesthetic authority of theentire brand7
DESIGN PROCESS Michael Kors leads the overall designdirection of the Company He is actively involved in the designprocess and personally reviews themajority of the Company’s designs A team of 60 designers supportsMichael Kors The Company’s global reputationenables it to attract and retain topdesign talent Product is designed to support retailmerchandising Four collections are produced annually Collections are delivered 12 times peryear8
GROWTH STRATEGIESKey Initiatives Underway Expand North American retail presence Increase global comparable store sales Continue conversion of department store doors into branded shop-in-shopsglobally Develop European retail and wholesale businesses Build out Japanese business Grow other regions in the Far East through regional licenses Establish global ecommerce business to provide true omni channel customerexperience9
RETAIL STORE GROWTH New store growth strategy:– Open new stores predominantly in high-traffic areas and mall locations in high-incomedemographic areas– Adhere to already successful retail store format, which reinforces brand image and generatesstrong sales per square footMichael Kors Retail Store Count (1) by RegionFYE 2011ANorth America(1) Includes 2Q14AEuropeJapanLong-Term Goal
SELECT RETAIL LOCATIONSMADISON AVENUE, NEW YORKREGENT STREET, LONDON
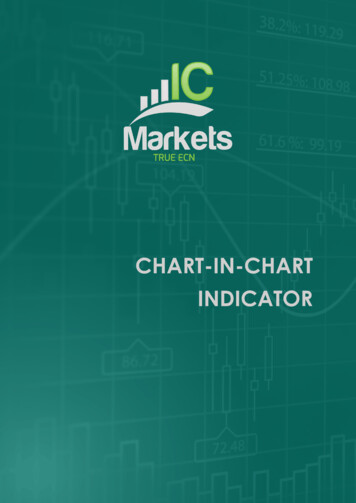
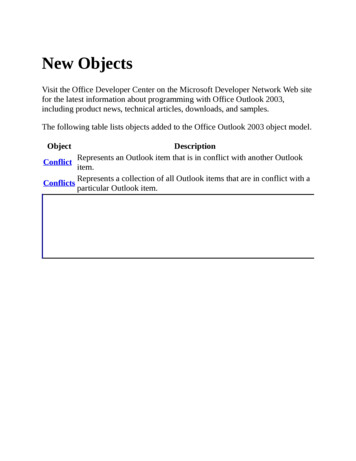
COMPARABLE STORE GROWTH DRIVERS Comparable store sales growth driven by increased traffic as brand awareness continues to grow and ourexpanded product offering attracts a broader customer base.Small Leather GoodsFashion Jewelry Small leather goods shouldcontinue to represent 15% ofretail store sales over the longterm Launched in retail stores in Fall2011, this new productcategory is expected torepresent 5% of retail sales inthe long-termLogo Products Logo handbags, small leathergoods and active footwearshould continue to represent 30% of retail salesPositive Comparable Store Sales Growth for 30 Consecutive QuartersAnnual Comparable Store Sales GrowthQuarterly Comparable Store Sales GrowthFYE MarchFYE 3727191846FY11FY12FY1323
E-COMMERCE Communicate brand image via full product assortment displayed on website–Reinforce the luxury image of Michael Kors–Communicate directly with customers and drive store traffic Transition of e-commerce in-house underway–13Current website operated in partnership with Neiman Marcus (launched in 2007)
WHOLESALE GROWTH INITIATIVES Continue to transform North American department store locations into branded shopin-shops with custom fixtures Expand size of existing department store shop-in-shops Grow wholesale distribution in Europe to 2,000 specialty shop and department storedoors in the long term Expand shop-in-shop footprint at select department stores throughout Europe14
GLOBAL WHOLESALE CUSTOMERSTotal N.A. Doors: 2,294 (1)North AmericaInternational Wholesale Doors: 1,197 (1)Europe(1) Represents full-price department stores and specialty retailers as of September 28, 201315Asia
LICENSING PARTNERSFossil has been the exclusive watch licensee since April 2004 Watches are “must-have" status item among young fashion consumers Brand loyalty among younger customers creates opportunity to leverage success across otherdemographics Price points range from 150 to 500 Fossil has been the exclusive fashion jewelry licensee since December 2010 Jewelry line consists of bracelets, necklaces, rings and earrings that complement watch andaccessory lines Price points range from 45 to 400 Estee Lauder has been the exclusive women’s and men’s fragrance licensee since May 2003 Launched new Michael Kors Fragrance and Beauty Collection in August 2013 Price points range from 20 to 115 Marchon has been the exclusive eyewear licensee since January 2004 Focus on logo / status eyewear Price points range from 85 to 285JewelryWatches FragrancesOpportunity to grow through a select number of licensees who produce brand-enhancing productsacross categories that require specialized expertiseEyewear 16
MANAGEMENT Seasoned management team in the luxury and branded lifestyle sectors with anaverage of over 25 years experience in the retail industry17NameTitleYears in IndustryYears at MKMichael KorsHonorary Chairman, Chief Creative Officer &Director3432John IdolChairman, Chief Executive Officer & Director3110Joe ParsonsExecutive Vice President, Chief Financial Officer,Chief Operating Officer & Treasurer249Anna BakstGroup President – Accessories & Footwear239Jaryn BloomGroup President – Retail278Gia CastrogiovanniGroup President – Women’s Better & Collection279Debra MarglesPresident – Canada288Toshi TashiroPresident – Japan423Cedric WilmottePresident – EMEA155Jill FishmanSVP – Global Licensing198Lee SpornSVP – Business Affairs, General Counsel &Secretary249Britton RussellSVP – Global Operations251
FINANCIAL OVERVIEW
HISTORICAL FINANCIAL SUMMARYTotal RevenueGross ProfitFYE March( Millions)FYE March( Millions)1,3072,1821,3811,302567948803446508267FY 2010 FY 2011 FY 2012 FY 2013 1H FY13 1H FY14FY 2010 FY 2011 FY 2012 FY 2013 1H FY13 1H FY14Margin (%)52.5Adjusted Income from Operations (1)55.557.859.861.3Adjusted Net Income (1)630398163419272166733956FY 2010FY 2011FY 201211.117.020.9(1)2712701371959.9FYE March( Millions)FYE March( Millions)Margin (%)847753FY 2013 1H FY13 1H FY1428.928.530.3FY 2010 FY 2011 FY 2012 FY 2013 1H FY13 1H FY14Margin (%)For Fiscal 2012, amounts are adjusted for certain one-time charges. Please refer to Appendix fornon-GAAP reconciliation.7.79.012.518.217.619.6
REVENUE BY SEGMENT AND REGIONBy Region (1)By SegmentFYE MarchFYE March( Millions)( leFY12FY131H FY13 1H FY14Retail(1) Total revenue as recognized based on country of 2211,6001,0631,4002,18222LicensingFY10FY11North AmericaFY12EuropeFY131H FY13 1H FY14Japan and Other Regions
STRONG FISCAL 2Q 2014 PERFORMANCE2Q 2014 vs. 2Q 2013 Summary FinancialsHighlights( Millions, except per share data)Three Months EndedSeptember 28,September 29,20132012Total Revenue74053339%Gross Profit45031642%61%59% 150 bpsIncome fromOperations22115840%% Margin30%30% 30 bpsNet Income1469849%% Margin20%18% 200 bps 0.71 0.4945%Gross MarginNet Income PerOrdinary Share:Diluted21 Retail– Global comparable store sales growth of 23% drivenby continued strength of accessories line– Opened 24 stores globally during the quarter– Ending store count of 352 Wholesale– Net sales growth of 30%– Continued strong sell-through– Continued conversion of wholesale departmentstore doors into shop-in-shops, resulting inincreased sales volume per door Licensing– Revenue growth of 65% driven by continuedstrength in the company’s luxury watches Gross Margins expanded 150 bps largely due to morefavorable product and geographic mix%Growth/Margin Exp (bps)
STRONG FINANCIAL POSITION Net cash position and strong liquidity New store growth funded from cash flow from operations Capital expenditures to support long-term growth, store openings, shop-inshops, warehouse, corporate and information systems22
INVESTMENT HIGHLIGHTS Global luxury lifestyle brand with compelling growth metrics Design vision led by world-renowned, award-winning designer Poised to take share in growing global accessories product category Proven retail format Strong relationships with premier wholesale customers Growing licensing business Experienced management team23
APPENDIX24
NON-GAAP RECONCILIATION FOR FISCAL 2012Reconciliation of income from operations, as reported, to income from operations, as adjusted( Thousands)Income from operations, as reportedAdd back adjustments for one time charges:Fiscal Year EndedMarch 30,March 31,20132012 630,014 247,682Stock option expense-10,600IPO fees-3,170Employee share option redemption - private placemen-10,690Income from operations, as adjusted 630,014 272,142Use of Non-GAAP Financial MeasuresIn addition to reporting financial results in accordance with generally accepted accounting principles (GAAP), the Company provides non-GAAP operating results that excludecertain charges or credits such as transaction expenses related to the Company's IPO, Stock option expense and other offering fees. These amounts are not in accordance with, oran alternative to, GAAP. The Company's management believes that these measures provide investors with transparency by helping illustrate the underlying financial and businesstrends relating to the Company's results of operations and financial condition and comparability between current and prior periods. Management uses the measures to establish andmonitor budgets and operational goals and to evaluate the performance of the Company.25
NON-GAAP RECONCILIATION FOR FISCAL 2012Reconciliation of net income, as reported, to net income, as adjusted( Thousands)Net income, as reportedFiscal Year EndedMarch 30,March 31,20132012 397,602 147,364Add back adjustments for one time charges:Stock option expense-10,600IPO fees-3,170Employee share option redemption - private placemen-10,690Less tax benefit on above-(8,686)Net income, as adjusted 397,602 163,138201,540,144189,299,197Weighted average ordinary shares outstanding:DilutedUse of Non-GAAP Financial MeasuresIn addition to reporting financial results in accordance with generally accepted accounting principles (GAAP), the Company provides non-GAAP operating results that excludecertain charges or credits such as transaction expenses related to the Company's IPO, Stock option expense and other offering fees. These amounts are not in accordance with, oran alternative to, GAAP. The Company's management believes that these measures provide investors with transparency by helping illustrate the underlying financial and businesstrends relating to the Company's results of operations and financial condition and comparability between current and prior periods. Management uses the measures to establish andmonitor budgets and operational goals and to evaluate the performance of the Company.26
merchandising Four collections are produced annually Collections are delivered 12 times per . Fashion Jewelry . COMPARABLE STORE GROWTH DRIVERS . 12 . FY07 FY08 FY09 FY10 FY11 FY12 FY13 16 . 18 6 . 19 . 48 . . Joe Parsons ; Executive Vice President, Chief Financial Officer, Chief Operating Officer & Treasurer . 24 ; 9 .