Transcription
Bison Versus Cattle: Are They Ecologically Synonymous?Author(s): Michel T. Kohl , Paul R. Krausman , Kyran Kunkel , and David M. WilliamsSource: Rangeland Ecology & Management, 66(6):721-731. 2013.Published By: Society for Range ManagementDOI: http://dx.doi.org/10.2111/REM-D-12-00113.1URL: 113.1BioOne (www.bioone.org) is a nonprofit, online aggregation of core research in the biological, ecological, andenvironmental sciences. BioOne provides a sustainable online platform for over 170 journals and books publishedby nonprofit societies, associations, museums, institutions, and presses.Your use of this PDF, the BioOne Web site, and all posted and associated content indicates your acceptance ofBioOne’s Terms of Use, available at www.bioone.org/page/terms of use.Usage of BioOne content is strictly limited to personal, educational, and non-commercial use. Commercial inquiriesor rights and permissions requests should be directed to the individual publisher as copyright holder.BioOne sees sustainable scholarly publishing as an inherently collaborative enterprise connecting authors, nonprofit publishers, academic institutions, researchlibraries, and research funders in the common goal of maximizing access to critical research.
Rangeland Ecol Manage 66:721–731 November 2013 DOI: 10.2111/REM-D-12-00113.1Bison Versus Cattle: Are They Ecologically Synonymous?Michel T. Kohl,1 Paul R. Krausman,2 Kyran Kunkel,3 and David M. Williams4Authors are 1Boone and Crockett Fellow, Boone and Crockett Program in Wildlife Conservation, University of Montana, Missoula, MT 59812, USA;2Boone and Crockett Professor, Boone and Crockett Program in Wildlife Conservation, University of Montana, Missoula, MT 59812, USA; 3WorldWildlife Fund-Northern Great Plains Program, Bozeman, MT 59715, USA; and 4Assistant Professor, Quantitative Wildlife Laboratory, Department ofFisheries and Wildlife, Michigan State University, East Lansing, MI 48824, USA.AbstractHistorically, the plains bison (Bison bison Linnaeus) was the most numerous and influential grazer on the Great Plains. Today500 000 bison occupy North America among more than 100 000 000 cattle. In an attempt to restore their historical ecologicalrole, bison are translocated onto landscapes previously manipulated for cattle use through water and fence development. Wehypothesized that bison would use these landscapes similarly to cattle, thus maintaining homogenous grazing and reducing therestoration potential of bison at a landscape scale. We quantified differences between bison populations at different locationsand spatial scales (American Prairie Reserve, Malta, Montana, USA, and Grasslands National Park, Val Marie, Saskatchewan,Canada, 2010–2011) and bison and cattle at similar locations and spatial scales using behavioral observations, movementanalyses, and resource selection functions. Bison and cattle differed in all behaviors (grazing, standing, bedded, moving, other);however, landscape attributes resulted in behavior differences within species. Cattle spent a higher proportion of time grazing(45–49%) than bison (26–28%) and increased time at water. Bison moved at a 50–99% faster rate than cattle, and first passagetime movement analyses identified selection of bison foraging patches (11 690 ha) larger than cattle foraging patches (48–615ha). Similar to cattle, bison avoided most vegetation communities in relation to riparian communities and selected areas closerto water. Cattle selected for high plant biomass, whereas bison selected for intermediate plant biomass. This study hasimplications when bison and cattle are used to meet prairie restoration objectives. For bison, large landscapes that includevariation in topography and vegetation communities are required. Furthermore, limiting manmade water sources may facilitatebison grazing patterns that more closely approximate historical bison use. For livestock, reduced movement and increased timespent grazing encourage grazing practices that increase heterogeneous grazing at a pasture scale.Key Words:behavior, first-passage time, grazing, heterogeneity, resource selection, waterINTRODUCTIONThe near extinction and subsequent recovery of plains bison(Bison bison Linnaeus) throughout North America was the firstand greatest conservation success in North America (Sandersonet al. 2008). Today 500 000 bison occupy North Americabecause of the cooperation of private individuals, nonprofitorganizations, and the federal governments of the UnitedStates, Canada, and Mexico. Despite the numerical recovery ofthe species, recent questions have surfaced regarding theecological success of these efforts because fewer than 21 000plains bison are managed as conservation herds (i.e., not forcommercial use; n¼62). Thirteen percent (n¼8) of conservation herds are outside of their historical range, 92% (n¼57)Research was funded by the Alfred P. Sloan Foundation, American Prairie Reserve,Boone and Crockett Wildlife Conservation Program at the University of Montana, M.J. Murdock Charitable Trust, Montana Institute on Ecosystems by the NationalScience Foundation EPSCoR program grant EPS-1101342, Parks Canada–Grasslands National Park, University of Montana, Wildlife Conservation SocietyResearch Fellowship Program, and the World Wildlife Fund–Northern Great PlainsProgram.At the time of research, Kohl was a Boone and Crockett Fellow, Boone and CrockettWildlife Conservation Program, University of Montana, Missoula, MT 59812, USA.Correspondence: Michel Kohl, Dept of Wildland Resources, Utah State University,Logan, UT, 84321, USA. Email: michel.kohl@aggiemail.usu.eduManuscript received 28 August 2012; manuscript accepted 13 August 2013.ª 2013 The Society for Range ManagementRANGELAND ECOLOGY & MANAGEMENT 66(6) November 2013have fewer than 1 000 individuals, and only 8% (n¼5) aremanaged on areas of more than 2 000 km2 (Gates et al. 2010).In comparison, more than 95% of bison are in commercialproduction and are subjected to animal husbandry practices(e.g., altered sex:age ratios, unnatural growth performance,reduced mate competition), which may result in irreversiblechanges to morphology, physiology, and behaviors (Freese et al.2007) that alter their ecological influence on the landscape. Thecollective effect of ecological alterations and issues such asdisease (Aune and Gates 2010) and domestic cattle geneintrogression (Halbert and Derr 2007) can prohibit the mixingof commercial and conservation herds because of differentmanagement and conservation goals. As a result, manyconservation groups and state and federal agencies arequestioning the ecological significance of replacing historicbison populations with domestic cattle at a landscape scale.Historically, bison were the dominant grazer throughout theGreat Plains, affecting vegetation communities through grazing, physical disturbance, nutrient cycling, and seed dispersal(McHugh 1958; Knapp et al. 1999). These activities contributed to grassland heterogeneity that supported many prairieobligate species (e.g., grassland songbirds) in the tall, mixed,and short grass prairie (Fuhlendorf et al. 2006; Powell 2006;Gates et al. 2010). Following the reduction of the bison herds,bison were replaced by domestic cattle, and a significant shiftoccurred, resulting in overgrazing and then rotational grazingregimes. Contemporary range management practices are721
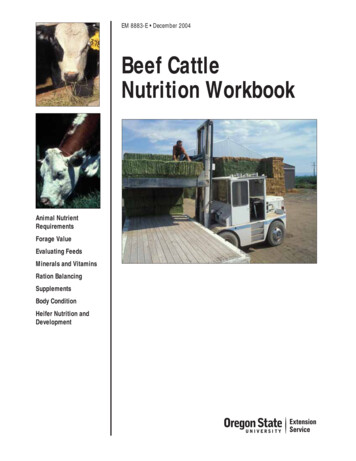
designed to maximize livestock production through crossfencing and uniformly distributed stock reservoirs, effectivelyrescaling the grazing process across the landscape in ahomogenous fashion (Fuhlendorf and Engle 2001; Derner etal. 2009).Today livestock numbers on rangelands in the United Statesand Canada are two times higher than historical bisonestimates,1 yet there are few studies comparing the ecologicalsimilarities between introduced livestock and bison, particularly when managed as wild populations on large, complexlandscapes (Fuhlendorf et al. 2010). Bison and cattle demonstrate fundamental ecological differences in habitat use (vanVuren 1983; Allred et al. 2011), forage use (Peden et al. 1974;Plumb and Dodd 1993; Towne et al. 2005), and behavior(Plumb and Dodd 1993). In addition, water requirements havebeen identified as a major difference between the species ascattle spend more time near water resources and riparian areasthan bison (van Vuren 1983; Fuhlendorf et al. 2010). Inparticular, bison employ distinct travel patterns that includetravel from general use areas (e.g., feeding, bedding) towatering areas where they spend minimal time and then returnto general use areas (McHugh 1958; van Vuren 1979).However, only Allred et al. (2011) have explicitly tested forcattle selection and bison avoidance of riparian areas and watersources at a large spatial scale.Data are available regarding the ecological differencesbetween bison and cattle; however, direct comparisons betweenbison and cattle are difficult because of varying managementpractices (e.g., pasture size, stocking densities, managementpriorities, cattle breed) and confounding environmental factors(Plumb and Dodd 1993; Towne et al. 2005; Fuhlendorf et al.2010). Fuhlendorf et al. (2010) reported nine studies thatcompared bison and cattle with an ecological focus, only twoof which attempted to control for confounding effects. Recentwork on the Tallgrass Prairie Reserve was the third study tocontrol for confounding effects and the first to occur on pastureunits over 300 ha (Allred et al. 2011).Bison translocation efforts are occurring in the NorthernGreat Plains in areas previously manipulated for livestock (i.e.,water development and fence construction). Because thesetranslocation efforts are implemented beside domestic livestockoperations, we were provided opportunities for side-by-sidecomparisons of bison and cattle. Furthermore, with multiplebison populations within the region, we were able to comparepasture attributes used by bison across differing vegetationcommunities and spatial scales. Thus, our objectives were tocompare the behavior, movement, and resource use of bisonand cattle on large pasture units (. 1 000 ha) within theNorthern Great Plains in an effort to make inferences regardingpotential impacts on landscape heterogeneity. For this study,landscape hetero- and homogeneity refers to vegetationstructure and composition at spatial scales of more than1 000 km2. Pasture attributes refer to topographic characteristics, vegetation communities, and management practices. Wehypothesized that pasture attributes would influence thebehaviors (e.g., standing, bedded, grazing, movement, andresource use) of bison and cattle. As such, we predicted bisonand cattle in units with similar pasture attributes would1Fig. S1, available at onstrate comparable behaviors reported in previous studiesof smaller pasture units. We also predicted bison would differin their ecological behaviors (e.g., movement, water use) whenunder different management structures, including pasture sizeand water density.METHODSStudy AreaWe compared bison and cattle in two study areas within thenorthwestern glaciated plain ecoregion (Forrest et al. 2004) ofnorth-central Montana and southwestern Saskatchewan, Canada, in 2010 and 2011 (Fig. 1). In north-central Montana, wecompared bison on the American Prairie Reserve (APR [67%public land]) and cattle on the Barnard Ranch (BR [65% publicland]) and Weiderrick Ranch (WR [100% public land]). TheAPR (lat 47845 0 48 00 N, long 107841 0 43 00 W) is located 74 kmsouth of Malta, Montana, and is adjoined on the east by BR(lat 47843 0 00 00 N, long 107838 0 00 00 W) and west by WR (lat47844 0 11 00 N, long 107851 0 28 00 W). To compare bison acrossspatial scales, vegetation communities, and water availability, asecond bison site was selected 150 km north in GrasslandsNational Park (GNP [Val Marie, Saskatchewan, Canada {lat49809 0 40 00 N, long 107832 0 49 00 W}]).Dominant plant species on APR, BR, and WR arerepresentative of a sagebrush steppe system that includes bluegrama (Bouteloua gracilis Griffiths), needlegrass (Stipa spp.Beauv), crested wheatgrass (Agropyron cristatum Gaertn),silver sagebrush (Artemisia cana Pursch), and Wyoming bigsagebrush (Artemisia tridentata Nutt). Sedges (Carex spp.),cacti, and forb species are also common in the area. Dominantplant species in GNP are representative of the mixed-grassprairie ecosystems and include blue grama, needlegrass,western wheatgrass (Pascopyrum smithii Á Löve), and silversagebrush.Large ungulates on all sites include mule deer (Odocoileushemionus Rafinesque), white-tail deer (O. virginianus Zimmermann), and pronghorn (Antilocapra americana Ord). Elk(Cervus elaphus Linnaeus) are common on all sites exceptGNP. Black-tailed prairie dogs (Cynomys ludovicianus Ord)and coyotes (Canis latrans Say) are common in all areas.Greater sage grouse (Centrocercus urophasianus Bonaparte),Baird’s sparrows (Ammodramus bairdii Audubon), and mountain plover (Charadrius montanus Townsend) are grasslandbird species of conservation concern found throughout theregion.The APR, BR, and WR lie in a semiarid region consisting ofupland flats intersected by coulees and ephemeral streamsflowing toward the Missouri River. Yearly precipitation rangesfrom 25.4–27.9 cm; however, 2010 and 2011 were 1.5–2.0greater than the annual average (45.6 and 57.1 cm, respectively). Mean annual temperature is 6.58C and ranges from 8.48Cin January to 20.88C in July. Elevation ranges from 700 to 825m. Soil primarily contains heavy clay loams with moderateamounts of salt resulting in high impermeability by water.Thus, most water developments remain full throughout theyear.The GNP also lies in a semiarid region and consists of similartopographic features as listed above. The Frenchman RiverRangeland Ecology & Management
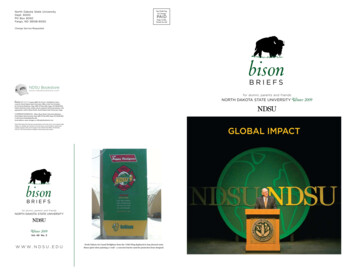
runs through the southern section of the park with consistent,regulated flow throughout the year. Annual precipitationranges from 30 to 33 cm; however, 2010 and 2011 were 1.4–2.0 times greater than average (46.5 and 53.1 cm, respectively).Mean annual temperature is 3.48C and ranges from 13.48C inJanuary to 18.88C in July. Elevation ranges from 750 to 900 m.Bison on APR (n¼147 in and 215 in 2010 and 2011,respectively) were contained within a 3 555 ha electrifiedpasture unit from 1 May through 31 October of each year (Fig.1). The pasture contains 15 manmade reservoirs and anephemeral stream that maintained small remnant pools duringthe study. Reynolds Hill Road passes through the easternsection of the APR, receiving low to moderate levels ( 30vehicles d 1) of use throughout the summer with heavier use( 250 vehicles d 1) during hunting season (1 September–25November). Bison on GNP (n¼147 and 195 in 2010 and 2011,respectively) were contained within an 18 153 ha pasture unitcontaining 26 reservoirs (Fig. 1); however, bison typically usedonly the northeast portion of the park during summer ( 4 200ha). This summer area contained five manmade reservoirs(three of which were permanent throughout summer), one largedepression, and three ephemeral channels that containedremnant pools during the study. In addition to reservoirs, theFrenchman River provides water throughout the year, exceptwhen frozen. The main ecotour road passes through the centerof the park ( 6 000 visitors yr 1) from north to south andreceives low to moderate levels of use throughout the summer,but recreational use is rare in the core summer range.The WR grazed 100 cow/calf pairs (red and black Angus)from 1 July to 15 October on 2 rotational pastures (1 090 and1 408 ha), that contained 5 to 7 reservoirs per pasture (Fig. 1).The BR grazed 140 cow/calf pairs (Hereford and red Angus)on two rotational pastures (777 and 1 000 ha) that contained6–8 reservoirs per pasture. The west BR pasture was bisectedby Reynolds Hill Road. Stocking density was similar acrossAPR and WR cattle pasture units but differed from BR pastureunits (Table 1).Figure 1. Location of bison and cattle study sites. Bison herds werelocated at American Prairie Reserve (APR; diamond) and GrasslandsNational Park (GNP; star). Two cattle herds are located in pastures adjacentto APR bison herd. White identifies man-made stock reservoirs andremnant pools within ephemeral streams. Dashed line identifies mainecotour route through GNP. Sites at APR are located 74 km south of Malta,MT, USA, and GNP is located 20 km southeast of Val Marie, SK, Canada.GPS Data CollectionWe deployed Global Positioning System (GPS) radiocollars(Lotek 3300, Lotek 4400, Lotek Wireless Fish and WildlifeMonitoring, Newmarket, Ontario, Canada and NSG-LD2,North Star Science and Technology, LLC, King George,Virginia, USA) on adult female bison and cattle.2 Bison wereimmobilized (A3080 and Xylazine; reversed with Naltrexone,or a mixture of Butorphanol-Azaperone-Medetomidine[BAM]; reversed with Naltrexone, Atipamezole and Tolazine,K. Kunkel, American Prairie Reserve, personal communication) by air-powered darts (Pneu-Dart, Williamsport, PA) firedfrom the ground. Cattle were physically restrained in asqueeze chute. Sixteen animals were instrumented in the study(n¼2 on APR, n¼4 on GNP, n¼5 on BR, n¼5 on WR), ofwhich five individuals remained collared throughout theduration of the study (n¼2 on APR, n¼3 on GNP). Collarswere scheduled to obtain locations every 1, 2, or 3 hr fromcollar deployment (1 June–9 July) till 31 August (or untilcollar failure) in 2010 and 2011.3 The GPS locations were2366(6) November 2013Fig. S2, available at http://dx.doi.org/10.2111/REM-D-12-00113.s2Table S1, available at http://dx.doi.org/10.2111/REM-D-12-00113.s3723
Table 1. Description of grazing pastures and stocking densities for animalsowned by American Prairie Reserve (APR), Parks Canada (PC), WeiderrickRanch (WR), and Barnard Ranch (BR). Analysis was performed on annualbison range (Park) and within summer home range (NE Corner) inGrasslands National Park (GNP). The GNP is located 20 km southeast ofVal Marie, SK, Canada, and other sites are located 74 km south of Malta,Montana, USA.SpeciesBisonOwnerAPRPCCattleWRBRPasture nameAPRYearAUM/ha20100.2520110.18GNP—Park Wide20100.1120110.14GNP—NE 10.16East20100.36West20110.4920110.39censored from analysis when APR bison moved outside of thedesignated pasture unit. This research was approved by theUniversity of Montana Animal Care and Use Board (AnimalUse Protocol No. 014-10PKWB) and Parks Canada (PermitNo. GRA-2010-5415).Landscape VariablesAbiotic variables (e.g., aspect, slope, and elevation) weredeveloped from the 30330 m Montana Digital ElevationModel and 15315 m Canadian Digital Elevation Model.Biotic variables included vegetation community and 2503250m Normalized Difference Vegetation Index data (NDVI[Moderate Resolution Imagine Spectroradiometer {Huete etal. 2002}]). Vegetation classifications on GNP were based onfield work completed by ground sampling (R. Sissons, GNP,unpublished data). Landcover type was classified on APR, BR,and WR using remotely sensed data and was designed to allowfor comparison between vegetation communities on GNP. Wedelineated 10 vegetation communities (eroded, upland grassland, disturbed, sloped grassland, riparian, valley grassland,treed, unclassified, sage-brush, and water bodies).4 We used adynamic measure of vegetation productivity by estimatingprimary productivity from midmonth NDVI estimates (Tuckerand Sellers 1986). We analyzed anthropogenic variables usingEuclidean distance estimates (km) for fence, water, and roads.We located permanent water sources using BLM (Malta FieldOffice, Malta, MT, USA) and Parks Canada (GNP Headquarters, Val Marie, Canada) topographic maps. We inspectedwater developments monthly to confirm water availabilitythroughout summer. Additional water sources (e.g., hardpans,rainfall, drainages) are ephemeral pools (, 1 wk); thus weassumed they were homogenous throughout the pasture units4Table S2, available at http://dx.doi.org/10.2111/REM-D-12-00113.s4724and did not influence overall movement patterns of bison andcattle relative to permanent water sources.BehaviorWe conducted behavior observations of bison and cattle nearsemipermanent (, 3 mo) to permanent water sources toquantify the use of water by both species, and thus relateresource selection (see below) to water requirements. Thedistinct differences in use of watering areas by bison and cattle(van Vuren 1983; Fuhlendorf et al. 2010) allowed forinferences on the impact of variable water densities onlandscape use by bison and the overall requirement of waterby bison relative to cattle. Thus, we predicted time spentwatering would differ between species (i.e., cattle . bison).We also predicted differences in time spent watering acrossbison sites (i.e., GNP . APR) due to GNP’s decreased wateravailability in the northeast corner of the park, thus imitatinga more historical water density.Opportunistic behavioral observations were also recordedwhen groups of individuals were 25 m from water (25–1027m). We assumed that at distances over 25 m, animals had notwatered recently, and thus would make directed movementswhen watering was required. Observations ( 4 hr) occurredduring daylight hours twice per day for one week per monthper study group from 22 May–23 August 2010 and 2011. Wewere unable to collect observation data and watering eventsfor 1.5 mo on the BR in 2010 due to the grazing rotationschedule and access was limited to WR in 2010 and 2011 dueto weather conditions. This resulted in 87 behavioralobservations (n¼34 on APR, n¼29 on GNP, n¼18 on BR,n¼6 on WR) spanning 155.3 hr and 544 watering events (i.e.,the start of an adult animal drinking water), across all studyareas (n¼200 on APR, n¼185 on GNP, n¼119 on BR, n¼40on WR). Prewatering behavior of mixed groups (female, calf,and subadult males) was determined using instantaneous scansampling (Altmann 1974) from distances over 100 m (Komerset al. 1992) and pooled across individuals within the samplingunit. A sampling unit consisted of a group of more than 2animals separated from other groups by more than 100 m(range¼2–224; median¼38 [Fortin et al. 2003]) with multiplegroups being observed concurrently if visible. Prior towatering events, behavior (grazing, standing, bedded, moving,other) of all individuals was recorded at 15 min intervals(Plumb and Dodd 1993). During the observation periods,individuals were also observed continuously for instances ofwatering events. When an individual animal began watering,the observation period (instantaneous scan samples) for allindividuals ceased, and weather data (temperature, cloudcover, wind speed) and time spent at water (i.e., time inminutes from initial drinking activity to time when animalwas more than one body length from water source) for eachwatering individual was recorded.We calculated proportional differences in ecologicallysignificant behaviors (i.e. moving, grazing). We used a v2 testto quantify whether behaviors differed among and withinspecies. We used ANOVA to compare time spent at waterbetween species and study locations. Lastly, a multipleanalysis of variance (MANOVA) was used to calculate theinfluence of temperature on time spent at water. StatisticalRangeland Ecology & Management
analyses were conducted using the Rcmdr package in R 2.15.1(Fox 2005).MovementWe predicted bison movement rates (MR), calculated fromGPS data as distance (d) in meters (step length) divided bytime (t) in seconds (fix interval), would be larger than those ofcattle on pasture units of similar attributes due to increasedresource (i.e., water) requirements by cattle. This would beexpected if cattle were unable to travel large distances fromwater when physiologically constrained by higher summertemperatures and, thus, resulting in circular movementswithin a given radius of a watering source. In contrast, weexpected bison to make linear movements away from watersources, which would result in greater movement rates. Wealso predicted bison on APR would demonstrate slower MRthan bison on GNP due to reduced pasture units (i.e., fenceconstruction). This would be expected if long-distancemovements were inhibited by fence construction, thusdecreasing the total distance traveled relative to a fix-interval.Movement rates had a non-normal distribution; thus we useda negative binomial regression to test this hypothesis.Analyses were performed in R 2.15.1 using the MASS package(Venables and Ripley 2002).We used the first passage time (FPT) analyses to measure thesearch effort along a pathway (Fauchald and Tveraa 2003) toidentify the spatiotemporal scale of biologically relevantmovements (Turchin 1998; Morales et al. 2005). Specifically,FPT incorporates step length, turning angles, and tortuosity(Fauchald and Tveraa 2003) to estimate the spatial scale atwhich the consumer perceives a resource. Variance in FPT,calculated by the time it takes an animal to travel across acircle of a specified radius (Fauchald and Tveraa 2003), allowsecologists to distinguish area-restricted search behaviors frommovement behaviors between patches.FPT analyses were conducted in the adehabitatLT packageof R 2.15.1 (Calenge 2006). Circles of radii between 50 and15 000 m, increasing at 25 m increments, were applied to eachGPS location along an individual movement path for bisonand cattle. Location data were used from the focal samplingperiod (June–August 2010 and 2011) except for APR bison in2011. The omission of 2011 data for APR bison was due totemporary bison movements outside of the designated pastureunit, which necessitated data censoring and resulted in aninadequate sample size for FPT analysis. For each GPSlocation along an individual movement path, we calculatedthe time spent moving along the path within a circle of a givenradius. Where those circles intersected the movement path, wedetermined passage time of the resulting segment assumingconstant rates of travel along interlocation steps. First passagetimes were not calculated in instances of missed locationswhich created breaks along the path (Williams et al. 2012).We evaluated the variation in passage time along eachmovement path using circles with radii ranging from 50 to15 000 m at 25 m increments. Variation in FPT at each scale(circle radius) indicates the degree that movements areaggregated along the path. Because variation in FPT isexpected to increase with increasing circle radii, variance inFPT was divided by the area of the circle (Frair et al. 2005;66(6) November 2013Williams et al. 2012) as a function of scale (circle radii), thusproviding an indicator of the landscape scales to whichindividuals are responding for the summers of 2010 and 2011.Resource SelectionWe used a resource selection function (RSF) framework tocompare resource use of bison and cattle during summer (1June–31 August; Manly et al. 2002). Our specified covariateswere vegetation community, water availability, and additionalabiotic (elevation, aspect, slope), biotic (NDVI), and anthropogenic covariates (distance to roads, distance to fence)identified in previous bison and cattle resource selectionstudies. Because RSFs assume independence among observations (Hosmer and Lemeshow 2000), we used generalizedlinear mixed-models (GLMM) with a random-intercept forindividual to allow for interpretation of selection amongdifferent populations and species (Hebblewhite et al. 2008;Bolker et al. 2009), thus accounting for temporal and spatialautocorrelation among individuals and groups (Breslow andClayton 1993) and correcting for unbalanced number oflocations among individuals (Bennington and Thayne 1994).Furthermore, data were pooled by month for each animal(i.e., Animal1 June2010, Animal2 June2010, Animal1July2010, etc.) to provide a population estimate across thesummer months while taking into account changing availability in our dynamic measure of vegetation productivity,NDVI.We estimated RSFs at the third order scale (Johnson 1980)on APR, GNP, and cattle ranches. On APR and cattlepastures, we randomly sampled monthly availability(n¼1 000) across individual months within a given pasturefor bison and cattle. In GNP we randomly sampled monthlyavailability (n¼1 000) within a 95% fixed kernel monthlyhome range (third order) using Geospatial Modeling Environment 6.0 (Beyer 2012). In GNP, we also estimated RSFs ata constrained second order scale (i.e., pasture unit) byrandomly sampling monthly availability (n¼2 000) acrossthe entire park to understand whether resource selectiondiffered across spatial scales in GNP. We define this asconstrained second order resource selection because the areais used throughout the year; however, we cannot explicitlystate whether this area would encompass the bison’s annualpopulation range if no peripheral fence existed. A GLMM wasestimated using the lme4 package (Bates et al. 2011) for R2.15.1 and included our covariates (described above). Forcategorical covariates, we selected riparian communities asthe reference category for vegetation due to previousrelationships between riparian communities and bison andcattle reported in the literature. East-facing slopes wereselected as a reference category in relation to other cardinaldirections because of perceived heat exposure. We assumedthat north-facing slopes were cooler, and west- and southfacing slopes were warmer than east-facing slopes, thusinfluencing the selection of aspect. All variables were screenedfor collinearity by calculating the Pearson’s correlationbetween variables and using r . 0.6 as the threshold forremoving a covariate (Hosmer and Lemeshow 2000). Becauseanalysis coefficients are relative to all other model variables,725
Table 2. Chi-square comparison of bison and cattle behavior across and within species. Behavioral activities were observed from 23 May to 31 August(2010, 2011) of bison on American Prairie Reserve (APR) and Grasslands National Park
Bison moved at a 50-99% faster rate than cattle, and first passage time movement analyses identified selection of bison foraging patches (11690 ha) larger than cattle foraging patches (48-615 . November 2013 721. designed to maximize livestock production through cross- . Greater sage grouse (Centrocercus urophasianus Bonaparte), Baird .