Transcription
Pacific EducationalResearch Journal2017VOLUME 16NUMBER 1Sponsored byHawai i Educational Research Association
Pacific EducationalResearch JournalVolume 16 Number 12017The Pacific Educational Research Journal is published every two years andfeatures theoretical, empirical, and applied research with implications for andrelevance to education in the Pacific area.EditorThanh Truc T. Nguyen, University of Hawai‘iat MānoaAssociate EditorKathleen F. Berg, University of Hawai‘i at MānoaEditorial Advisory BoardJames Campbell, St. John’s University (ret.)Mark D. Gall, University of OregonCelia S. Genishi, Columbia UniversityKenji Hakuta, Stanford UniversityMorris Lai, University of Hawai‘i at MānoaValerie O. Pang, San Diego State UniversitySamuel S. Peng, National Center for EducationalStatisticsContributing EditorsPaul R. Brandon, University of Hawai‘i at MānoaThomas Christ, University of BridgeportMartha Crosby, University of Hawai‘i at MānoaRussell K. Endo, University of ColoradoAnne R. Freese, University of Hawai‘i at MānoaM.D. Gall, Oregon UniversityWilliam Greene, Southern Oregon UniversityA. Lin Goodwin, Columbia UniversityEarl S. Hishinuma, University of Hawai‘i atMānoaAlice J. Kawakami, University of Hawai‘i atMānoaMargaret J. Maaka, University of Hawai‘i atMānoaMichael Scriven, Claremont Graduate SchoolChristine Sleeter, California State University atKatherine Ratliffe, University of Hawai‘i atLois A. Yamauchi, University of Hawai‘i at MānoaDonald B. Young, University of Hawai‘i at MānoaRichard C. Seder, Emergent Policy & SystemsAlan R. Shoho, University of Texas at San AntonioKatherine A. Tibbetts, Kamehameha SchoolsMonterey BayMānoaSponsored by Hawai‘i Educational Research Association
Copyright 2017 by the Hawai‘i Educational Research Association.Permission to reprint tables, figures, or more than 500 words of text mustbe obtained from the Association by writing to HERA, c/o Department ofEducational Psychology, University of Hawai‘i at Mānoa, 1776 UniversityAvenue, Honolulu, HI 96822-2463.ISSN 2471-9471 (Print)ISSN 2471-948X (Online)Artist Byron Inouye created the journal logo. He combined Asian andPacific themes using a design element to create a lotus blossom. The wavingpages beneath the blossom symbolize academic scholarship and also call forththe Pacific Ocean. The opening lotus is symbolic of new knowledge and insightsresulting from research.The Pacific Educational Research Journal is printed on request and for a feeby Marketing and Publication Services (MaPS) of the Curriculum Research &Development Group, College of Education, University of Hawai‘i at Mānoa.
Pacific Educational Research JournalContentsPredicting Overweight and Obesity Using theObesity Quotient on Hawai‘i Clinical DataRaul Rudoy, Jerry Michael Brennan, and Peter DunnRankin9Success Factors for Marshallese Students at a LocalCommunity CollegeCarsten Schmidtke19Predicting School Effectiveness from Teachers’Perceptions of Their Elementary SchoolPrincipal’s Instructional LeadershipPhilip A. Griswold and Dyana Ontai-Machado55
Pacific Educational Research JournalEditor’s NotesAs the issue during the 40th Anniversary of the Hawai‘i EducationalResearch Association, we are privileged to feature an article from one of ourfounders Peter Dunn-Rankin and his colleagues, who have been workingsteadfastly on the work in this article for at least six years. With great concernon children’s health in the early years and the evidence that a child who is obeseat age 5 will likely remain obese, Rudoy, Brennan, and Dunn-Rankin sharewith the education research community work that they have been doing inthe medical and health field looking closely at children’s health during the firstyear and a half. They specifically analyze Hawai‘i Clinical Data and provide apredictive model of obesity in children. In the second article, Schmidtke looksat the success factors of Marshallese students rather than the structural problemsthat may surround them. Finding that family influence and support are majorfactors in their community college success, the article contributes to the limitedstudies available on Pacific island student success at the community college level.The final article looks at a different set of players in the educational community,the leadership. Griswold and Ontai-Machado turn their lens on leadershipattributes on school principals, and they suggest that there may be importantvalue in teachers’ recognition of principal behaviors for improvement to occur.The three articles address three different areas and three differentpopulations of educational research. From looking at issues of health andobesity in children to how success of students can be nurtured from elementaryschool to post-secondary education, all are about the penultimate goal ofproviding for positive programs and learning experiences. We hope the articlesare useful to you.Thanh Trúc T. Nguyễn
Pacific Educational Research Journal2017, Vol. 16, No. 1 pp.9–18Predicting Overweight and Obesity Using theObesity Quotient on Hawai‘i Clinical DataRaul RudoyUniveresity of Hawai‘iJerry Michael BrennanIndependent PracticePeter Dunn-RankinUniveresity of Hawai‘i at MānoaRapid growth in early infancy has been associated with an increased risk of obesity after fiveyears of age. It is the objective of this paper to establish the relationship between body mass inthe age interval of ½ year to 1½ years of age and average body mass in the intervals 3-4 and4-5 years of age. This involved a Retrospective study of children attending a large network ofprivate health clinics in Hawaii. Data for 1417 term infants followed from birth to five yearsof age was included. The children’s weight variation from normal was determined using theobesity quotient (OQ) (Dunn-Rankin et.al. 2014). OQ is the Child’s BMI divided by theWorld Health Organization (WHO) Median BMI for that age in days. The relationshipsbetween variables were analyzed using linear regression. A significant and substantialrelationship was found between the last OQ in the early age interval (180-540 days) andthe average OQ at 3-4 and 4-5 years of age, r .57. It is concluded that an examination of theobesity quotient over the first year and a half of life can provide information on the probabilityof overweight and obesity at age 5.9
Raul Rudoy, Jerry Michael Brennan, Peter Dunn-RankinCunningham and others (2014) concluded that overweight five-year-oldswere four times as likely as normal weight children to become obese. Theresearcher’s results are convincing and alarming because a child who is obeseat age 5 will have a tendency to remain that way. The United States is facinga childhood obesity epidemic. The number of overweight/obese preschoolchildren has doubled during the last 20 years (Ogden, et al., 2010). Childhoodobesity has detrimental health consequences. The earlier one can predict obesitythe greater the chance that intervention can be successful. Preventing childhoodoverweight is crucial to the future health of any nation. It is important thereforeto be able to infer later overweight and obesity at an age early enough forremediation or recovery to occur.The authors have previously described the OQ as a simpler and more stableindex for understanding the weight status of young children than the BMI(Dunn-Rankin, P., Rudoy, R. and Brennan J. 2014). The method utilizes theWorld Health Organization (WHO) tables (2009) for height and weight byage and sex to calculate the child’s OQ. For example if the body mass index(BMI) of a 1-year-old boy is 18.1 and the WHO criterion (the median BMIfor a one year old boy) is 16.80 the obesity quotient is 18.1/16.80 or 1.08.Unlike the BMI itself the 1.08 OQ is easily interpreted as eight percent abovethe WHO average. The value of the OQ lies in the comparison it makes witha recognizable criterion, the WHO population of infants. Values of the BMIare quite arbitrary and not reasonable when applied to varied growth rates ofchildren. A BMI of 21 or 22 might be normal for an adult but would be in theObese category for infants.Table 1 illustrates the relationship of the obesity quotient to standardizedz scores and their associated WHO percentiles. Any OQ greater than or equalto 1.18 is 18% or more above the WHO average. From the point of view of theWHO this value is at the threshold of obesity and is two standard deviationsabove the mean with a percentile value of 98. An OQ of 1.08 is at the 84thpercentile and one standard deviation above the mean. Values greater than orequal to 1.08 but less than 1.18 are seen as overweight. The authors have createda web site (www.obesityquotient.com) containing a computer program whichcalculates OQ values given the date of birth, sex, date of measurement andheight and weight.10
Predicting Overweight and Obesity Using the Obesity Quotient on Hawai‘ i Clinical DataTable 1.Distribution of Infant (0–5 yrs) Obesity Quotient’s (OQ) Based on the WHO Criterion,OQ BMI/Md BMI.11
Raul Rudoy, Jerry Michael Brennan, Peter Dunn-RankinMethodsSampleRetrospective electronic data was obtained from 12 private pediatrician’sclinics in Hawaii attended mostly by middle-class patients. The populationconsisted of 1531 males and females born at full term and followed from birthto five years of age. After correcting for measurement errors, generally due toerrors in the entry of height and deleting records with Obesity Quotients (OQ)greater than 1.50 (Okihiro, 2014), 1417 cases remained, a loss of 5 percent.The study period was from 2001 to 2013. The data set contained informationregarding the age, height, weight, sex, ethnicity and number of visits for each ofthe infants. Age was measured in days. For each child on each visit the BMI wascalculated and compared with the WHO median BMI criterion for their agein days. This resulted in an OQ value for each of the 17,131 visits. The projectwas determined to be exempt from institutional review board approval prior toreview and analysis of the data.Initial ResultsA plotting of each of 17,131 obesity quotients, one for each clinical visit,and age in days is shown in Figure 1. The correlation between OQ and age is0.25. This indicates a general trend toward increased body mass from birthto five years of age. The average OQ is 1.03. The variation in OQ values isgreater within the first two months of life when visits are the most frequent.(The standard deviation for the first 200 days is 0.104). The lowest standarddeviations were found for OQ scores between 200 and 600 days in age(SD 0.098). The low degree of variation in the distribution in this time periodsuggests that eliminating very early OQ measurements may enhance predictionof body mass at 5 years of age.Remediation in ObesityEvaluation of OQ mean values at ages 4 to 5 revealed that 115 children(8%, of the 1417 study population) were in the obese range (as suggested bythe World Health Organization. See Table 1). Table 2 provides the probabilityof obesity in 5 years given a specific OQ score (the last value in the interval180-540 days, for example). If the last OQ in the interval is 1.25 or greater, 100percent of the sample values ended up being obese at five years of age. If the12
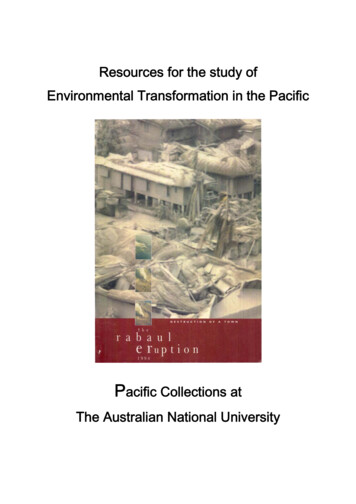
Predicting Overweight and Obesity Using the Obesity Quotient on Hawai‘ i Clinical DataOQ value is lower, at the threshold of obesity (1.18), 50 infants of the 1417are selected by the criterion and 22 of the 50 or 44 percent became obese. Thesmaller the qualifying OQ score the larger the number of infants sampled andthe smaller the percentage of obese at 5 years of age.Figure 1. Dispersion of 17,131 obesity quotients (OQ) over the first five years of life. R .25.Regression ProfilesIf one compares an OQ of 1.24 with values generated in Table 2 it suggeststhe probability of obesity at 5 years of age is between 85 and 100 %. In thecase of infant 803 however, the five year OQ average was in the normal range.An examination of the individual linear regression values of the children witha predisposition towards obesity who did not become obese reveals that themajority 61% of the group of children who started out with an acceleratedgrowth toward obesity regressed toward normality, usually during the secondto third year of life. (See Figure 2 for a typical example). Note the upward slopein the first year of life and the downward slope in succeeding years results in anaverage correlation of this group between age and OQ of R 0.03.13
Raul Rudoy, Jerry Michael Brennan, Peter Dunn-RankinTable 2Interval OQ and Obese Probability.14
Predicting Overweight and Obesity Using the Obesity Quotient on Hawai‘ i Clinical DataThe raw data for infant 803 is provided below:Table 3Raw Data for Infant 803. An Example of an Error in Prediction.[figure 2 here]Figure 2. A child showing early signs of obesity and then remediation15
Raul Rudoy, Jerry Michael Brennan, Peter Dunn-RankinPredicting ObesityA profile examination of each infant in the disposition toward obesity groupreveals the difficulty of using early slopes as predictors. If the slope between ageand OQ in the first year of life is used as a predictor of obesity, such acceleratedgrowth is likely to change. A more effective estimator of body mass and bodymass growth is an OQ within an early interval of life. The growth variation inthe first few months of life further suggests that it is best to begin the intervalat 180 days after birth and extend to 540 days (see Okihiro, et al. for otherintervals). The regression plot comparing the last OQ scores in the interval earlyin life (180-540 days) with the average OQ score during the fourth and fifthyears is presented in Figure 3. The authors have compared the average OQ inthe interval with the last value in the interval and found the correlation resultsto be essentially the same. Using a single score is easier to handle than finding anaverage. The single value criterion lends itself to simplicity and usefulness.Figure 3. The regression plot comparing the average OQ scores in the interval early in life (180540 days) with the average OQ score during the fourth and fifth year, for 1453 infants. r .5716
Predicting Overweight and Obesity Using the Obesity Quotient on Hawai‘ i Clinical DataDiscussionThe correlation represented in Figure 3 (r .57) suggests that beingoverweight early in life may lead to overweight or obesity later on. Perfectprediction is not possible with this data as it is very likely that many parents andpediatricians became aware of overweight and obesity in these infants at a youngage and acted to correct the problem. In spite of this probable remediation thecorrelation was significant and may still be useful in prediction of excessiveweight gains.The utility of the obesity quotient depends on being able to use themedian BMI directly from the WHO data tables. The WHO distributiononly applies to the first five years of an infant’s life. A computer programavailable at obesityquotient.com has been written so that the OQ value foreach appointment can be easily obtained by comparing the calculated BMIagainst the WHO median values for ages 0 to 5 years. Other median BMIdata are available for older children and is in the process of being added to thecalculations used on the website.In Figure 3 the correlation is .57 indicating that over 30% of the variance inthe 4-5 year average OQ can be attributed to the average OQ during the first180-540 days of life. This means that if a child is overweight during this yearlyinterval there is an indication they may be overweight at the end of five years.This correlation of .57 is substantial when one considers that other variablessuch as socioeconomic status, ethnicity, sex, prenatal care, accurate gestationalage, etc. are not included. Dubois, L and Girard, M (2006) offer other usefulpredictors of obesity not included such as maternal smoking, and overweightparents. The criterion for obesity is an OQ greater than 1.18. In the presentstudy ethnic data and sex classification were available. Differences in weight dueto sex were not significant. More than 1/3 of this study’s subjects were Asian.When one looks at ethnicity the frequency of obesity in Haw-Pac infants isalmost twice that of Asians and Caucasians, and could contribute as a predictor.There is also an indication in this study that an increased number of clinicalvisits is related to less obesity in infants. The average number of visits in thepopulation is 11.8 per infant. Infants who have an extended number of visitswith their pediatrician, 17 or more visits per child, have a small probability ofbeing obese. There are 47 children with 17 or more visits over five years. It turnsout that only one infant with an obesity quotient greater than 1.18 can be foundamong 47 possible candidates or about 2%.17
Raul Rudoy, Jerry Michael Brennan, Peter Dunn-RankinReferencesCunningham, S. A., Kramer, M. R., & Narayan, K. V. (2014). Incidence ofchildhood obesity in the United States. New England Journal of Medicine,370(5), 403–411.Ogden, C. L., Carroll, M. D., Curtin, L. R., Lamb, M. M., & Flegal, K. M.(2010). Prevalence of high body mass index in US children and adolescents,2007-2008. The Journal of the American Medical Association, 303(3),242–249.Dubois, L., & Girard, M. (2006). Early determinants of overweight at 4.5 yearsin a population-based longitudinal study. International Journal of Obesity,30(4), 610–617.Dunn-Rankin, P., Rudoy, R., & Brennan, J. M. (2015). The Obesity Quotient:A New Tool to Measure Childhood Obesity. Clinical Pediatrics, 54(5),484–486.Dunn-Rankin, P, Rudoy, R. Brennan, J. M.and K. Kaneta. (2013). Predictingobesity in infants: a new index. Paper presented at the 35th Annual HawaiiEducational Research Association Conference, Honolulu, HI.Grummer-Strawn, L. M., Reinold, C. M., Krebs, N. F., & Centers forDisease Control and Prevention (CDC). (2010). Use of World HealthOrganization and CDC growth charts for children aged 0-59 months in theUnited States. Morbidity and Mortality Weekly Report, 59(RR-9), 1–15.Okihiro, M., Davis, J., White, L., & Derauf, C. (2012). Rapid growth from12 to 23 months of life predicts obesity in a population of Pacific islandchildren. Ethnicity & Disease, 22(4), 439–444.Straub Clinic and Hospital Electronic Medical Records. (2012). Honolulu, HI.World Health Organization. (2006). Global database on body mass index.Retrieved from http://www.who.int/bmi/index.jsp.18
Pacific Educational Research Journal2017 Vol. 16, No. 1 pp. 19–54Success Factors for Marshallese Students at aLocal Community CollegeCarsten SchmidtkeUniversity of ArkansasFew Marshallese high school graduates choose to attend college, preferring to enter theworkforce directly out of high school. The purpose of this study was to describe and analyzethe educational experiences of Marshallese students at one local community college as theyrelate to educational success. Rather than once more focus on structural problems that havebeen documented in the literature on Pacific Islanders, this study wanted to look at whatworks instead and learn from student successes. Semi-structured interviews in a pragmaticqualitative design were used to elicit student’s perceptions of their success factors. Participantsidentified family influence and support as the major factor in their decision to attend collegeand their ability to be successful. Recommendations include that colleges serving Marshallesestudents consider testing and possibly adopting and adapting existing models and programsidentified as harnessing this family support, e.g., the Pacific Islander Health Care ProfessionsPipeline, the Family Education Model that trains families in how to support their collegegoing children, the Two Feathers Curriculum that includes career development activities, orthe Parent-Community Networking Center that provides a space for teachers, students, andparents to meet and discuss challenges and their solutions.19
Carsten SchmidtkeThe first group of Marshallese arrived in Arkansas in the 1980s to take jobsin the poultry industry. Another wave came in 1996, when a reduction inU.S. aid caused major economic problems in the islands. Today, an estimated4,000 to 6,000 Marshallese live in the area. Because of the islands’ twoCompacts of Free Association with the United States, Marshallese citizens arelegally permitted to work in the United States but are barred from receiving anypublic benefits (Babic, 2015; “Consulate opens,” 2009; Duke, 2013; Jimeno S.,2013; Roche & Mariano, 2002).Many Marshallese immigrants have limited education. They came toArkansas to work and make money although they often seek better educationalopportunities for their children than what is available back home. AlthoughMarshallese parents say that they want their children to go to college and someMarshallese high school students have the same aspirations, almost all graduatesenter the workforce after high school, and administrators have been unable todiscern a reason for this behavior (Roche & Mariano, 2002).The purpose of this study is to describe and analyze the educationalexperiences of Marshallese students at one local community college as theyrelate to educational success and identify the most salient success factors. Ratherthan once more investigate structural problems that have repeatedly beendocumented in the literature on Pacific Islanders (e.g., Ah-Sam & Robinson,1998; Aina et al., 2006; Hokoana & Oliveira, 2012; Makuakane-Drechsel &Hagedorn, 2000; Okamoto et al., 2008; Ratliffe, 2011; Tran et al., 2010), thisstudy wanted to focus on student success factors because Hokoana and Oliveira(2012) had identified them as needing more attention from researchers. It alsowanted to follow the call by Hagedorn, Lester, Moon, and Tibbetts (2006) toprovide more data on community college students.Historical and Cultural Background InformationThe Marshall Islands consist of a group of twenty-nine atolls and five islandsin the Pacific Ocean, located west of the international dateline and north ofthe equator. Twenty-four atolls and islands are populated, with the majorityof the population living in the cities of Majuro on Majuro Atoll and Ebeye onKwajalein Atoll. The combined size of the atolls is roughly similar to that ofWashington, D.C., and most of the land is near sea level with the highest point10 m above sea level. The soil is mainly coral limestone and sand (RMI Embassy,2005; Terry & Thaman, 2008).The Marshall Islands were settled by Micronesians as early as the second20
Success Factors for Marshellese Students at a Local Community College:millennium B.C.E. Their early history is almost completely unknown (Thomas,2008a). Written history begins with the arrival of the Spanish in 1526. Thefirst Englishmen to reach the islands were John Charles Marshall and ThomasGilbert in 1788, the former of whom ultimately became their namesake.However, the islands came under Spanish sovereignty until they were includedin the German Protectorate of New Guinea in 1886 (Thomas, 2008b). In 1914,Japan took possession of the islands from Germany and over the years tried toassimilate Marshallese culture by settling Japanese citizens on the islands andrequiring that Japanese language and culture be taught in schools. In 1944,the U.S. captured the islands and eventually made the area part of the TrustTerritory of the Pacific Islands (Thomas, 2008b).From 1946 to 1958, the islands, in particular Bikini Atoll, were the provingground for sixty-seven nuclear weapons tests (Duke, 2013). In 1979, theMarshall Islands were granted self-governance, and in 1986, the Republic of theMarshall Islands attained sovereignty. The United States, through Compactsof Free Association signed in 1986 and again in 2004, provides defense andeconomic aid for continued use of a military base. In 1990, the United Nationsalso ended its trusteeship status (RMI Embassy, 2005; Talmy, 2006).The total population of the Marshall Islands is around 70,000 with a growthrate of 2.21% per year. The Marshallese population is young, with 36.6% ofinhabitants fifteen years or younger. The official (and traditional) language isMarshallese (Kajin Majel), but English is commonly spoken. The Marshallesetraditionally lived in matrilineal clans, which held all the land rights. Familygatherings are important social events. Islanders used to be (and still are)skilled outrigger boat builders and navigators ( Janssen, Liu, & Ross, 2015;RMI Embassy, 2005; Thomas, 2008b). The Marshallese economy consists ofa subsistence sector (breadfruit, banana, taro, and pandanus cultivation) anda modern service-centered sector (trade, restaurants, banking, and insurance).Copra oil is the biggest export, and handicrafts and tourism also produce someincome. Marine resources (tuna, deep-seabed minerals) are another sourceof income. Major imports are foodstuffs, machinery, consumer goods, andpetroleum products. Of the total population, 11% work in agriculture, 16% inindustry, and 73% in services. The official currency is the U.S. dollar. More thanhalf of the country’s annual budget is provided by the United States in direct aid( Janssen, Liu, & Ross, 2015; RMI Embassy, 2005).The Republic of the Marshall Islands is a parliamentary representativedemocratic republic with a bicameral legislature. The president is both headof state and head of government. The country has a parliament (Nitijela), a21
Carsten Schmidtkecouncil of twelve tribal chiefs (Council of Iroij), and an independent judiciary.The president is elected from the members of the Nitijela, and the thirty-threeNitijela members, called “senators,” are elected to four-year terms. The greatestpresent political challenge is the co-existence of a parliamentary structure anda traditional hierarchical clan society with powerful local clan chiefs (RMIEmbassy, 2005).Literature ReviewNot a single study exists that deals exclusively with educational access,outcomes, barriers, or successes for Marshallese post-secondary students.The Marshallese are usually subsumed under a category referred to as PacificIslanders (PI), which in turn is often subsumed under a category variouslyreferred to as Asian Pacific Islanders (API) (e.g., Washington State WorkforceTraining and Education Coordinating Board, 2005), Asian American PacificIslanders (AAPI) (e.g., CARE, 2010), or Asian Pacific Americans (APA)(e.g., Nakanishi, 1988). To obtain more information relevant to specificPI populations, numerous scholars have called for the disaggregation ofeducational data (Chang et al., 2010; Coloma, 2006; Diaz, 2004; Hagedorn etal., 2006; Kana’iaupuni, 2011; Labrador & Wright, 2011; Lei, 2006; Museus,2013; Orsuwan, 2011; Rho et al., 2011; Wright & Balutski, 2013). The needfor disaggregation, it has been argued, is the result of the fact that PIs generallyhave greater barriers to overcome than Asian Americans and are often doublydisadvantaged in higher education access because Asian American students tendto fill all available slots under existing admission caps for AAPI students andalso receive the bulk of limited scholarship funds, effectively pushing many PIsout of higher education (Wright & Balutski, 2013).In addition, PIs are not a homogeneous group (Lei, 2006). Students comefrom a variety of islands that have quite distinct cultures and languages. Politicaland historical considerations complicate this picture further. Some PIs comefrom independent island nations that were never colonized (e.g., Tonga); somecome from islands that are now politically (although not always economically)independent (e.g., the Republic of the Marshall Islands); and some come fromislands that are still territories of the United States (e.g., Guam). These differenthistorical situations often lead to different perceptions of and attitudes towardthe United States. Current political circumstances also impact people’s ability tolive, work, and go to school in the United States and to qualify for financial aidif needed (Diaz, 2004).22
Success Factors for Marshellese Students at a Local Community College:The state of affairs is made even more complex by where people settle andwhere they were born. PIs who migrated to Hawaii, the homeland of anotherPI group, will have a different experience from those who migrated to the U.S.mainland. People born in an island nation and moving to Hawaii as children,adolescents, or adults will have an experience different from those born inHawaii. People who migrated to the mainland and then moved to Hawaiiwill have an experience different from those who migrated directly to Hawaii,and people who were born on the mainland and then migrated to Hawaii willhave experiences different from those who were born on the mainland andstayed. The different combinations of background factors like perceptions,political status, place of birth, migration patterns, and others all have potentialimplications for educational success and retention in college (Diaz, 2004).If data sets have been disaggregated, this has not been done in a consistentmanner. Sometimes a simple distinction is made between Asian Americans(AA) and Pacific Islanders (PI), a group also referred to as Native Hawaiiansand Pacific Islanders (NHPI) (e.g., Benham, 2006). Other studies will treatNative Hawaiians (NH) separately but combine everyone else under the PacificIslander (PI) label (e.g., Museus, 2013). If the PI group is further disaggregated,there is no consistent pattern, either. For example, the National Commissionon Asian American and Pacific Islander Research in Education (CARE)(2008) reported some of its data under the AAPI label; some disaggregatedinto Native Hawaiian, Samoan, Tongan, Marshallese, and Guamanian; andsome further disaggregated by adding Fijian and Other PI. In 2010, however,CARE’s categories were Tongan, Samoan, Guamanian/Chamorro, and NativeHawaiian if disaggregated and AAPI otherwise. The State of California hasused multiple classification schemes such
Pacific themes using a design element to create a lotus blossom. The waving pages beneath the blossom symbolize academic scholarship and also call forth the Pacific Ocean. The opening lotus is symbolic of new knowledge and insights resulting from research. The Pacific Educational Research Journal is printed on request and for a fee