Transcription
IBM Cognos 8 PlanningManagerVersion 8.4.1User Guide
Product InformationThis document applies to IBM Cognos 8 Planning Version 8.4.1 and may also apply to subsequent releases. To check for newer versions of thisdocument, visit the IBM Cognos Information Centers r0m0/index.jsp).CopyrightLicensed Materials - Property of IBM Copyright IBM Corp. 2003, 2010.US Government Users Restricted Rights – Use, duplication or disclosure restricted by GSA ADP Schedule Contract with IBM Corp.IBM, the IBM logo, ibm.com, and Cognos are trademarks or registered trademarks of International Business Machines Corp., in many jurisdictionsworldwide. Other product and service names might be trademarks of IBM or other companies. A current list of IBM trademarks is available onthe Web at www.ibm.com/legal/copytrade.shtml.Adobe, the Adobe logo, PostScript, and the PostScript logo are either registered trademarks or trademarks of Adobe Systems Incorporated inthe United States, and/or other countries.Microsoft, Windows, Windows NT, and the Windows logo are trademarks of Microsoft Corporation in the United States, other countries, or both.
Table of ContentsIntroduction7Chapter 1: IBM Cognos 8 Planning - Manager9Starting IBM Cognos 8 Planning - Manager 9Chapter 2: FlowChart11Creating a Flowchart 11Flowchart - Actions 12Flowchart - Arrows In 13Flowchart - Arrows Out 14Positioning Flowchart Buttons 15Flowchart - Create Options 15Flowchart - New Button 16Flowchart - Properties of Arrows 17Flowchart - Properties of Buttons 18Flowchart - Refresh 18Flowcharts Library Colors 19Flowcharts - Status Colors 20Flowcharts - System Parameters 20Flowcharts - Trouble Shooting 2123Chapter 3: Format OptionsColor Options 23System Parameters 23Character Formats 24Example 24Chapter 4: User Options25Scroll Bars 25Button Styles 25Set the User Mode 25Mouse Actions Allowed in User Mode 2 26Menu Commands Allowed in User Mode 1 and 2 27User Mode Lock 31Set the MAXWS (Maximum Workspace) in Manager 32Set Full Screen Mode 32Add a Backdrop to a Report 33Set Bitmap Options 33Change Password 34Remove a Password 34Chapter 5: Report Grid35Snap To Grid 35Manually Snap to Grid 35Automatically Snap to Grid 36Licensed Materials – Property of IBM Copyright IBM Corp. 2003, 2010.3
Table of ContentsWarn on Overlap 36Snap Tables and Graphs 36Snap Text and Bitmaps 36Chapter 6: Reports and Views37Manage Reports 37Create a View 38Customize Reports 40Reselect D-Cube Items in a Report 40Combine Dimensions 40Displayed Page 41Row and Column Views 41Select D-Cube or Select Report 42Chapter 7: Report Options43Report Backgrounds 43Change the Report Description 44Configure Replace Mode and Screen Settings 44Chapter 8: Printing and Batch Printing45Printing 45Batch Printing 46Chapter 9: Using IBM Cognos 8 Planning - Analyst in IBM Cognos 8 Planning - ManagerMove Between Analyst and Manager 49Have a Report Open on Manager Start Up 49Using Analyst Functionality in Manager 49Run Analyst D-Links 49Run Analyst Macros 50Use Drill Down 50View Formulas 50Chapter 10: Tables51Customize Table Appearance 51Table Uses 51Minimize Tables and Graphs to Text Boxes 52Set Table Options 52Define Table Borders 53Change Table Size or Position 54Table Lines 55Save Table Formats 56Change the Font and Size 57Format Table Title 57Row and Column Options 58Add Footnotes 61Print Fit to Page Table Print 62Store Settings Without Printing 62Copy Tables 62Color Coding Options 62Change the Default Colors for Detail and Calculated Items 64Choose a Single Color for the Foreground and Background 644 Manager49
Table of ContentsDisplay a Report in Black and White 64Set Colors According to Data Values 65Set Colors According to Values on Another Page 65Table Cell Annotation 66Chapter 11: Graphs67Create Graphs 67Use the Mouse for Data Input 69Use the X-Axis and Y-Axis 70Reselect Which Items Appear on the X-Axis or Y-Axis 70Flip the X-Axis and Y-Axis 70Format the X-Axis and Y-Axis 71View and Change Graph Data 73Format the Graph Border 73Graph Styles 74Insert Graph Gridlines 75Change the Graph Font Style and Size 75Format the Plot Area and Graph Styles 76Add a Graph Title 76Create a Graph Footnote 77Format Graph Legends 77Customize Bars in Graph 79Customize Lines in Graphs 80Customize Pie Graphs 80Chapter 12: Text Boxes, Bitmaps, and Arrows83Create Text Boxes 83Edit and Delete Text Boxes 84Edit Text in a Text Box 84Delete a Text Box 84Add Borders 84Set the Font and Size of a Text Box 85Position Text Boxes 86Bitmaps 86Import Bitmaps 86Position Bitmaps 86Save Bitmaps with Reports 87Delete Bitmaps 87Format Bitmap Border 87Arrows 88Create Arrows 88Delete Arrows 89Move Arrows 89Set Precise Arrow Position 89Move Text Boxes Connected By Arrows 90Change Arrow Styles 90Create Links 91Chapter 13: Working with Data97Tables as Data Entry Tools 97User Guide 5
Table of ContentsNavigating Cells 97Data Entry Commands 98Security Commands 99Reset Data Before Processing 99Reset Data After Processing 99Copy Commands 100Enter New Data in Tables 100Edit Data in Tables 101Cell Color Conventions 101Enter Data in Formula Cells 102Example: Break Back a Total While Holding Selected Cells 102Enter Data in Graphs 102Index6 Manager105
IntroductionThis document is intended for use with IBM Cognos Planning - Analyst.This user guide provides in-depth information about IBM Cognos Planning - Manager, which isused to design reports using data stored in IBM Cognos Planning - Analyst. This user guide helpsyou understand how to use all of the functionality in Manager.IBM Cognos 8 Planning provides the ability to plan, budget, and forecast in a collaborative, securemanner. The major components are Analyst and Contributor.IBM Cognos 8 Planning - AnalystAnalyst is a flexible tool used by financial specialists to define their business models. These modelsinclude the drivers and content required for planning, budgeting, and forecasting. The models canthen be distributed to managers using the Web-based architecture of IBM Cognos 8 Planning Contributor.IBM Cognos 8 Planning - ContributorContributor streamlines data collection and workflow management. It eliminates the problems oferrors, version control, and timeliness that are characteristic of a planning system solely based onspreadsheets. Users have the option to submit information simultaneously through a simple Webor Microsoft Excel interface. Using an intranet or secure Internet connection, users review onlywhat they need to review and add data where they are authorized.For more information about using this product, visit the IBM Cognos Resource Center (http://www.ibm.com/software/data/support/cognos crc.html).Best Practices for IBM Cognos 8 PlanningThe Cognos Innovation Center for Performance Management provides a forum and PerformanceBlueprints that you can use to discover new ideas and solutions for finance and performance management issues. Blueprints are pre-defined data, process, and policy models that incorporate bestpractice knowledge from customers and the Cognos Innovation Center. These Blueprints are freeof charge to existing customers or Platinum and Gold partners. For more information about theCognos Innovation Center or the Performance Blueprints, visit http://www.cognos.com/innovationcenter.AudienceTo use this guide, you should have an understanding of IBM Cognos Planning - Analyst. Someknowledge of security and database systems would also be helpful.Finding InformationProduct documentation is available in online help from the Help menu or button in IBM Cognosproducts.Licensed Materials – Property of IBM Copyright IBM Corp. 2003, 2010.7
IntroductionTo find the most current product documentation, including all localized documentation andknowledge base materials, access the IBM Cognos Resource Center (http://www.ibm.com/software/data/support/cognos crc.html).You can also read PDF versions of the product readme files and installation guides directly fromIBM Cognos product CDs.Samples DisclaimerThe Great Outdoors Company, GO Sales, any variation of the Great Outdoors name, and PlanningSample, depict fictitious business operations with sample data used to develop sample applicationsfor IBM and IBM customers. These fictitious records include sample data for sales transactions,product distribution, finance, and human resources. Any resemblance to actual names, addresses,contact numbers, or transaction values, is coincidental. Unauthorized duplication is prohibited.8 Manager
Chapter 1: IBM Cognos 8 Planning - ManagerManager is used to design reports using data stored in IBM Cognos 8 Planning - Analyst. Whilethe data used in reports is stored in Analyst D-Cubes, the report formatting is stored in Manager.In Manager, a report is the same as a file in Analyst.With Manager, you can create reports with flowcharts (p. 11), tables (p. 51), graphs (p. 67), text(p. 83) and arrows (p. 88) to visually display the data in your Analyst models. A report can rangefrom a single table on one page, to several tables and graphs spanning hundreds of pages. Theoption to set up a batch run to print multiple reports is also available.Reports can be created in Manager to collect data from users and to save data to the underlyingD-Cubes in Analyst. Reports created for this purpose are often called front-end reports and havetext boxes, arrows, and tables that link to underlying Analyst D-Cubes. The tables in these typesof reports are used as data entry tools. For information about changing data in tables and graphs,see "Working with Data" (p. 97). These types of reports can only be used when Manager andAnalyst are installed on a network and the data is stored on a centralized server.Reports can also be created to visually display Analyst data in flowcharts and graphs. These reportscan be distributed to users who view and sometimes change the report data. Reports created forthis purpose commonly use access rights to protect D-Cube data from being corrupted.Starting IBM Cognos 8 Planning - ManagerYou can start IBM Cognos 8 Planning - Manager, and then start IBM Cognos 8 Planning - Analystfrom within Manager.Steps1. In Windows, click Start, Programs, IBM Cognos 8, IBM Cognos Planning - Manager.2. Choose a namespace and click OK.3. Type your User ID and [optional] password, and click OK.4. Select a default library to use for the session. Click OK.5. To access IBM Cognos Planning - Analyst while in IBM Cognos Planning - Manager, clickAnalyst from the D-Cube menu.To return to Manager from Analyst, click Restart from the File menu.Licensed Materials – Property of IBM Copyright IBM Corp. 2003, 2010.9
Chapter 1: IBM Cognos 8 Planning - Manager10 Manager
Chapter 2: FlowChartThe Flowchart functionality in IBM Cognos 8 Planning - Manager gives you the ability to draw apicture of your model. It shows a snapshot of a model at a point in time. The buttons represent DCubes and arrows represent D-Links. Click a button to open a D-Cube, and click an arrow to opena D-Link.The flowchart is color coded to indicate the states of completeness of each part of the flowchart Green indicates that all D-Links in and out of a D-Cube have been drawn as arrows on theflowchart. Red indicates that arrows representing D-Links are missing. Yellow indicates a state of partial completeness, where all D-Links to and from D-Cubes in thesame library have been drawn, but arrows to external files and D-Cubes in other libraries havenot been drawn yet. White indicates external files such as ASCII files.The arrow color indicates the library that the D-Cube or D-Link belongs to A red border indicates an external ASCII file. A blue border indicates an external ODBC source.Note: External files are referred to by the name of the file rather than the name of the file map usedto import the data.Creating a FlowchartCreate a flowchart to show the D-Cubes and D-Links in your model.Steps1. From the File menu, click New.2. From the FlowChart menu, click Create Options (p. 15) to change the settings of the flowchartbuttons and arrows.3. From the FlowChart menu, select New Button (p. 16) to add the first button that will representa D-Cube. It is usual to start with an input D-Cube that only has links going out of it, andplacing it near the top left of your report, but flowchart buttons can be placed anywhere in thereport. The button position set by your cross hair will snap to grid, regardless of the settingson the Report Grid (p. 35) screen.When you have added the D-Cube button, it will have the center color set to pink if it has linksconnected to a D-Cube in the same library. It will be green if it is an isolated D-Cube or if allits links have been followed, or it will be yellow if its links are to or from other libraries orLicensed Materials – Property of IBM Copyright IBM Corp. 2003, 2010.11
Chapter 2: FlowChartexternal files. You can now use Arrows In and Arrows Out (p. 14) options to build the modelby following the links from this cube.4. When all the flowchart buttons in your model are colored green, which means all their linkshave been followed, select the New Button option again, and add a button for another D-Cubein the library you are interested in. Follow all the links until the buttons are green again, andrepeat until there are no unrepresented D-Cubes left to see in the Select D-Cube form.Your flowchart is now complete. It represents all the D-Cubes in the library, and all linksbetween themselves and any external object.5. You can change the flowchart actions by clicking Actions (p. 12) from the FlowChart menu.This affects the action when clicking buttons or arrows, arrow position, hard reference settings,and the flowchart refresh setting.6. You can also set the flowchart library colors for arrows and button borders by clicking Libraries(p. 19) from the FlowChart menu.Flowchart - ActionsThe Flowchart Actions dialog box allows you to set the action to be performed when clicking onbuttons and arrows.To access the Flowchart Actions dialog box, select Actions from the FlowChart menu.Action When Clicking on Buttons and ArrowsSelecting the Open D-Cube on Button select check box sets the action so that a single click a flowchart button will open the underlying D-Cube in IBM Cognos 8 Planning - Analyst.Selecting the Edit D-Links on Arrow select check box sets the action so that a single click an arrowwill open the underlying D-Links in Analyst.Arrow Position After Dragging ButtonsSelecting the Redraw when Necessary check box sets the action so that the entry and exit edges ofarrows and the length of each dog-leg will be allowed to change as required. If it is cleared, theentry and exit edges remain fixed.Selecting the Apply to non-flowchart arrows too check box sets the redraw when necessary actionfor non-flowchart arrows.Hard References - Applied When You Save the ReportA hard reference refers to the D-Cubes and D-Links by an internal identification number. Thisallows you to rename the D-Cubes and D-Links and move them between libraries without anynegative effects. However you cannot delete a D-Cube or D-Link without first deleting the objectsthat refer to it. Flowchart buttons and arrows are said to refer to the objects they use. A flowchartbutton refers to the D-Cube that it opens. A flowchart arrow refers to the D-Link it opens. In facta D-Link is referred to by both the arrow and the flowchart buttons at either end of the arrow, anda D-Cube refers to all other D-Cubes directly connected to it by a single link.12 Manager
Chapter 2: FlowChartSelecting the D-Cubes and D-Links check box turns Hard References on. As a rule of thumb, keephard references set to ON. This lets you rename D-Cubes and D-Links and relocate them betweenlibraries without rendering the buttons and arrows obsolete. The exception is if you are deletingD-Links and D-Cubes in Analyst, when it is easier if you turn the hard references OFF. If Hard References are set to ON (the default), you are allowed to move D-Cubes betweenlibraries. The {file-name} in the caption will use the latest D-Cube name in the flowchart buttonautomatically whenever you open the report. To delete the D-Cube in Analyst you must deletethe flowchart box first, and any other buttons whose D-Cube refers to the D-Cube to be deleted. If Hard References are set to ON, you will have to remove the arrow and the buttons at eachend of the arrow prior to deleting the D-Link in Analyst. However, you are free to rename andmove D-Links between libraries.If you leave the D-Cubes and D-Links check box cleared, Hard references are turned OFF (softreferences). A soft reference refers to the D-Cubes and D-Links by the name, and library. Becausethere is no hard association between the flowchart button and the D-Cube it opens, you can deletethe D-Cube without deleting the button first. Similarly, you can delete the D-Link without firstdeleting the arrow. However, the use of soft references does have a downside, namely that if yourename a D-Cube it makes the button obsolete. In fact, if hard references are OFF, the followingoperations all render a flowchart button obsolete: Renaming a D-Cube. Moving a D-Cube to a different library. Deleting a D-Cube.On {Flowchart Refresh}Selecting the Draw missing arrows between existing buttons check box sets the action so thatmissing arrows get drawn automatically when you refresh, provided both source and target buttonsare already present in the flowchart.Restore System Default ActionsClick the Restore System Default Actions button to restore the default flowchart actions systemsettings.Flowchart - Arrows InDraws arrows into the selected flowchart button. Each arrow represents D-Links that target thecurrent D-Cube. You must have just one flowchart button selected.Steps1. Highlight the button in which you want to draw the arrow.2. From the FlowChart menu, select Arrows In.3. Click the screen where you want the top left corner of the first button to be drawn. The D-Linkarrows are drawn from the linked D-Cube buttons to the selected D-Cube source button.User Guide 13
Chapter 2: FlowChartNote: You only need to click the screen at this stage if one of the links needs a button that isnot already in the flowchart.4. If there are several D-Links between two D-Cubes, they are represented by a single arrow.5. Two-way D-Links are represented by thick double-headed arrows.6. Internal D-Links are represented by a small loop of an arrow on the top edge of the flowchartbutton.When you choose Arrows In from the FlowChart menu, a cross-hair allows you to choose apoint on the screen where the top left corner of the first button is to be drawn. If you positionedthe cross-hair in the bottom right of the screen, the program will place flowchart buttonsassociated with the target D-Cubes to the right and below the original D-Cube cascading onebeneath the other. They will be spread out evenly in the bottom right sector, ideally snappingto a fine grid so that the spacing between buttons is uniform. There are rules that determinethe entry and exit points of arrows.The arrows drawn are two corner dog-legs with no gap. If one D-Cube links to several, allarrows exit from the same point, depending on the relative position of each button, to get atree effect.Internal links in D-Cubes should be represented by tiny arrows that exit and enter the top edgeof a flowchart button.Multiple arrows between D-Cubes get collapsed into one.If there are two-way links between two D-Cubes, a double-headed arrow is drawn.Note: You can always change the positions of arrows and buttons manually. A single clickselects and highlights the arrow or button, you can drag it into position. Ctrl click multiplearrows, buttons, or text boxes to group and drag them together. When the appropriate FlowchartActions are set to ON, a single click, a flowchart button or arrow opens the underlying D-Cubeor all D-Links associated with the arrow.Flowchart - Arrows OutDraws arrows out from the selected flowchart button. Each arrow represents D-Links that havethe current D-Cube as a source.Steps1. Highlight the button from which you want to draw the arrow.2. From the FlowChart menu, select Arrows Out.3. Click the screen where you want the top left corner of the first button to be drawn. The D-Linkarrows are drawn from the source D-Cube button to the linked D-Cube button.Note: You only need to click the screen if one of the links needs a button that is not already inthe flowchart.4. If there are several D-Links between two D-Cubes, they are represented by a single arrow.14 Manager
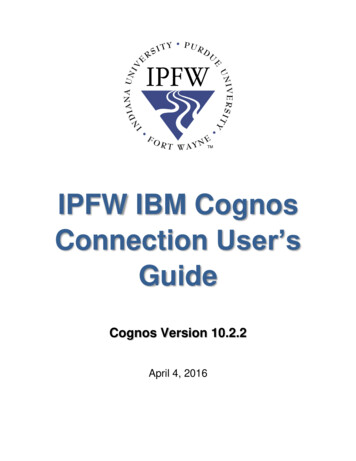
Chapter 2: FlowChart5. Two-way D-Links are represented by thick double-headed arrows.6. Internal D-Links are represented by a small loop of an arrow on the top edge of the flowchartbutton.Positioning Flowchart ButtonsWhen you choose Arrows Out from the FlowChart menu, a cross-hair appears that allows you tochoose a point on the screen where the top left corner of the first button is to be drawn. Supposeyou positioned the cross-hair in the bottom right of the screen. The program will place flowchartbuttons associated with the target D-Cubes to the right and below the original cube cascading onebeneath the other. They will be spread out evenly in the bottom right sector, ideally snapping to afine grid so that the spacing between buttons is uniform. There are rules that determine the entryand exit points of arrows.The arrows drawn are two corner dog-legs with no gap. If one D-Cube links to several, all arrowsexit from the same point, depending on the relative position of each button, to get a tree effect.Internal links in D-cubes should be represented by tiny arrows that exit and enter the top edge ofa flowchart button.Multiple arrows between D-Cubes get collapsed into one.If there are two-way links between two D-Cubes, a double-headed arrow gets drawn.Note: You can always change the positions of arrows and buttons manually. A single click selectsand highlights the arrow or button, then you can drag it into position. Ctrl click multiple arrows,buttons, or text boxes to group and drag them together. When the appropriate Flowchart Actionsare set to ON, a single click a flowchart button or arrow opens the underlying D-Cube or all DLinks associated with the arrow.Flowchart - Create OptionsSelect Create Options from the FlowChart menu. The Flowchart Create Options dialog box containsvarious options that apply when buttons and arrows are drawn for the first time.Search OptionsWhen drawing the flowchart, search options allow you to control what is drawn.You can control the search for new buttons independently for D-Cubes in other Libraries, IBMCognos 8 Planning - Contributor cubes, External ASCII files, and External ODBC objects. If youdeselect all these options, it would limit the search to just D-Cubes in the same library.Cascade Offset (in grid steps)In a similar manner to the standard Windows Cascade, when there are several arrows and buttonsto be drawn, this determines the position of the top left corner of each button. It is measured ingrid squares down and to the right. Down 3 squares, across 0 is the default, so that buttons do notoverlap.User Guide 15
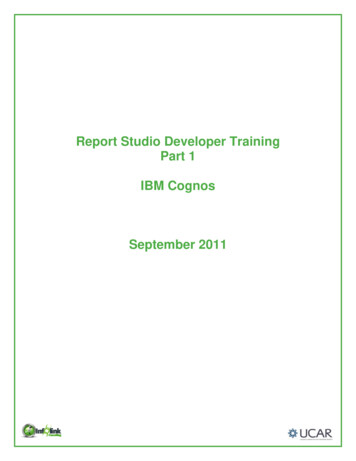
Chapter 2: FlowChartExampleCascade offset 3 down, 1 acrossSelf Link (in grid steps)Height and width in grid squares of arrows that go from a button back to itself.Horizontal Offset to Middle Segment (percent between buttons)How far along the arrow to draw the dog-leg. A 60% horizontal offset is shown below. 60% isthe distance along the arrow to the dog-leg, starting with the From button.Note: If you have a double ended arrow, the From button depends on whether you performed theArrows In function before Arrows Out, and which button you first performed the action on. ClickProperties from the FlowChart menu to verify which button is the From button.Edge Position (percent down edge)You can control the arrow entry and exit positions along an edge. Default to 25% down the edgefor arrows in, 50% down for double-headed arrows, 75% for arrows out.Arrow Width (in pixels)This sets the width of arrows in pixels, and can be set separately for single or double arrows, forarrows that go from a button back to itself, and for arrows that are obsolete.Restore System DefaultsClick the Restore System Defaults button to restore the default flowchart options.Flowchart - New ButtonThis function lets you place a flowchart button associated with a D-Cube at a specific location ofthe flowchart screen. If you are placing multiple buttons on the screen, the properties of the flowchartbuttons are set so that the font, border, and center fill area are the same as the previous buttonproperties you used.If it is a new button on a new report, it can be any color - default to a bevel border with thickness 3,internal gap 0, shadow 0, font Arial, font size 70%, font color black, center area color status16 Manager
Chapter 2: FlowChartcolor applied, border outline color library color applied, bevel top & left white, bevel bottom &right dark gray. The caption appearing in the flowchart button would be the name of the D-Cube.You can select a flowchart button with a single click of the mouse. Using Ctrl click allows you toselect several flowchart buttons that can be dragged as a group. The button is highlighted whenselected.Steps1. Click New Button from the FlowChart menu.2. Position the cross-hair where you want to place the new button and mouse-click to open theSelect D-Cube dialog box.3. From the Library list, select the library that contains your D-Cube data. Then, from the DataCube list, select the D-Cube you want the button to represent. D-Cubes that are already represented by flowchart buttons will not appear in the Select D-Cube dialog box. This prevents twobuttons in a flowchart representing the same D-Cube. Click OK.The button, with the D-Cube name is placed at that location of the screen. Repeat this procedurefor each button on the flowchart screen. The caption appearing in the flowchart button willbe the name of the D-Cube, which can be edited. The border and font properties can be editedusing the usual Border and Font commands from the Text menu.Flowchart - Properties of ArrowsClick an arrow to highlight it, and choose Properties from the FlowChart menu to view the nameand library of the D-Link associated with an arrow. This also lets you change the entry and exitedges of an arrow, and the position, expressed as a percentage along an edge.Number of BendsYou can alter the number of bends, but ensure that if it leaves and enters a horizontal edge it hasan even number of bends.Row PositionThis determines the relative position of the horizontal leg of an arrow.Column PositionThis determines the relative position of the vertical leg of an arrow.Relative Intermediate PositionExpresses arrow dog-leg positions relative to the point where the arrow joins the From button. Ifyou turn this off, it reverts to expressing arrow dog-leg positions in terms of its absolute positionon the screen.Note: You can always change the positions of arrows and buttons manually. A single click selectsand highlights the arrow or button, then you can drag it into position. Ctrl click multiple arrows,buttons, or text boxes to group and drag them together. When the appropriate Flowchart ActionsUser Guide 17
Chapter 2: FlowChartare set to ON, a single click a flowchart button or arrow would open the underlying D-Cube or allD-Links associated with the arrow.Flowchart - Properties of ButtonsThe Flowchart Button Properties dialog box shows the Number, Identity, Type, Name, Location,Description, Text, and dimensions of the associated D-Cube.TextThis is the text caption that appears in the button. The default is {file-name}. For flowchart buttonsthis will always show the latest D-Cube name when you open the report, assuming hard referencesare kept ON in the Flowchart Actions dialog box. You may replace {file-name} with your own textand it will display this instead, but it will still open the original D-Cube when you click the button.To change the text in a button, choose Edit from the Text menu.Restore Text as NameReplaces the caption with the original file name. In the Flowchart Button Properties dialog box,you can see the names and libraries of D-Lists used in a D-Cube. You can also see the number ofselected cells in the D-Cube and the number of selected items in each of the D-Lists used.Reselect for D-Cube editFor very large D-Cubes, it may be impossible to open the entire D-Cube, so a selection button letsyou choose a partial selection that will be opened when you click the button. This also lets you setthe orientation of rows and columns. The number of items and overall cell count will be modifiedto reflect the partial selection.Note: The Reselect for D-Cube edit button is greyed out if the Open D-Cube on Button Select optionis set to off in the Actions dialog box.Steps to View the Flowchart Properties of a Particular Button1. Highlight a single button using Ctrl click.2. Choose Properties from the FlowChart menu to open the Flowchart Button Properties dialogbox.Flowchart - RefreshRefresh is a way of updating your flowchart to reflect changes that may have happened in theAnalyst model. It refreshes status colors for button center area if they are applied. This shows youif arrows are missing from the flowchart. It also refreshes library color for button borders andarrows if they are applied.If a D-Cube or D-Link has been deleted, you will be prompted to grey out or remove the obsoletebutton or arrow associated with it. Once greyed out, the flowchart button gets converted to a textbox, for you to delete at a later date. The process is irreversible. You cannot convert a text boxback to a flowchart button. If Hard References have been turned OFF, renaming or moving libraries18 Manager
Chapter 2: FlowChartalso renders the buttons and arrows obsolete. For information about flowchart actions, see"Flowchart - Actions " (p. 1
1. In Windows, click Start, Programs, IBM Cognos 8, IBM Cognos Planning - Manager. 2. Choose a namespace and click OK. 3. Type your User ID and [optional] password, and click OK. 4. Select a default library to use for the session. Click OK. 5. To access IBM Cognos Planning - Analyst while in IBM Cognos Planning - Manager, click Analyst from the .