Transcription
Visualizing Your Data With TableauKyle CookTableau Download URLhttps://www.tableau.com/partner-trial?id 19536
Visualizing Your Data with Tableau Tableau Partnership Tableau Demo Tableau Walk‐Through Session
Who is Teknion?We are a boutique data consultancy that helps companies organize, see, and understand theirdata so they can make more informed decisions. We implement technology solutions that solvebusiness challenges.We design, architect and implement data solutions to enable our clients to solve their mostcomplex business challenges solutions like data warehousing, dashboards, reporting andanalytics, centers of excellence, etc.
Why Do We Exist?We believe in serving others by unlocking thehidden truths buried in their data.At Teknion:1. We believe Data is an extremely valuable asset and possesses power toreveal truth.2. We believe there are simple Solutions to complex issues.3. We believe we have a responsibility to serve others.Guiding Principles IntegrityDedicationCommitmentIterative ApproachCommunity InvolvementServant’s HeartTrust
When do Organizations Work with Teknion? Lack of access, visibility and trust in their DataData is not modelled or structured properly for analysisNo single version of truthThey struggle with too many disparate Data sources and more coming every dayThey purchased Tableau and are not making the most of itThey can’t get the information they need to make informed business decisionsThey spend 80% of their time wrangling Data, and 20% analyzing it
Representative Clients
Technology PartnersAlteryx 2017 North America Partner of theYearPreferred Professional Services &Training PartnerTableau 2017 Partner Finalist2016 Training & Services Partnerof the YearGold Partner2 Tableau Zen MastersTableau AmbassadorWhereScape 2015-2017 U.S. Partner of the YearPlatinum Partner
Practice AreasBusiness IntelligenceDataAnalyticsVisualizationSoftware SolutionsReporting PortalsWeb DevMobile DevIntegrationBusiness ConsultingIT StrategyTechnology AssessmentsProject Management
Tableau23%68%
Tableau 10.5mobile
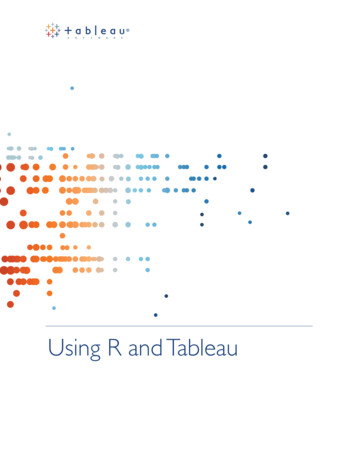
Why Data Visualization? Present data pictorially or graphicallyPre‐attentive attributesQuickly grasp difficult conceptsIdentify data patterns and trendsHelp users understand their data quicker Anscombe’s Quartet
Tableau Consulting Services Proof of Concept (POC)Data Visualization Quick StartDashboard DevelopmentData ConnectionsAd Hoc AnalysisAdvanced AnalyticsServer Consultingo Server Rapid Starto Server Kick Starto Server On Site Architecture Review Tableau Best Practiceso Brandingo Style Guideso Templates, etc. Data Foundationo Data modelingo Data structuringo Data warehousing Integration Strategy Tableau Reporting Portal
Tableau Demo and Dashboards23%68%
Contact Information Kyle Cook– kcook@teknionusa.com PJ Hoke– phoke@teknionusa.com– Please contact if interested in getting plugged in with the Austin Tableau User Group
data so they can make more informed decisions. We implement technology solutions that solve business challenges. We design, architect and implement data solutions to enable our clients to solve their most complex business challenges solutions like data warehousing, dashboards, reporting and