Transcription
ruralhealth.und.edu/researchExploring Rural and Urban MortalityDifferences in the Appalachian Region
Rural Health Reform Policy Research Center (RHRPRC)RHRPRC is a consortium that combines the resources of two premier institutions: The University of North Dakota Center for Rural Health NORC Walsh Center for Rural Health AnalysisResearch conducted by the RHRPRC informs policy makers and rural providers to: Increase access to health care services Improve overall health status of rural residents Assist rural communities in securing adequate, affordable, high-quality health careservices2
Contact Information:For answers to questions about this presentation, contact:Alana Knudson, PhDDeputy Director, Rural Health Reform Policy Research CenterCo-Director, Walsh Center for Rural Health AnalysisNORC at the University of Chicago4350 East-West Highway, Suite 800Bethesda, MD 20814Phone: 301-634-9326Email: Knudson-Alana@norc.org3
Where you live should not determinewhether you live, or whether you die― Bono4
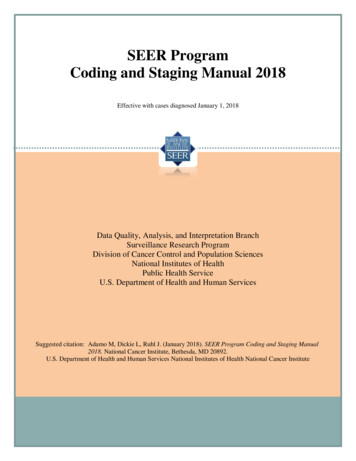
Appalachian RegionThe Appalachian Region is 205,000square-mile and spans the AppalachianMountains from southern New York tonorthern Mississippi. It includes all ofWest Virginia and parts of 12 otherstates: Alabama, Georgia, Kentucky,Maryland, Mississippi, New York, NorthCarolina, Ohio, Pennsylvania, SouthCarolina, Tennessee, and Virginia.The Region includes 420 counties in 13states and has a population of 25 millionpeople. Forty-two percent of theRegion's population is rural, comparedwith 20 percent of the nationalpopulation.Source: Appalachian RegionalCommission, http://www.arc.gov/.
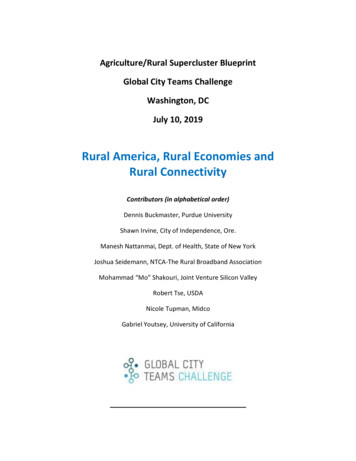
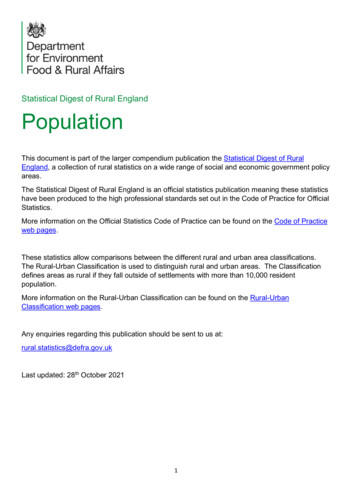
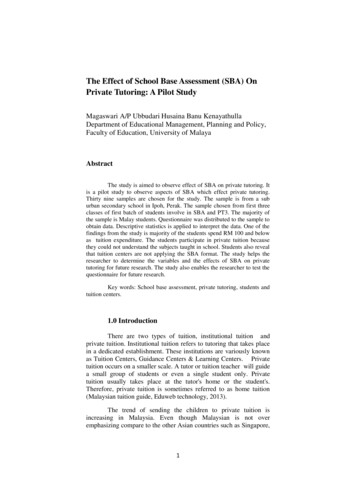
Index for Regional Mortality Rates in Appalachian Region, by RuralUrban Status: United States, 2011-2013 IntroductionFigure 2: Infants (Age Under 1 Years)Figure 3: Children (Age 1 to 14 Years)Figure 4: Adolescents and Young Adults (Age 15 to 24 Years), MalesFigure 5: Adolescents and Young Adults (Age 15 to 24 Years), FemalesFigure 6: Working-Age Adults (Age 25 to 64 Years), MalesFigure 7: Working-Age Adults (Age 25 to 64 Years), FemalesFigure 8: Seniors (Age 65 Years), MalesFigure 9: Seniors (Age 65 Years), Females
Introduction Cause-specific mortality is often higher in rural counties thanurban counties42% of the Appalachia region’s population is rural, comparedwith 20% of the national populationRisk factors contribute to high mortality rates in rural areas SmokingObesityPhysical inactivityHigh mortality rates and risk factors are a reflection of thephysical and social environment in which people live andwork7
Study Purpose To examine the impact of rurality on mortality in Appalachia8
Research Question What are the differences in rural and urban mortality rates inAppalachia?9
MethodsSource of Mortality data:National Vital Statistics System (NVSS)–Years 2011-2013Data are grouped by:–2013 NCHS Urban-Rural Classification Scheme for Counties –––(Large Central, Large Fringe, Small/Medium Metro, Micropolitan, Non-core)AgeGenderCause of Death Top 10 Nation-wide causes of death for each age group10
2013 NCHS Urban-Rural Classification Scheme for Counties2013 NCHS Urban-Rural ClassificationDefinitionLarge central (inner cities)Counties in MSA of 1 million or morepopulation that: Contain the entirepopulation of the largest principal city of theMSA; Are completely contained in the largestprincipal city of the MSA; orContain at least 250,000 residents of anyprincipal city of the MSALarge Fringe (suburban)Counties in MSAs with a population of atleast 1 million residentsSmall MetroCounties in MSAs with a population of lessthan 1 million residentsMicropolitan (large rural)Counties with populations of 10,000 to49,999Non-core (small rural)Remaining nonmetropolitan counties that are11not in a micropolitan statistical area
Additional Notes on the Charts Estimates for the top ten causes of death are shown.Data Tables and Technical Notes are available via electronic access with explicit details includingmortality rates, explanation of mortality index, age-adjustment, cause of death, etc.A missing dot indicates either 1) a suppressed rate or 2) identical values between an urban and ruralestimate (where more urban cases cover the more rural cases). See Appendix A for list of such cases.Suppressed data points occur when there are fewer than 10 deaths within that population sub-group(age, sex, rural-urban status, region).If a cause is not listed on the graph, then all data points for that cause are suppressed. A graph withfewer than 10 causes of death indicates that all points are suppressed for the missing cause(s).Rates are age-adjusted for ages 1-14 Years, 25-64 Years, and 65 Years and Over, and represent deathsper 100,000 population.Index is calculated as: (local mortality rate / national mortality rate)*100 where the nationalmortality rate is calculated using age-specific and sex-specific (over 15 years) death rates.12
Additional Notes on the Charts The graphs and accompanying text are part of a group of available information including TechnicalNotes and data tables corresponding to the graphed data. The Technical Notes provide informationabout data sources and methods. All data tables include the mortality rates underlying the graphics. The tables also include relateddata not included in the chart, as well as standard errors of estimates and results of statisticalcomparisons.Electronic access:Exploring Rural and Urban Mortality Differences by HHS Region may be accessed from the Rural HealthResearch Gateway website at:http://www.ruralhealthresearch.org/.The graphs from this presentation may be accessed rtalityRates/Introduction?:embed y&:display count no13
Figure 2
Figure 3
Figure 4
Figure 5
Figure 6
Figure 7
Figure 8
Figure 9
Summary: Appalachia Cause-specific, rural mortality rates worse than the nation in:– Unintentional injuries, all ages– Circulatory system diseases, congenital malformations, sudden infantdeath syndrome, 1 year of age– Malignant neoplasms, heart disease, suicide, diabetes, lowerrespiratory, cerebrovascular diseases, homicide, septicemia, andchronic liver disease (men) 25 to 64 years of age– All top-ten causes of death, 65 or more years of age22
Summary Place matters in Appalachia Cause-specific mortality varies by rural vs. urban status Regional differences that may impact mortality include: CultureDemographicsHealth behaviorsMorbidity Sparsely populated areas have high mortality rates23
Appendix A: Overlapping Point Graphs with less than two (0 to 24 years of age) or five points (25 years of age) indicate either 1) overlapping data or 2) suppressed orunreliable data. Appendix A lists all overlapping points allowing users to ascertainthe suppressed and unreliable estimates. Overlapping points do not imply equality between two mortalityrates. Please see the data tables for exact rates. Numbers are used to indicate overlap as more than one overlapmay be present within an Age, Sex, Region, Disease combination.24
Appendix A: Overlapping Points by Disease and AgeAge25 to 6425 to 6425 to 6425 to 6425 to 64SexMalesMalesFemalesFemalesFemalesRural-Urban StatusLarge Central Large Fringe Medium/Small Metro Micropolitan Non-coreCerebrovascular diseases11Liver disease1111Cerebrovascular diseases11Diabetes11Liver disease111DiseaseOverlapping points are represented across the rows, not the columns. For example, Males age 25 to 64, Liver disease have two overlapping points. Numbers areused to indicate overlap as more than one overlap may be present within an Age, Sex, Region, Disease combination.25
Appendix A: Overlapping Points by Disease and AgeAge65 65 65 65 65 65 65 65 65 65 65 FemalesFemalesRural-Urban StatusLarge Central Large Fringe Medium/Small Metro Micropolitan Non-coreAlzheimer's111Cerebrovascular diseases1111Diabetes11Flu and Pneumonia11Heart Disease11Malignant Neoplasms11Septicemia111Unintentional injuries11Alzheimer's111Cerebrovascular diseases111Malignant Neoplasms2211DiseaseOverlapping points are represented across the rows, not the columns. For example, Males age 65 Alzheimer’s have overlapping points.26
For More InformationFor state specific mortality rates, contact the state healthdepartment’s vital records department.27
Electronic access: Exploring Rural and Urban Mortality Differences by HHS Region may be accessed from the Rural Health . 65 s ms 1 1 65 s a 1 1 1 65 s s 1 1 65 s 1 1 1 65 s s 1 1 1 65 s ms 2 2 1 1 e x e s. For More Information For state specific mortality rates, contact the state health