Transcription
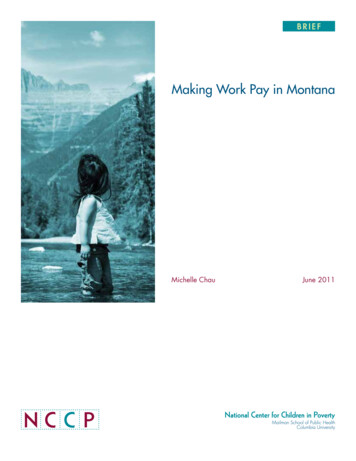
BRIEFMaking Work Pay in MontanasubtitleMichelle ChauJune 2011
The National Center for Children in Poverty (NCCP) is a leading public policy centerdedicated to promoting the economic security, health, and well-being of America’slow-income families and children. Using research to inform policy and practice, NCCPseeks to advance family-oriented solutions and the strategic use of public resourcesat the state and national levels to ensure positive outcomes for the next generation.Founded in 1989 as a division of the Mailman School of Public Health at ColumbiaUniversity, NCCP is a nonpartisan, public interest research organization.Making Work Pay in MontanaMichelle ChauAuthorMichelle Chau is a former research analyst with the Family EconomicSecurity team at NCCP.AcknowledgmentsThis research was made possible by funding from the Annie E.Casey Foundation. The author would like to thank Jennifer Shaffer,Kalyani Thampi, Christina Barsky, Sarah Cline, and other reviewersfrom Rural Dynamics for their thoughtful comments on this brief.The author would also like to thank Curtis Skinner, Telly Valdellon,Amy Palmisano, and Morris Ardoin.Copyright 2011 by the National Center for Children in Poverty2
Making Work Pay in MontanaMichelle ChauIn Montana, 44 percent of children live in lowincome families–defined as income below twicethe federal poverty level (FPL).1 Despite 86 percentof these children having at least one parent who isemployed, many of their families struggle to makeends meet on earnings alone. Work support benefitssuch as the Earned Income Tax Credit, child careassistance, and public health insurance can helpfamilies close the gap between earnings and thecost of basic expenses. While work supports helpparents get by on low wages, families who receivethem often face difficulties getting ahead. Manyencounter “benefit cliffs” where small increases inearnings lead to abrupt work support losses. As aresult, families are often worse off after a small wageincrease. To encourage employment as the primarypath to economic security, a comprehensive worksupport system should accomplish two goals: Provide adequate family resources.If parents work full-time, their earningscombined with work supports shouldprovide the resources necessary to coverbasic family expenses. Reward progress in the workforce.When parents’ earnings increase, theirfamilies should always be better off.Making Work Pay in MontanaJune 2011Tools for Policy AnalysisNCCP’s Family Resource Simulator is an innovative,web-based tool that calculates the impact of federaland state work supports on the budgets of low- tomoderate-income families. The Simulator illustratesthe effectiveness of current policies that reward andencourage work. NCCP also uses this tool to modelpotential policy reforms. Family Resource Simulatorsare available for 25 states, with more than 100localities. See www.nccp.org/tools/frs.The Basic Needs Budget Calculator is a relatedtool that shows how much a family needs to makeends meet without the help of work supports. Userscan select different household scenarios, and theCalculator adjusts the family’s tax liability and budget.Budgets are provided for nearly 100 localities across18 states. See www.nccp.org/tools/budget.Using results from NCCP’s Basic Needs BudgetCalculator and Family Resource Simulator(see box), this brief highlights findings on theeffectiveness of work support policies in Montana.3
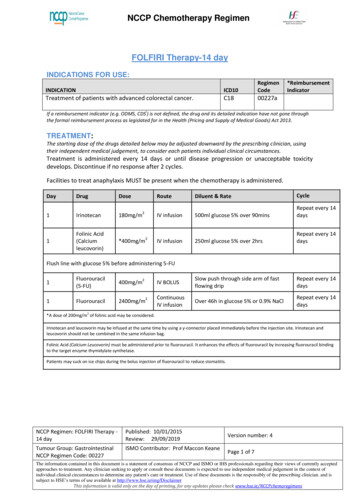
How much does it take to make ends meet in Montana?Across the seven localities examined in Montana,families need incomes of over twice the federalpoverty level to cover their basic expenses ofhousing, food, transportation, health insurance, child care, and other necessities. Figure 1shows that a single parent with two children, onepreschool-aged and one school-aged, needs anannual income ranging from 39,000 in Havre to 46,000 in Kalispell to cover these expenses. This isequivalent to a wage of 19 to 22 per hour – twoto three times the value of the minimum hourlywage of 7.35 and one and a half times the value ofMontana’s median wage of 13.65.2In Montana, as in other states, a family’s largestexpenses are housing and child care. Child careis the largest expense in all seven localities. Forworking families, this is a necessary expense thatensures children are well cared for while parentsparticipate in the labor force. Additionally, highquality child care – care that provides a stable,stimulating, developmentally appropriate, andpositive emotional environment – promotes healthychild development.3 For low-income children inparticular, high-quality child care helps to bridgethe achievement gap between children from lowincome and higher-income homes.4The budgets shown below include only the expensesmost essential to supporting a family. They donot include other family expenses such as debtpayments, spending on durable goods (such asfurniture or appliances), or renter’s insurance.They also don’t allow for families to save moneyto provide a financial cushion in case of illness orfamily crisis or to build assets such as savings fora home, children’s education, or retirement. Thebudgets also do not cover enrichment activities orother expenses that improve a family’s quality oflife. Families would need to earn more than theseminimum budgets to make steps toward achievinglong-term economic security.Figure 1: Basic Needs Budgets Across MontanaSingle parent with two children, one preschool-aged and one school-aged 50,000Rent and utilitiesFoodChild care 40,000Health insurance premiumsOut-of-pocket medicalTransportation 30,000Other necessitiesPayroll taxes 20,000 10,000 0BillingsCulbertsonDillonGreat FallsHavreHelenaKalispellSource: National Center for Children in Poverty’s Basic Needs Budget Calculator, Montana 2010 www.nccp.org/tools/budget . Budgets are basedon the following assumptions: children are in center-based care settings while the parent works (school-aged child is in after-school care) and familymembers have access to employee-based health insurance. Income taxes take into account several federal tax credits.4
Work Supports Can HelpFor low wage workers, earnings alone do not provideenough income to cover the cost of basic expenses.Montana offers several “work support” programsthat can help families fill the gap between earnings and basic expenses (Table 1). They include:Montana Best Beginnings Child Care Scholarshipprogram, public health insurance such as Medicaidand Healthy Montana Kids, the Low Income EnergyAssistance program (LIEAP), the SupplementalNutrition Assistance Program (SNAP), and federaltax credits such as the Child Tax Credit, the Childand Dependent Care Credit, and the Earned IncomeTax Credit (EITC). These programs support parentalemployment by supplementing income or reducingexpenses while families transition to more stablejobs with higher wages. Work supports such asTable 1: Work Support Policies in Montana (as of October 2010)Work support programBenefitIncome eligibility limitsLimits set atthe nationalor state levelChild care subsidy program: BestBeginnings Child Care ScholarshipsChild care subsidy150% FPL after subtracting deductionsfrom incomeStateSupplemental Nutrition AssistanceProgram (SNAP)Food subsidiesMontana uses broad-based categoricaleligibility to expand eligibility to mosthouseholds with gross incomes up to200% FPL.National,with somestate optionsSection 8 Housing Choice VouchersRental assistance50% of area median incomeNationalLow Income Energy AssistanceProgram (LIEAP)Credit applied to heating bill200% FPLStateTemporary Assistance for NeedyFamilies (TANF) Cash AssistanceCash grants 4,980/year for a family of 3 aftersubtracting deductions from incomeStateParents and children:State(up to 526/month for a family of 3)Montana waives the resource test.Varies depending on region, dwellingtype, number of bedrooms, and fuel type.(average benefit of 608 in FY 2010)(up to 504/month for a family of 3)Public Health InsuranceFamily MedicaidSubsidized health insurance for parents andchildren 13,968/year for a family of 3 beforesubtracting deductions from income 5,892/year for a family of 3 aftersubtracting deductions from incomeHealthy Montana Kids Plus(formerly Children’s Medicaid)Subsidized health insurance for children133% FPL* after subtracting deductionsfrom income for childrenStateHealthy Montana Kids(formerly CHIP)Subsidized health insurance for children300% FPL* after subtracting deductionsfrom incomeStateFederal Earned Income Tax Credit(EITC)Refundable tax credit 35,535- 48,362 a year depending onfamily structure and number of childrenNationalFederal Child Tax CreditPartially refundable tax creditGradually phases out to zero beginning at 75,000 or 110,000 a year,depending on filing statusNationalNo limitNationalFederal Income Tax Credits(up to 3,050/year for 1 child; up to 5,036/year for 2 children; up to 5,666/year for 3 or more children)(up to 1,000/year per child under age 17)Federal Child and Dependent CareTax CreditNonrefundable tax refund(up to 1,050/year for 1 child; up to 2,100/year for 2 or more children)As of January 2011, Montana has a state minimum wage of 7.35/hour (as compared to the federal minimum of 7.25/hour).*FPL: Federal poverty level in 2010 was 18,310 for a family of 3; 22,050 for a family of 4.Making Work Pay in Montana5
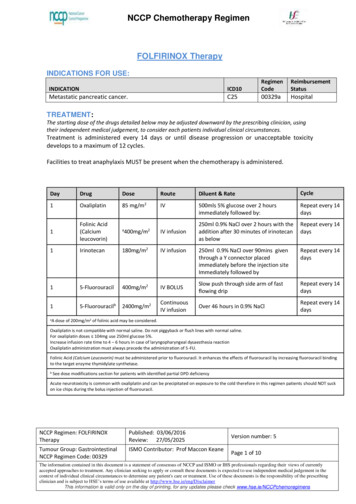
public health insurance and child care subsidieshave also been associated with children’s healthydevelopment and improved academic outcomes.child care expenses from 11,976 to 333. The gapbetween income and expenses disappears, leavingthe family with a small surplus of nearly 4,500,showing how a comprehensive package of worksupports enables the family to make ends meet.Figure 2 shows the impact of work supports onthe resources and expenses of a single parentfamily with one pre-school aged and one schoolaged child in Billings. With employment alone,a parent working full time, year-round earning 8 an hour – 16,640 annually – faces a gap ofover 22,000 between their annual expenses andresources. With the receipt of several work supportsincluding federal tax credits, SNAP, LIEAP, andHealthy Montana Kids, the second column showsthe family’s deficit is reduced to just over 6,000.The addition of a child care subsidy reduces thefamily’s highest expense making a crucial difference in helping the family make ends meet. Columnthree shows that the receipt of a child care subsidyalong with other work supports reduces the family’sDespite the difference work supports can make inpromoting economic security and healthy outcomesfor children, many families do not access all of theprograms for which they are eligible. A recent paperfrom the Urban Institute shows that nationally one infive eligible children do not participate in Medicaid orChildren’s Health Insurance Programs (CHIP), nearlyfour in 10 eligible working households with childrendo not receive SNAP, and seven in 10 families eligiblefor child care subsidies are not served.5 These findingsecho those of a previous study, which found that onlyfive percent of low-income working families receiveda broad work support package of public health insurance, SNAP and a child care subsidy.6Figure 2: Impact of Work Supports: Billings, MTSingle parent with two children, ages 3 and 6 (assumes full-time employment at 8/hour)Employment aloneEmployment plus: federal tax credits SNAP/food stamps LIEAP Healthy Montana Kids PlusEmployment plus: federal tax credits SNAP/food stamps LIEAP Healthy Montana Kids Plus child care subsidy 16,640 16,640 16,640Federal EITC 0 4,996 4,996Federal Child Tax Credit 0 2,000 2,000Federal Child and Dependent Care Tax Credit 0 0 0SNAP/Food stamps 0 5,776 4,578Low Income Energy Assistance Program (LIEAP) 0 494 494 16,640 29,906 28,708Housing 7,740 7,740 7,740Food 6,559 6,559 6,559Annual Resources (cash and near-cash)EarningsTotal ResourcesAnnual ExpensesChild care 11,976 11,976 333Health care 3,898 768 768Transportation 4,071 4,071 4,071Other necessities 3,432 3,432 3,432Payroll taxes 1,273 1,273 1,273Income taxes (excluding credits)Total ExpensesNet Resources (resources – expenses) 129 129 129 37,187 35,947 24,304– 22,437– 6,041 4,404Source: NCCP’s Family Resource Simulator, Montana 2010 www.nccp.org/frs/tools .6
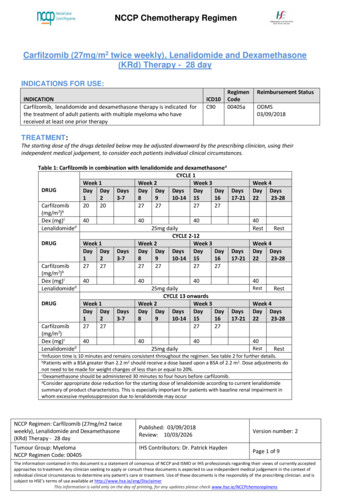
Several factors can contribute to limited programparticipation by families. Programs may have longwaiting lists or inadequate funding that limit thenumber of families served. Burdensome application procedures that require in-person applicationsor confusing paperwork present barriers to manypotential applicants. Other families do not knowthey or their children may be eligible or may avoidapplying for programs that bear a social stigma.Additionally, onerous recertification processes maypreclude families from retaining work supports. Theupshot is that a substantial number of eligible, lowincome families, both nationally and in Montana,do not receive the work supports shown in Figure 2to be critical to making ends meet.The Cliff Effect in MontanaAlthough work supports are critical, the interactionof earnings, benefits, and expenses can have unintended consequences for families struggling to getahead. Since eligibility for benefits is often meanstested and based on income, increases in earningsdo not always mean families are better off. For families who receive work supports, a “benefit cliff ” canoccur, where a small increase in earnings leads tothe complete loss of a work support, derailing theirmovement toward increased economic security.resources minus the cost of expenses – change aswages increase from Montana’s minimum wage of 7.35 to 26 an hour. This graph assumes the family receives federal tax credits, SNAP, LIEAP, publichealth insurance, and a child care subsidy when eligible. In practice, as previously noted, many familiesdo not receive all the benefits for which they are eligible. Additionally, although federal tax credits areincluded in this package of work supports, they arenot accessible year-round.Figure 3 illustrates how benefit cliffs keep a singleparent family of three from getting ahead as earnings increase. It shows how net resources – totalAs the parent’s earnings increase, a succession ofbenefit losses keeps the family from gaining a secureeconomic footing. At 8.00 an hour, combined withFigure 3: Net Family Resources as Earnings Increase: Billings, MTSingle parent with two children, ages 3 and 6 (assumes full-time employment)Resources minus expenses (annual)Loss of children’spublic health insurance 12,000 10,000Loss of child care subsidyLoss of federal EITC 8,000Loss of LIEAP 6,000Loss of food stamps 4,000 2,000 0BREAKEVEN LINE -2,000 -4,000 8( 16,640) 10( 20,800) 12( 24,960) 14( 29,120) 16( 33,280) 18( 37,440) 20( 41,600) 22( 45,760) 24( 49,920) 26( 54,080)Hourly wages (Annual earnings)Breakeven line: Where family resources, including earnings and work supports, equal basic expenses. When net resources are above the line, the family has resources left over after basicexpenses are paid; when net resources are below the line, the family faces a deficit.Source: National Center for Children in Poverty’s Family Resource Simulator, Montana 2010 www.nccp.org/tools/frs . When eligible, the family receives the following work supports:federal tax credits, SNAP/food stamps, LIEAP, public health insurance for children, and a child care subsidy.Making Work Pay in Montana7
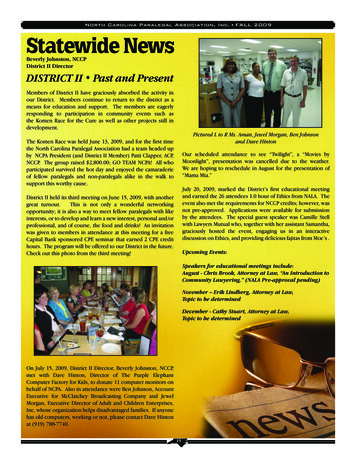
work support benefits, the family is able to cover alltheir expenses and have a small surplus to pay offoutstanding debt or put toward additional familyexpenses. The first and most significant benefit cliffoccurs with the loss of the child care subsidy. As theparent’s wage increases from 13 to 13.50 an hour,income exceeds the child care program eligibilitylevel of 150 percent of the federal poverty level andthe family loses the subsidy. Having to pay marketrates for child care causes their expenses to exceedtheir resources; consequently, their net resourcesfall below the breakeven line. As the family earningsincrease, the loss of SNAP, LIEAP, and the federalEITC is experienced gradually and without a significant cliff because those benefits phase out graduallyas earnings increase. At a wage of 22 an hour, thefamily’s net resources are at the same level as theywere when earning 12 an hour. The family hasfinally recovered from the financial setback causedby the loss of the child care subsidy. But, despitenearly doubling their wage, the family has made littleprogress in achieving greater economic security. Thefinal benefit cliff occurs with the loss of public healthinsurance for children and the increase in expenseswhen the parent must pay for employer-based familyhealth insurance coverage. At this earnings level, thefamily is better able to meet the additional expense.Figure 4 highlights the impact of the child caresubsidy benefit cliff on the family’s resources andexpenses as the parent’s wage increases from 12 to 14 an hour, illustrating how increases in earningsdo not always translate into higher resource levels.Despite an earnings increase of 4,160, the family’snet resources fall by nearly 7,000 with the loss ofthe child care subsidy and reductions in the SNAPand LIEAP benefits. The family still receives supportfrom federal tax credits, which continue to incentivize work and help offset job-related expenses for thefamily. Although the EITC phases out and the creditis reduced to 2,368, the family receives increasedsupport from the child and dependent care credit.However, the increase in the child and dependentcare credit coupled with the earnings increase is stillFigure 4: Resources and Expenses as Earnings Increase from 12/hour to 14/hour: Billings, MTSingle parent with two children, ages 3 and 6 (assumes full-time employment) 12 an hour 14 an hourChangeAnnual Resources (cash and near-cash)Earnings 24,960 29,120 4,160Federal EITC 3,244 2,368– 876Federal Child Tax Credit 2,000 2,000 0 561 977 416 3,305 2,968– 337 340 300– 40 34,410 37,733 3,322Housing 7,740 7,740 0Food 6,559 6,559 0Child care 2,746 11,976 9,230Federal Child and Dependent Care Tax CreditSNAP/Food stampsLow Income Energy Assistance Program (LIEAP)Total ResourcesAnnual ExpensesHealth care 768 768 0Transportation 4,071 4,071 0Other necessities 3,432 3,432 0Payroll taxes 1,909 2,228 318Income taxes (excluding credits) 1,020 1,648 628 28,244 38,420 10,176 6,167– 687– 6,854Total ExpensesNet Resources (resources - expenses)Source: NCCP’s Family Resource Simulator, Montana 2010 www.nccp.org/frs/tools .8
not enough to counteract the loss of the child caresubsidy. As a result, the family faces a deficit of 687and is worse off than before their wage increase.The situation illustrated in Figures 3 and 4 showshow the prospect of losing a work support cancreate disincentives to increase earnings. Families inthese circumstances are confronted with tough decisions that can significantly impact their well-being.Passing up a wage increase can jeopardize eligibilityfor work supports as well as future promotions inthe workplace. More affordable child care mightprovide lower-quality or less reliable care, potentially limiting the child’s development and theparent’s job security. A sound work support systemwould eliminate these difficult choices for workingfamilies, support advancement in the workforce,and ensure that when parents’ earnings increase,their families will be better off.Variation Across CountiesAcross Montana, families face similar patterns ofbenefit cliffs but fare differently due to regionalcost-of-living differences. Figure 5 shows net familyresources for a single parent with two children inseven Montana counties. Eligibility rules and benefitlevels for the work support programs examined inthis brief are the same throughout Montana, withthe exception that LIEAP benefits vary by county.A family of the same composition would lose worksupports at similar income levels regardless oftheir residence location in the state. However, sinceexpenses vary, families with the same earnings andwork supports fare differently across the state. InKalispell, which has the highest cost of living amongthe locations we examined in Montana, familieswho lose their child care subsidies at 13.50 perhour would not be able to make ends meet untilthey earned an income of nearly 20 an hour. Inthe localities with lower costs, families have highernet resources at each wage level and are able to getby after losing their child care subsidy well beforereaching wages of 20 an hour.Figure 5: Net Family Resources as Earnings Increase: Seven Counties, MTSingle parent with two children, ages 3 and 6 (assumes full-time employment)Resources minus expenses (annual)BILLINGSCULBERTSONDILLONGREAT FALLSHAVREHELENAKALISPELL 8,000 7,000 6,000 5,000 4,000 3,000 2,000 1,000 0BREAKEVEN LINE -1,000 -2,000 -3,000 -4,000 -5,000 8( 16,640) 10( 20,800) 12( 24,960) 14( 29,120) 16( 33,280) 18( 37,440) 20( 41,600) 22( 45,760)Hourly wages (Annual earnings)Breakeven line: Where family resources, including earnings and work supports, equal basic expenses. When net resources are above the line, the family has resources left over after basicexpenses are paid; when net resources are below the line, the family faces a deficit.Source: National Center for Children in Poverty’s Family Resource Simulator, Montana 2010 www.nccp.org/tools/frs . When eligible, the family receives the following work supports:federal tax credits, SNAP/food stamps, LIEAP, public health insurance for children, and a child care subsidy.Making Work Pay in Montana9
Different Family TypesFigure 6 compares net resources as earningsincrease for three differently composed familiesin Billings: a single parent with a 3-year-old and6-year-old, a single parent with a 6-year-old and9-year-old and a two-parent family with a 3-yearold and 6-year-old. As with the previous example,this scenario assumes that each family accesses all ofthe work supports for which it is eligible. The figureshows that among the three family types with youngchildren, net resources at similar incomes differwhile the pattern of resource cliffs across incomes islargely consistent for all family types.For a single parent with two school-aged children,ages 6 and 9, the pattern of benefit losses is similarto that for a single parent with a 3- and 6-year-old(Figure 6). The family where both children areschool age fares slightly better after losing the childcare subsidy because neither child requires fulltime care. At 27,000, after the loss of the child carebenefit, this family is just able to meet expenseswith their income and remaining work supports. Atthe same earnings level, the family with a youngerchild needing full-time child care faces a shortfall ofabout 1,000 a year.Parental work patterns significantly affect jobrelated expenditures like child care and transportation. Two-parent families have greater discretionin choosing work and child care arrangementsand expenses may vary more based on family circumstances. Without work supports, a two-parentfamily with one preschooler and one school-agedchild and one working adult must earn 11 to 13an hour, or 23,000 to 27,000 annually, to coverthe family’s basic needs budget. In a similar family with two employed parents, each parent wouldneed to earn 11 to 12 an hour to cover their augmented family budget with additional work-relatedexpenses.Figure 6: Net Family Resources as Earnings Increase: Billings, MTDifferent family typesResources minus expenses (annual) 15,000 12,000Single parent,6- and 9-year-olds 9,000Single parent,3- and 6-year-olds 6,000Two parents,3- and 6-year-olds 3,000 0 -3,000BREAKEVEN LINE 8( 16,640) 10( 20,800) 12( 24,960) 14( 29,120) 16( 33,280) 18( 37,440) 20( 41,600) 22( 45,760) 24( 49,920) 26( 54,080)Hourly wages (Annual earnings)Breakeven line: Where family resources, including earnings and work supports, equal basic expenses. When net resources are above the line, the family has resources left over after basicexpenses are paid; when net resources are below the line, the family faces a deficit.Source: National Center for Children in Poverty’s Family Resource Simulator, Montana 2010 www.nccp.org/tools/frs . When eligible, the family receives the following work supports:federal tax credits, SNAP/food stamps, LIEAP, public health insurance for children, and a child care subsidy.10
Figure 6 shows that two-parent families face challenges comparable to those of single-parent families as earnings increase. As the family transitionsfrom one parent working outside the home and oneparent foregoing paid employment to care for thechildren to both parents working full-time jobs,the family’s net resources hover around 4,000.Once the family hits the child care subsidy limit ataround 33,000 in earnings, a large benefit cliff putsthe family in the red. Despite both parents workingfull time, the increase in child care expenses leavesthe family unable to cover their expenses even withthe assistance of remaining work supports. Whilethe family struggles to break even, they lose SNAP,LIEAP, and their federal EITC. The family eventually breaks even at 45,000 in annual earnings withthe assistance of their only remaining work support,Healthy Montana Kids.Improving Policies for Low Income FamiliesAcross the United States, fiscal constraints areshifting state policy priorities toward basic preservation of work support programs. However, evenas policy makers struggle to preserve the safety netfor low-income and working families, they shouldcontinue to support strategies that improve theeffectiveness of work support policies. Phase benefits out more gradually to soften oreliminate cliffs. Expand access to benefits by increasing eligibilitylimits and covering more eligible families. Coordinate program interactions, so that families do not lose multiple benefits at once.In Montana the largest benefit cliff for families withchildren occurs with the loss of child care assistance. To address this cliff, the program’s incomeeligibility could be extended beyond 150 percentFPL. Gradually increasing family contributions asincome climbs above 150 percent FPL would eliminate the current benefit cliff, stabilizing families’child care arrangements and attachment to work.Policymakers might also consider linking incomeeligibility limits to regional cost-of-living variations.Making Work Pay in MontanaAdopting a state earned income tax credit wouldenhance the resources of low- to moderate-incomeworking families. The refundable federal EarnedIncome Tax Credit is considered one of the mostsuccessful anti-poverty initiatives in history,encouraging work by allowing families of modestmeans to keep more of their earnings. Since theeligibility limit for the EITC is higher than mostwork supports, it is particularly helpful for families whose incomes are too high to qualify forother work supports but too low to cover basicexpenses. According to the Montana Budget andPolicy Center, a state earned income tax credit hasthe potential to positively affect the income of 15percent of working households in the state.7Montana has already adopted some programoptions that benefit low-income work supportrecipients. For example, by adopting SNAP’sexpanded categorical eligibility, Montana expandsaccess to SNAP benefits. However, more steps needto be taken to ensure work supports provide families with adequate resources and reward progress inthe workforce. Using the strategies outlined above,policymakers can create a work support systemdesigned to truly make work pay.11
Endnotes1. Based on NCCP’s analysis of 2009 American CommunitySurvey.2. Bureau of Labor Statistics. (April 6, 2010). May 2009 StateOccupational Employment and Wage Estimates: Montana.In Bureau of Labor Statistics. Accessed Feb. 8, 2011, fromwww.bls.gov/oes/current/oes mt.htm#00-0000.3. Burchinal, M. R. Roberts, J. E. Riggins, Jr., R. Zeisel, S. A.Neebe, E. Bryant. (2000). Relating quality of center-based childcare to early cognitive and language development longitudinally.Child Development, 71, 339–357. doi: 10.1111/1467-8624.001494. Caughy, M. O., DiPietro, J. A. and Strobino, D. M. (1994).Day-care participation as a protective factor in the cognitivedevelopment of low-income children. Child Development, 65,457–471. doi: 10.1111/j.1467-8624.1994.tb00763.x125. G. Mills, J. F. Compton, O. Golden. (2011). Assessing theevidence about work support benefits and low-income families.Urban Institute. Accessed Mar. 1, 2011, from www.urban.org/url.cfm?ID 412303.6. S. Zedlewski, G. Adams, L. Dubay, G. Kenney. (2006). Isthere a system supporting low-income working families? UrbanInstitute. Accessed Mar. 1, 2011, from www.urban.org/url.cfm?ID 311282.7. Investing in Montana’s working families: A Montana earnedincome tax credit. 2011. Montana Budget and Policy Center.Accessed Apr. 14, 2011, from EITC%20Brief%20Final%20030711.pdf.
Billings Culbertson Dillon Great Falls Havre Helena Kalispell. Making Work Pay in Montana 5 . aged child in Billings. With employment alone, a parent working full time, year-round earning 8 an hour - 16,640 annually - faces a gap of . Billings, MT Single parent with two children, ages 3 and 6 (assumes full-time employment at 8/hour .