Transcription
Agilent 4284APrecision LCR MeterData SheetSpecificationsThe complete Agilent Technologies 4284A specifications are listed in this data sheet. These specifications are the performance standards or limitsagainst which the instrument is tested. Whenshipped from the factory, the Agilent 4284A meetsthe specifications listed here.Mathematical functionsThe deviation and the percent of deviation ofmeasurement values from a programmablereference value.Equivalent measurement circuitParallel and seriesRangingAuto and manual (hold/up/down)Measurement FunctionsMeasurement parameters Z Absolute value of impedance Y Absolute value of admittanceL InductanceC CapacitanceR ResistanceG ConductanceD Dissipation factorQ Quality factorRs Equivalent series resistanceRp Parallel resistanceX ReactanceB Susceptanceq Phase angleTriggerInternal, external, BUS (GPIB), and manualDelay timeProgrammable delay from the trigger command tothe start of the measurement, 0 to 60.000 s in 1 mssteps.Measurement terminalsFour-terminal pairTest cable lengthStandard 0 m and 1 m selectableWith Option 4284A-006 0 m, 1 m, 2 m, and 4 m selectableCombinations of measurement parameters Z , Y L, CRGq (deg), q (rad)D, Q, Rs, Rp, GXBIntegration timeShort, medium, and long (see SupplementalPerformance Characteristics for the measurementtime)Averaging1 to 256, programmable
Test SignalFor example,Frequency20 Hz to 1 MHz, 8610 selectable frequenciesAccuracy 0.01%Signal modesNormal (non-constant) – Program selected voltage orcurrent at the measurement terminals when theyare opened or shorted, respectively.DUT’s impedance:Test signal level:Measurement accuracy:Cable length:50 Ω0.1 Vrms0.1%0mThen, voltage level monitor accuracy is (3.1% of reading 0.5 mVrms)Display RangeConstant – Maintains selected voltage or current atthe device under test (DUT) independent ofchanges in the device’s impedance.Parameter Z , R, X0.01 mΩ to 99.9999 MΩSignal level Y , G, B0.01 nS to 99.9999 SC0.01 fF to 9.99999 FL0.01 nH to 99.9999 kHD0.000001 to 9.99999Q0.01 to 99999.9q–180.000 to 180.000 –999.999% to 999.999%VoltageCurrentModeRangeSetting accuracyNon-constant5 mVrms to 2 Vrms (10% 1 mVrms)Constant110 mVrms to 1 Vrms (6% 1 mVrms)Non-constant50 µArms to 20 mArms (10% 10 µArms)Constant1100 µArms to 10 mArms (6 % 10 µArms)1. Automatic Level Control Function is set to ON.Output impedance100 Ω, 3%Test signal level monitorModeVoltage1Current 2RangeAccuracy5 mVrms to 2 Vrms (3% of reading 0.5 mVrms)0.01 mVrms to 5 mVrms (11% of reading 0.1 mVrms)50 µArms to 20 mArms (3% of reading 5 µArms)0.001 µArms to 50 µArms (11% of reading) 1 µArms)1. Add the impedance measurement accuracy [%] to the voltage level monitoraccuracy when the DUT’s impedance is 100 Ω.2. Add the impedance measurement accuracy [%] to the current level monitoraccuracy when the DUT’s impedance is 100 Ω.Accuracies apply when test cable length is 0 m or 1 m. The additional error when testcable length is 2 m or 4 m is given asfm x L2[%]where:fm Test frequency [MHz]L Test cable length [m]2Range
Absolute AccuracyAbsolute accuracy is given as the sum of therelative accuracy plus the calibration accuracy.q accuracyq accuracy is given asqe qcal [deg] Z , Y , L, C, R, X, G, and B accuracy Z , Y , L, C, R, X, G, and B accuracy is given aswhere:Ae Acal [%]qe Relative q accuracy [deg]qcal Calibration accuracy [deg]where:Ae Relative accuracyAcal Calibration accuracyG accuracyWhen Dx (measured D value) 0.1G accuracy is given asL, C, X, and B accuracies apply when Dx (measuredD value) 0.1. R and G accuracies apply when Qx(measured Q value) 0.1. G accuracy described inthis paragraph applies to the G-B combination only.D accuracyD accuracy is given asDe qcalwhere:De is the relative D accuracyqcal is the calibration accuracy [radian]Accuracy applies when Dx (measured D value) 0.1.Q accuracyQ accuracy Qe is given asQe Q2x x Da–1 Qx x Dawhere:BxCxLxDaf G accuracy described in this paragraph applies tothe Cp-G and Lp-G combinations only.Rp accuracyWhen Dx (measured D value) 0.1Rp accuracy is given asRp where:Qx Measured Q valueDa D accuracyQ accuracy applies when Qx x Da 1.Measured B value [S]Measured C value [F]Measured L value [H]Absolute D accuracyTest frequency [Hz]Rpx x Da–DDx a[Ω]where:Rpx Measured Rp value [Ω]Dx Measured D valueDa Absolute D accuracy3
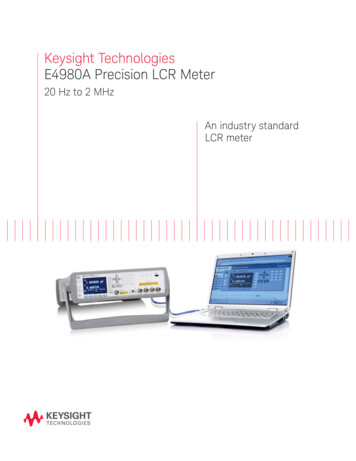
Rs accuracyWhen Dx ( measured D value) 0.13. OPEN and SHORT corrections have beenperformed.Rs accuracy is given as4. Bias current isolation: Off(For accuracy with bias current isolation, refer tosupplemental performance characteristics.)5. Test signal voltage and DC bias voltage are setaccording to Figure 1-2.where:XxCxLxDaf 6. The optimum measurement range is selectedby matching the DUT’s impedance to the effectivemeasuring range. (For example, if the DUT’simpedance is 50 kΩ, the optimum range is the30 kΩ range.)Measured X value [Ω]Measured C value [F]Measured L value [H]Absolute D accuracyTest frequency [Hz]Range 1: Relative accuracy can apply.Relative AccuracyRelative accuracy includes stability, temperaturecoefficient, linearity, repeatability, and calibrationinterpolation error. Relative accuracy is specifiedwhen all of the following conditions are satisfied:Range 2: The limits applied for relative accuracydiffer according to the DUT’s DC resistance. Threedotted lines show the upper limits when the DCresistance is 10 Ω, 100 Ω and 1 kΩ.1. Warm-up time: 30 minutesDC resistance 1 kΩFor 2 m or 4 m cable length operation, test signalvoltage and test frequency are set according toFigure 1-1. (2 m and 4 m cable can only be usedwhen Option 4284A-006 is installed.)Test signal voltage (Vrms)202. Test cable length: 0 m, 1 m, 2 m, or 4 m(Agilent 16048 A/B/D/E)DC resistance 100 ΩDC resistance 10 Ω1510Range 1Range 2Range 3502m cable4m cableTest signal voltage (Vrms)20101001k10k100kFrequency Hz1MFigure 1-1. Test signal voltage and test frequency upperlimits to apply relative accuracy to 2 m and 4 m cablelength operation4510152025303540DC bias voltage setting (V)Figure 1-2. Test signal voltage and DC bias voltage upperlimits apply for relative accuracy1200
Z , Y , L, C, R, X, G, and B accuracy Z , Y , L, C, R, X, G, and B accuracy Ae is given asQ accuracyQ accuracy is given asAe [A (Ka Kaa Kb x Kbb Kc) x 100 Kd] x Ke [%] A Basic accuracy (refer to Figure 1-3 and 1-4)Ka Impedance proportional factor (refer toTable 1-1)Kaa Cable length factor (refer to Table 1-2)Kb Impedance proportional factor (refer toTable 1-1)Kbb Cable length factor (refer to Table 1-3)Kc Calibration interpolation factor (refer toTable 1-4)Kd Cable length factor (refer to Table 1-6)Ke Temperature factor (refer to Figure 1-5)L, C, X, and B accuracies apply when Dx (measuredD value) 0.1.R and G accuracies apply when Qx (measuredQ value) 0.1.Q2x x De–1 Qx x Dewhere:Qx Measured Q valueDe Relative D accuracyAccuracy applies when Qx x De 1.q accuracyq accuracy is given as180 x Ae [deg]π x 100G accuracyWhen Dx (measured D value) 0.1G accuracy is given asWhen Dx 0.1, multiply Ae byX, and B accuracies1 Dx2 for L, C,When Qx 0.1, multiply Ae byG accuracies.1 Qx2 for R andG accuracy described in this paragraph applies tothe G-B combination only.D accuracyD accuracy De is given asDe Ae100Accuracy applies when Dx (measured D value) 0.1.where:BxCxLxDef Measured B value [S]Measured C value [F]Measured L value [H]Relative D accuracyTest frequency [Hz]G accuracy described in this paragraph applies tothe Cp-G and Lp-G combinations only.When Dx 0.1, multiply De by (1 Dx).5
Rp accuracyWhen Dx (measured D value) 0.1Rp accuracy is given as Rpx x De– De [Ω]Dx Example of C-D Accuracy CalculationMeasurement conditionsFrequency:1 kHzC measured:100 nFTest signal voltage: 1 VrmsIntegration time:MEDIUMCable length:0mwhere:Then:Rpx Measured Rp value [Ω]Dx Measured D valueDe Relative D accuracyA 0.05Rs accuracyWhen Dx (measured D value) 0.1Rs accuracy is given aswhere:XxCxLxDef Measured X value [Ω]Measured C value [F]Measured L value [H]Relative D accuracyTest frequency [Hz]Therefore,Caccuracy [0.05 (7.5 x 10⁻⁷ 1.70 x 10-6) x 100] 0.05 [%]Daccuracy 0.05100 0.00056
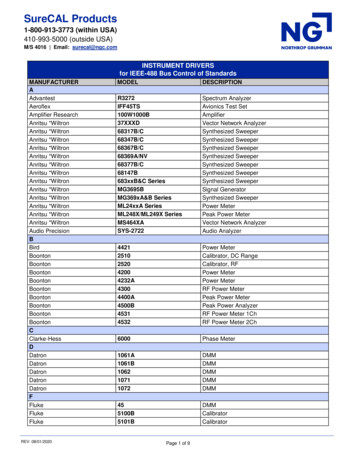
1µ10m100nH10mF1100m10010mFigure 1-3. Basic accuracy A (1 of k10k100nF0µ100µ Z R.X100kH0H10H1kkH101M320k Y ation Charts and Tables0.25(0.3)A320 30 1001k10k100k1M [Hz]30k300kTestfrequencyFrequencyTestOn boundary line apply the better value.Example of how to find the A value:0.05 A value when 0.3 Vrms Vs 1 Vrms andintegration time is MEDIUM and LONG.(0.1) A value when 0.3 Vrms Vs 1 Vrms andintegration time is SHORT.A1 A value when Vs 0.3 Vrms or Vs 1 Vrms.To find the value of A1, A2, A3, and A4 referto the following table.where:Vs Test signal voltage7
The following table lists the value of A1, A2, A3, andA4. When Atl is indicated find the Atl value usingFigure 1-4.Test signal voltage5m12mA1 AtlMedium/ A2 AtllongA3 Atl*A4 AtlA1A2A3A40.1 AtlAtl *0.25AtlA1 AtlA2 AtlA3 AtlA4 AtlShortA1A2A3A45mA1A2A3A4 0.15 AtlAtl0.25AtlAtlAtl0.3Atl33m0.3At10.5520 [Vrms] Atl0.10.250.1A1A2A3A4 AtlAtl0.25AtlA1A2A3A4 AtlAtl **0.25AtlA1A2A3A4 Atl0.20.30.5 X Alt 0.1A1A2A3A4 AtlAtl0.3AtlA1A2A3A4 AtlAtl0.3Atl0.1512**520 [Vrms]** Add 0.15 to the A values when all of the following measurement conditions are satisfied.100 Hz fm 300 Hz: Multiply the A values by 2.fm 100 Hz: Multiply the A values by 2.5.1.51.02A1A2A3A4* Multiply the A values as follows, when the testfrequency is less than 300 Hz.2.01Test frequency: 300 kHz fm 1 MHzTest signal voltage: 5 Vrms Vs 20 VrmsDUT: Inductor, Zm 200 Ω ( Zm : impedanceof DUT)INTEG 0m50m100m200m500mTest signal voltageFigure 1-4. Basic accuracy A (2 of 2)81251020[Vrms]
Ka and Kb values are the incremental factors inlow impedance and high impedance measurements,respectively. Ka is practically negligible for impedances above 500 Ω, and Kb is negligible for impedances below 500 Ω.Table 1-1. Impedance proportional factors Ka and KbKaa is practically negligible for impedances above 500 Ω.Table 1-2. Cable length factor Kaa9
Table 1-3. Cable length factor KbbDirect calibration frequencies are the followingforty-eight frequencies.Cable length2mFrequency0m1mfm 100 kHz11 5 x fm1 10 x fm1 20 x fm100 kHz fm 300 kHz 11 2 x fm1 4 x fm1 8 x fm300 kHz fm 1 MHz1 0.5 x fm1 1 x fm1 2 x fm14mTable 1-5. Preset calibration frequencies1001101001fm: Test Frequency [MHz]Table 1-4. Calibration interpolation factor KcTest frequencyKcDirect calibration frequencies0Other frequencies0.0003Temperature [ C]5KeFigure 1-5. Temperature factor K [kHz]Table 1-6. Cable length factor KdTestsignallevel84120 1501.2 1.51215120 150[MHz]1824m 2 Vrms 2.5 x 10⁻⁴(1 50 x fm)5 x 10⁻⁴(1 50 x fm)1 x 10⁻³(1 50 x fm) 2 Vrms 2.5 x 10⁻³(1 16 x fm)5 x 10⁻³(1 16 x fm)1 x 10⁻²(1 16 x fm)281Cable length2m1m382454
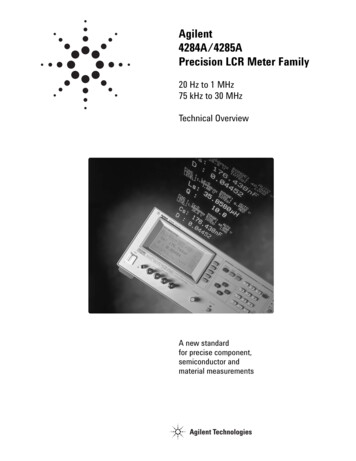
Agilent 4284A Calibration Accuracy0HH1010fP10H1kkH10100fP1H100mHAcal 0.03 1 x 10⁻³ fmqcal (100 20fm) x 10-6101mH0µH101mF10mF110100m10010m100mFfm test frequency [kHz]On boundary line apply the better value:Upper value (Acal) is Z , Y , L, C, R, X, G, and Bcalibration accuracy [%]Lower value (qcal) is phase calibration accuracyin radians.0.03*1 x 10-420 30 1000.05*2 x 10-41k0.05*3 x 10-410kµH101µH0.052 x 10-4H15100.053 x 10-40.031 x 10-40n100m100µF3 x 10100110µF1k10m0.03 1 x 10⁻⁴ fm2.5fm x 10-6(100 20fm)1µF-432k10k0.05 5 x 10⁻⁵ fm100µ Z . R . X100k100nF0.05 5 x 10-5 fm*3 x 10-4 2 x 10⁻⁷ fm**320k10µmH1M1010nFnH10M1µ Y . G . ation accuracy is shown in the following figure:100k1M [Hz]30k300kTest frequency* Acal 0.1% when Hi-PW mode is on.** Acal (300 fm) x 10–6 [rad] when Hi-PW modeis on.Phase calibration accuracy in degree, qcal [deg]is given as,qcal [deg] 180[rad]π x qcal11
Additional SpecificationsCorrection FunctionsWhen measured value 10 mΩ, Z , R, and X accuracy Ae, which is described on page 5, is given asfollowing equation. Z , R, and X accuracy:Ae [(Ka Kaa Kc) x 100 Kd] x Ke(%)Where Ka: Impedance proportional factor (refer toTable 1-1) Kaa: Cable length factor (refer to Table 1-2) Kc: Calibration interpolation factor (refer toTables 1-4 and 1-5) Kd: Cable length factor (refer to Table 1-6) Ke: Temperature factor (refer to Figure 1-5) X accuracy apply when Dx (measured Dvalue) 0.1 R accuracy apply when Qx (measured Qvalue) 0.1 When Dx 0.1, multiply Ae by(1 Dx2)for X accuracy. When Qx 0.1, multiply Ae by(1 Qx2)for R accuracy.When measured value 10 mΩ, calibration accuracy Acal, which is described on page 11, is given asfollows.Calibration accuracy: When 20 Hz fm 1 kHz, calibrationaccuracy is 0.03 [%]*. When 1 kHz fm 100 kHz, calibrationaccuracy is 0.05 [%]*. When 100 kHz fm 1 MHz, calibrationaccuracy is 0.05 5 x 10⁻⁵ fm [%]*. fm: test frequency [kHz] *Acal 0.1% when Hi-PW mode is on.Zero openEliminates measurement errors due to parasiticstray impedances of the test fixture.Zero shortEliminates measurement errors due to parasiticresidual impedances of the test fixture.LoadImproves the measurement accuracy by using aworking standard (calibrated device) as a reference.List SweepA maximum of 10 frequencies or test signal levelscan be programmed. Single or sequential test canbe performed. When Option 4284A-001 is installed,DC bias voltages can also be programmed.Comparator FunctionTen bin sorting for the primary measurementparameter, and IN/OUT decision output for thesecondary measurement parameter.Sorting modesSequential mode. Sorting into unnested bins withabsolute upper and lower limitsTolerance mode. Sorting into nested bins withabsolute or percent limitsBin count0 to 999,999List sweep comparatorHIGH/IN/LOW decision output for each pointin the list sweep table.DC Bias0 V, 1.5 V, and 2 V selectableSetting accuracy 5% (1.5 V, 2 V )12
Other FunctionsTest signal level monitorStore/loadTen instrument control settings, includingcomparator limits and list sweep programs, canbe stored and loaded from and into the internalnon-volatile memory. Ten additional settings canalso be stored and loaded from each removablememory card.ModeRangeAccuracyVoltage1 2 Vrms (3% of reading 5 mV)5 mV to 2 Vrms (3% of reading 0.5 mV)0.01 mV to 5 mVrms (11% of reading 0.1 mV) 20 mArms (3% of reading 50 µA)50 µA to 20 mArms (3% of reading 5 µA)0.001 µA to 50 µArms (11% of reading 1 µA)Current 2GPIBAll control settings, measured values, comparatorlimits, list sweep program. ASCII and 64-bit binaryformat. GPIB buffer memory can store measuredvalues for a maximum of 128 measurements andoutput packed data over the GPIB bus. Complieswith IEEE-488.1 and 488.2. The programminglanguage is SCPI.Interface functionsSH1, AH1, T5, L4, SR1, RL1, DC1, DT1, C0, E1Self testSoftkey controllable. Provides a means to confirmproper operation.OptionsOption 4284A-001 (power amp/DC bias)Increases test signal level and adds the variableDC bias voltage function.Test signal levelModeVoltageCurrentRangeSetting accuracy1. Add the impedance measurement accuracy [%] to the voltage level monitoraccuracy when the DUT’s impedance is 100 Ω2. Add the impedance measurement accuracy [%] to the current level monitoraccuracy when the DUT’s impedance is 100 Ω.Accuracies apply when test cable length is 0 m or 1 m.Additional error for 2 m or 4 m test cable lengthis given as:fm x L [%]2where:fm is test frequency [MHz]L is test cable length [m]DC bias levelThe following DC bias level accuracy is specifiedfor an ambient temperature range of 23 C 5 C.Multiply the temperature induced setting errorlisted in Figure 1-5 for the temperature range ofO C to 55 C.Non-constant5 mV to 20 Vrms (10% 1 mV)Constant110 mV to 10 Vrms (10% 1 mV)Test signal level 2 VrmsNon-constant50 µA to 200 mArms (10% 10 µA)Voltage rangeResolutionSetting accuracyConstant1100 µA to 100 mArms (10% 10 µA) (0.000 to 4.000) V1 mV (0.1% of setting 1 mV) (4.002 to 8.000) V2 mV (0.1% of setting 2 mV) (8.005 to 20.000) V5 mV (0.1% of setting 5 mV) (20.01 to 40.00) V10 mV (0.1% of setting 10 mV)1. Automatic level control function is set to on.Output impedance100 Ω, 6%13
Power RequirementsTest signal level 2 VrmsVoltage rangeResolutionSetting accuracy (0.000 to 4.000 ) V1 mV (0.1% of setting 3 mV) (4.002 to 8.000) V2 mV (0.1% of setting 4 mV) (8.005 to 20.000) V5 mV (0.1% of setting 7 mV) (20.01 to 40.00) V10 mV (0.1% of setting 12 mV)Setting accuracies apply when the bias current isolation function is set to OFF. When the bias currentisolation function is set to on, add 20 mV to eachaccuracy value (DC bias current 1 µA).Bias current isolation functionA maximum DC bias current of 100 mA (typicalvalue) can be applied to the DUT.Line voltage100, 120, 220 Vac 10%, 240 Vac 5% – 10%Line frequency47 to 66 HzPower consumption200 VA maxOperating EnvironmentTemperature0 C to 55 CHumidity 95% R.H. at 40 CDimensionsDC bias monitor terminalRear panel BNC connector426 (W) by 177 (H) by 498 (D) (mm)Other OptionsApproximately 15 kg (33 lb., standard)Option 4284A-700 Standard power(2 V, 20 mA, 2 V DC bias)Option 4284A-001 Power amplifier/DC biasOption 4284A-002 Bias current interfaceAllows the 4284A to control the42841A bias current source.Option 4284A-004 Memory cardOption 4284A-006 2 m/4 m cable length operationOption 4284A-201 Handler interfaceOption 4284A-202 Handler interfaceOption 4284A-301 Scanner interfaceOption 4284A-710 Blank panelOption 4284A-907 Front handle kitOption 4284A-908 Rack mount kitOption 4284A-909 Rack flange and handle kitOption 4284A-915 Add service manualOption 4284A-ABJ Add Japanese manualOption 4284A-ABA Add English manualFurnished AccessoriesPower cableDepends on the countrywhere the 4284A is beingused.FuseOnly for Option 4284A-201,Part number 2110-0046, 2 each14WeightDisplayLCD dot-matrix displayCapable of displayingMeasured valuesControl settingsComparator limits and decisionsList sweep tablesSelf test message and annunciationsNumber of display digits6 digits, maximum display count 999,999
Supplemental Performance CharacteristicsMeasurement TimeThe 4284A supplemental performance characteristics are not specifications but are typical characteristics included as supplemental information forthe operator.Typical measurement times from the trigger tothe output of EOM at the handler interface.(EOM: end of measurement)Integrationtime100 HzTest frequency1 kHz10 kHz1 MHzMEDIUM integration time and operating temperature at 23 C 5 CSHORT270 ms40 ms30 ms30 msMEDIUM400 ms190 ms180 ms180 ms Z , Y L, C, R, 0.01%/dayLONG1040 ms830 ms820 ms820 msStabilityTemperature CoefficientMEDIUM integration time and operating temperature at 23 C 5 CTest signal level Z , Y , L, C, RD 20 mVrms 0.0025%/ C 0.000025/ C 20 mVrrns 0.0075%/ C 0.000075/ CSettling TimeFrequency (fm) 70 ms (fm 1 kHz) 120 ms (100 Hz fm 1 kHz) 160 ms (fm 100 Hz)Test signal level 120 msMeasurement range 50 ms/range shift (fm 1 kHz)Input ProtectionInternal circuit protection, when a charged capacitor is connected to the UNKNOWN terminals.Measurement time [ms]D 0.0001/day20001000600400200806040201020 HzLONGMEDIUMSHORT100 Hz1 kHz10 kHz100 kHz1 MHzTest frequencyDisplay timeDisplay time for each display format is given asMEAS DISPLAY pageBIN No. DISPLAY pageBIN COUNT DISPLAY pageApprox. 8 msApprox. 5 msApprox. 0.5 msGPIB data output timeInternal GPIB data processing time from EOMoutput to measurement data output on GPIB lines(excluding display time).Approx. 10 msDC Bias (1.5 V/2 V)Output current.: 20 mA max.The maximum capacitor voltage is:Vmax 1C[V]where:Vmax 200 V,C is in Farads15
Option 4284A-001 (Power Amp/DC Bias)DC bias voltageDC bias voltage applied to DUT (Vdut) is given asVdut Vb – 100 x IbWhere,where:[V]Vb is DC bias setting voltage [V]Ib is DC bias current [A]P is the coefficient listed on Table 1-7.n is the number of averaging.DC bias currentDC bias current applied to DUT (Idut) is given asIdut where:Vb[A]100 RdcVb is DC bias setting voltage [V]Rdc is the DUT’s DC resistance [Ω]Maximum DC bias current when the normalmeasurement can be performed is as follows.10 Ω100 Ω300 Ω1 kΩ3 kΩ10 kΩ30 kΩ100 kΩOn100 mA100 mA100 mA100 mA100 mA100 mA100 mA100 mAOff2 mA2 mA2 mA1 mA300 µA100 µA30 µA10 µAMeasurement rangeBias current isolationRelative accuracy with bias current isolationWhen the bias current isolation function is set toon, add the display fluctuation (N) given in thefollowing equation to the Ae of relative accuracy.(Refer to “relative accuracy” of specification.)The following equation is specified when all ofthe following conditions are satisfied.DUT impedance 100 ΩTest signal level setting 1 VrmsDC bias current 1 mAIntegration time : MEDIUMN Px16DCbias current [mA]DUTimpedance [Ω]1xxMeasurement range [Ω] Test signal level [Vrms] nx 10-4 [%]
When the DC bias current is less than 1 mA, applyN value at 1 mA. When integration time is set toSHORT, multiply N value by 5. When integrationtime is set to LONG, multiply N value by 0.5.Table 1-7. Coefficient related to test frequency andmeasurement rangeMeas.range20 fm 100Test frequency fm [Hz]100 fm1 k fm 1k 10 k10 k fm 1M100 Ω0.750.2250.0450.015300 Ω2.50.750.150.051 kΩ7.52.250.450.153 kΩ257.51.50.510 kΩ7522.54.51.530 kΩ25075155100 kΩ7502254515Calculation ExampleMeasurement conditionsDUT: 100 pFTest signal level: 20 mVrmsTest frequency: 10 kHzIntegration time: MEDIUMDC Bias Settling TimeWhen DC bias is set to on, add the settling timelisted in the following table to the measurementtime. This settling time does not include the DUTcharge time.Test frequency (fm)Bias current isolationOnOff20 Hz fm 1 kHz210 ms20 ms1 kHz fm 10 kHz70 ms20 ms10 kHz fm 1 MHz30 ms20 msSum of DC bias settling time plus DUT (capacitor)charge time is shown in the following figure.Bias sourceBias current isolationTest frequency (fm)(1) StandardOn/Off20 Hz fm 1 MHz(2) Option 4284A-001Off20 Hz fm 1 MHz(3)On10 kHz fm 1 MHz(4)On1 kHz fm 10 kHz(5)On20 Hz fm 1 kHz100secThen:Ae of relative accuracy without bias current isolation is 0.22 [%]. (Refer to “relative accuracy” ofspecification.)Then, N 15 x (159 x 103 )/(100 x 103 ) x 1/(20 x 10 –3) x 10 –4 0.12 [%]Setting timeDUT’s impedance 1/(2π x104 x100 x10–12) 159 kΩMeasurement range is 100 kΩDC bias current 1 mAP 15 (according to Table 1-7)10sec1 (4)(3)(1)1 µF(2)10 µF100 µF1 mF10 mF100 mFCapacitanceTherefore, relative capacitance accuracy is:Figure 1-6. Measurement time (0.22 0.12) 0.34 [%]17
Rack/Handle InstallationThe Agilent 4284A can be rack mounted and usedas a component of a measurement system. The following figure shows how to rack mount the 4284A.Table 1-8. Rack mount kitsOptionDescriptionKit part number4284A-907Handle kit5061-96904284A-908Rack flange kit5061-96784284A-909Rack flange and handle kit5061-9684Figure 1-7. Rack mount kits installation1. Remove the adhesive-backed trim strips (1) from the left andright front sides of the 4284A.2. HANDLE INSTALLATION: Attach the front handles (3) to thesides using the screws provided and attach the trim strip (4) to thehandle.3. RACK MOUNTING: Attach the rack mount flange (2) to the leftand right front sides of the 4284A using the screws provided.4. HANDLE AND RACK MOUNTING: Attach the front handle (3)and the rack mount flange (5) together on the left and right frontsides of the 4284A using the screws provided.5. When rack mounting the 4284A (3 and 4 above), remove allfour feet (lift bar on the inner side of the foot and slide the foottoward the bar).18
Storage and repackingThis section describes the environment for storingor shipping the Agilent 4284A, and how to repackage the 4284A far shipment when necessary.EnvironmentThe 4284A should be stored in a clean, dry environment. The following environmental limitationsapply for both storage and shipmentTemperature: –20 C to 60 CHumidity: 95% RH (at 40 C)To prevent condensation from taking place on theinside of the 4284A, protect the instrument againsttemperature extremes.Original packagingContainers and packing materials identical tothose used in factory packaging are availablethrough your closest Agilent sales office. If theinstrument is being returned to Agilent for servicing, attach a tag indicating the service required,the return address, the model number, and the fullserial number. Mark the container FRAGILE tohelp ensure careful handling. In any correspondence, refer to the instrument by model numberand its full serial number.Other packagingThe following general instructions should beused when repacking with commercially availablematerials:1. Wrap the 4284A in heavy paper or plastic. Whenshipping to an Agilent sales office or servicecenter, attach a tag indicating the servicerequired, return address, model number, andthe full serial number.2. Use a strong shipping container. A doublewalled carton made of at least 350 pound testmaterial is adequate.3. Use enough shock absorbing material (3- to4-inch layer) around all sides of the instrumentto provide a firm cushion and to prevent movement inside the container. Use cardboard toprotect the front panel.4. Securely seal the shipping container.5. Mark the shipping container FRAGILE to helpensure careful handling.6. In any correspondence, refer to the 4284A bymodel number and by its full serial number.CautionThe memory card should be removed beforepacking the 4284A.19
Agilent Technologies’ Test and Measurement Support, Services, and AssistanceAgilent Technologies aims to maximize the value you receive, while minimizing yourrisk and problems. We strive to ensure that you get the test and measurementcapabilities you paid for and obtain the support you need. Our extensive supportresources and services can help you choose the right Agilent products for yourapplications and apply them successfully. Every instrument and system we sell hasa global warranty. Support is available for at least five years beyond the production lifeof the product. Two concepts underlie Agilent’s overall support policy: “Our Promise”and “Your Advantage.”Our PromiseOur Promise means your Agilent test and measurement equipment will meet itsadvertised performance and functionality. When you are choosing new equipment, we will help you with product information, including realistic performancespecifications and practical recommendations from experienced test engineers.When you receive your new Agilent equipment, we can help verify that it worksproperly and help with initial product operation.Your AdvantageYour Advantage means that Agilent offers a wide range of additional expert testand measurement services, which you can purchase according to your unique technical and business needs. Solve problems efficiently and gain a competitive edgeby contracting with us for calibration, extra-cost upgrades, out-of-warranty repairs,and onsite education and training, as well as design, system integration, projectmanagement, and other professional engineering services. Experienced Agilentengineers and technicians worldwide can help you maximize your productivity, optimize the return on investment of your Agilent instruments and systems, and obtaindependable measurement accuracy for the life of those products.Agilent Email Updateswww.agilent.com/find/emailupdatesGet the latest information on the products and applications you select.Agilent T&M Software and ConnectivityAgilent’s Test and Measurement software and connectivity products, solutions anddeveloper network allows you to take time out of connecting your instruments toyour computer with tools based on PC standards, so you can focus on your tasks,not on your connections. Visit www.agilent.com/find/connectivityfor more information.For more information on Agilent Technologies’ products, applications or services,please contact your local Agilent office. The complete list is available at:Phone or FaxUnited States:(tel) 800 829 4444(fax) 800 829 4433Canada:(tel) 877 894 4414(fax) 800 746 4866China:(tel) 800 810 0189(fax) 800 820 2816Europe:(tel) 31 20 547 2111Japan:(tel) (81) 426 56 7832(fax) (81) 426 56 7840Korea:(tel) (080) 769 0800(fax) (080)769 0900Latin America:(tel) (305) 269 7500Taiwan:(tel) 0800 047 866(fax) 0800 286 331Other Asia Pacific Countries:(tel) (65) 6375 8100(fax) (65) 6755 0042Email: tm t specifications and descriptions in this document subject to changewithout notice. Agilent Technologies, Inc. 2004, 2003, 2002Printed in USA, September 21, 20045963-5390E
With Option 4284A-006 0 m, 1 m, 2 m, and 4 m selectable Integration time Short, medium, and long (see Supplemental Performance Characteristicsfor the measurement time) Averaging 1 to 256, programmable Agilent 4284A Precision LCR Meter Data Sheet. Test Signal Frequency 20 Hz to 1 MHz, 8610 selectable frequencies