Transcription
STANISLAUS COUNTYCHILD HEALTH STATUSREPORTEXECUTIVE SUMMARYSEPTEMBER 2017Developed by CAPE:Community Assessment Planning and Evaluation Section, Division of Public HealthDeveloped by CAPE: Community Assessment Planning and Evaluation Section, Division of Public Health; Sept 20170
Table of ContentsTopicsPageDemographics Births by Year (2002-2013 –Figure 1) Under 18 Years by Sex (2000-2014 –Figure 2) Under 18 Years by Age Groups (2000-2014 –Figure 3) Under 18 Years by Age Groups and Race/Ethnicity(2000-2014 –Figure 4)22233Family Households Household incomes Composition of Households Poverty level of Households Nutrition Assistance/Food Insecurity/Free School Meals Unemployment Rate Access to Health Care Insurance44444444Education Student Enrollment by Race/Ethnicity (2016-2017 –Table 1) English Proficiency by Grade (2016-2017 –Figure 5) 12th Grade “University Ready” Ratios (2015-2016 –Figure 6) Stanislaus County Education Attainment (2016 –Figure 7)56778Child and Adolescent Health Child Death by 5-14 Age Group (2002-2013 –Figure 8) Unintentional Injury Death by Age Group and Race/Ethnicity9910(2002-2013 –Figure 9)Adolescent Risk Behaviors: Intentional Injury Death by Age Group and Race/EthnicitySelf-Inflicted Injury Leading to Death (2002-2013 –Figure 10) Birth to Females 15-17 Years (2002-2013 –Figure 11) Stanislaus County Death Due to Alcohol/Drugs by Race/Ethnicity Stanislaus County Death Due to Alcohol/Drugs by Age Group10111112(2006-2016 –Figure 12/13) Status Offense Arrests Under 18 Years of Age (2007-2016 –Figure 14)12Conclusion13References14Developed by CAPE: Community Assessment Planning and Evaluation Section, Division of Public Health; Sept 20171
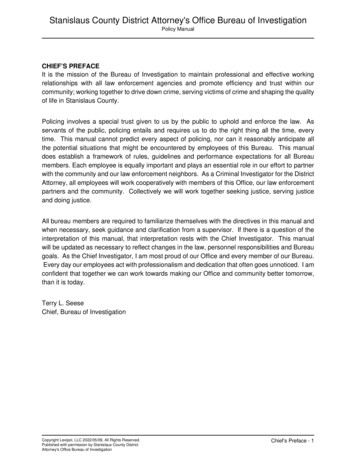
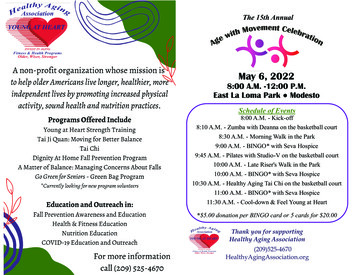
DemographicsEach year, in Stanislaus County, there are over 7,500 births and over 140,000 children under 18years of age. Out of these, about 50-51% are female while 49-50% are male. About 56% of childrenin Stanislaus County are of Hispanic/Latino origin, 35% are White, 5.2% Asian and 2.5% Black (1).Figure1. Number of Births per YearCalifornia versus Stanislaus County 2002-2013Number of 92010201120122013Stanislaus County 7,5927,579YearCalifornia529,241 540,818 544,685 548,700 562,144 566,089 551,529 526,744 509,939 501,994 503,763 494,392CaliforniaStanislaus CountyPopulationFigure2. Stanislaus County Under 18 Years by Sex 00920102011201220132014FEMALE 71,510 72,977 73,943 74,932 75,547 76,417 76,861 77,285 77,040 75,974 75,562 74,711 74,215 73,574 73,258MALE68,033 69,368 70,398 71,264 71,699 72,396 72,732 73,050 72,809 71,629 71,292 70,776 70,504 70,029 69,952YearFEMALEMALEDeveloped by CAPE: Community Assessment Planning and Evaluation Section, Division of Public Health; Sept 20172
Figure 3. Stanislaus County Under 18 Population 10201120122013201415 to 17 years 6825,46026,12526,05325,76125,35924,92924,50410 to 14 years ,21441,73441,11040,43840,27740,18740,0605 to 9 34840,35239,89540,00739,96240,17240,18440,063Under 5 years ,82339,85139,68439,32638,91138,30338,583Under 5 years5 to 9 years10 to 14 years15 to 17 yearsPopulationFigure 4. Stanislaus County Under 18 Population by Race/Ethnicity 2000-201425,00020,00015,00010,0005,0000Under 5 5 to 9Age in Years10 to1415 to17Under 5 5 to 9WHITE20002001200210 to1415 to17Under 5 5 to 9HISPANIC200320042005200610 to1415 to17Under 5 5 to 9BLACK200720082009201015 to17ASIAN/PERCIFIC ISLAND20112012Developed by CAPE: Community Assessment Planning and Evaluation Section, Division of Public Health; Sept 2017310 to1420132014
FamilyStanislaus County is made up of 172,881 households. About 76% of the households are FamilyHouseholds comprising of an average of 3 family household members. The percent ofgrandparents responsible for grandchildren under 18 years is 24% (2).The per capital income of Stanislaus County is 24,331, the mean family income is 79,852, whilethe mean household income is 73,567 compared to the mean household income in California 96,961 (2).Sixty one (61%) of the population over 16 years is the Civilian Labor Force (55% of these areemployed while about 6% are un-employed). A total of 39% of the population over 16 years arenot in the Labor Force. However, the unemployment rate of Stanislaus County is 10.4%, whilethat of California is 6.5% (2).Ten percent (10%) of all families in Stanislaus County have lived with incomes below the povertylevel over the past 12 months. About Twenty five percent (25%) of families with femalehouseholder and no husband present, lived over the past 12 months with income below thepoverty level, compared to 24.5% in California (2).In Stanislaus County, 94% of the population with food insecurity live under 200% federalpoverty level and are eligible for Nutrition Assistance under: Women, Infants, and Children -WIC, Free School Meals Supplemental Nutrition Assistance Program -SNAP, Commodity Supplemental Food Program -CSFP, The Emergency Food Assistance Program -TEFAP.About 95% of the population in Stanislaus County have some form of Health Insurance coverage(58% Private and 48% Public), compared to 92% in California (63% Private and 39% Public orcombined). Only 5.2% of the population in Stanislaus County report no health insurancecoverage, compared to 7.3% in California (2).Developed by CAPE: Community Assessment Planning and Evaluation Section, Division of Public Health; Sept 20174
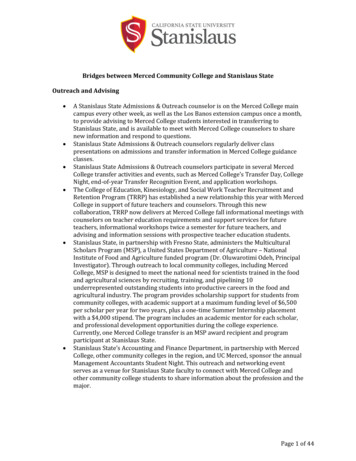
EducationIn Stanislaus County, 109,513 students enrolled for the 2016-2017 school year. About 59% ofthese children are of Hispanic/Latino ethnicity, 27% are White, 5% of Asian origin, 3% are Black,3% are Multi-Race, and all other including none- responders add up to 3% (3).An overview of the English Proficiency of students across grades show an estimate of 37% to 45%as either English learners (EL), Re-Classified as Fluent English Proficient (RFEP), or Initial FluentEnglish Proficient (IFEP).An 11% to 38%, estimate of children who are English learners are in the crucial reading grades,including Kindergarten to grade 5. More children in Grades 6 to grade 12 are re-classified asfluent in English –RFEP (3).Looking at 12TH grade graduates and assessing the number of students who completed all coursesrequired for University of California and or California State University entrance for 2015/2016 byrace and ethnicity, we find 38% of White students, 30% of Hispanic/Latino, 57% of Asian, 27%Black, and 36.9% Multi-Race students have completed these courses and are ready for university(3).Education attainment is one of the most important indicator, index or proxy for income estimateand economic potential of the population. In Stanislaus County, 2016 Education Attainment datashow an estimate of about 33% of the population have either a Bachelor degree (21%) or aGraduate or Professional degree (12%). The other 67% of the population either have an associatedegree (8%), have had some college classes but no degree (21%), are High School graduates orhave an equivalent certification (21%), completed 9th grade to 12th grade with no diploma (8%)or have less than 9th grade education (10%) (3).Developed by CAPE: Community Assessment Planning and Evaluation Section, Division of Public Health; Sept 20175
Table 1. 2016-2017 Enrollment by Ethnicity and AmericanAmericanIndian orAlaskaNativeAsianFilipinoHispanic orLatinoPacificIslanderWhiteTwo orMore RacesTotal2,9335324,45095565,10077729,782Developed by CAPE: Community Assessment Planning and Evaluation Section, Division of Public Health; Sept 2017690
Percentage (%)Figure 5. Stanislaus County School English Proficient Statusby Grade 2016-2017 2%59%59%58%58%57%56%55%55%56%58% 100% 54%Grade 36%English Only (EO)English Learner %Reclassified Fluent English Proficient l Fluent English Proficient (IFEP)0%1%1%1%1%1%1%2%2%2%2%5%5%0%1%Figure 6. 12th Grade Greaduates Completing All CoursesRequired for U.C or CSU Entrance 2015-2016 by Race/EthnicityPercentage canIndianI/ANAsianPacific 7.20%38.20%56.70%30.30%26.60%38.20%36.90%Developed by CAPE: Community Assessment Planning and Evaluation Section, Division of Public Health; Sept 20177
Figure 7. Stanislaus County Education Attainment Percentage, 2016Percent Graduate or professional degree12%EducationPercent Bachelor's degree21%Percent Associate's degree8%Percent Some college, no degree21%Percent High school graduate (includes equivalency)21%Percent 9th to 12th grade, no diploma8%Percent Less than 9th grade10%05101520Percentage (%)Developed by CAPE: Community Assessment Planning and Evaluation Section, Division of Public Health; Sept 2017825
Child and AdolescentHealthOn average, the rate of Child Death in California using the two year interval period from 2002 to2013 is about 12.4 per 100,000 population. Stanislaus County has a higher rate of 15 per 100,000(4).The top causes of child death are congenital anomalies, cancer, infectious/non-infectiousdisease, and injury. Most of these causes are preventable. More Un-intentional Child Deaths areseen among 0-4 year olds and 15-19 year olds, while Self-Inflicted Child Deaths are seen more inages 15-19 years (4).Some risk behaviors seen among female children ages 15-17 years include pregnancy and birthrates. Although these rates of child birth has generally decreased among teenagers over theyears, Stanislaus County still reflect a higher rate than California among Hispanic/Latino ethnicityand a lower rate than California among white 15-17 year olds (4).An estimated 2% of deaths due to alcohol or drugs is seen among children under 19 years; 64%among ages 0-4, 29% among ages 15-19 years and 7% is seen among 10-14 year olds (4).Child Death Rateper 100,000Figure 8. Number of Child Death Ages 5-14 Years per 100,000Population California versus Stanislaus County anislausCaliforniaYear 2013California15.013.613.011.910.510.4Stanislaus County17.415.017.98.514.916.2Developed by CAPE: Community Assessment Planning and Evaluation Section, Division of Public Health; Sept 20179
Number of Child DeathsFigure 9. Stanislaus County Un-intentional Injury Deathsamong 0-19 Years by Race/Ethnicity 2000-2013180160140120100806040200Race/Ethnicity WhiteHispanicBlackAsian15-19 Years74844010-14 Years1516315-9 Years715100-4 Years425193Figure 10. Stanislaus County Self-Inflicted Injury Deathsamong 0-19 Years by Race/Ethnicity 2000-2013Number of Child Deaths302520151050Race/Ethnicity WhiteHispanicBlackAsian15-19 Years19130110-14 Years65015-9 Years00000-4 Years0000Developed by CAPE: Community Assessment Planning and Evaluation Section, Division of Public Health; Sept 201710
Figure 11. Stanislaus County Birth Rate per 1,000 Femles Ages15-17 Years 2002-20135040Stanislaus3020Stanislaus HispanicCalifornia10Stanislaus anislaus County2010White201120122013HispanicNumber of DeathsFigure 12. Stanislaus County Death Due to Alcohol and Drugs byRace/Ethnicity, 92010201120122013YearWhiteBlackHispanicAmerican IndianAsian/PIDeveloped by CAPE: Community Assessment Planning and Evaluation Section, Division of Public Health; Sept 201711
Figure 13. Stanislaus County Death Due to Alcohol and Drugs byAge Range, 2006-20131.73% Under 19 Years98.27%Over 19 YearsFigure 14. Stanislaus County Status Offenses Arrestsof Ages Under 18 years, 2925169630WhiteBlackHispanicOtherDeveloped by CAPE: Community Assessment Planning and Evaluation Section, Division of Public Health; Sept 201712
ConclusionAll child deaths are preventable. Prenatal care reduces the rate of stillbirths, immunizations prevent many childhood diseases, and parentingclasses reduce injury among 0-4 year olds.A higher rate of self-inflicted injuries and un-intentional injuries causingdeath is seen among children ages 15-19 years in Stanislaus County.These are also preventable injuries and suggest that there is a great needfor mentors, counselors and mental health/para-health professionalservices among pre-teens, as a preventive measure.In order for the graduation rates in Stanislaus County to improve, thereneeds to be immersion programs that will help children catch up onEnglish Language, which is vital to their ability to read, followinstructions and be successful in school.These are good children and they deserve the best!Developed by CAPE: Community Assessment Planning and Evaluation Section, Division of Public Health; Sept 201713
REFERENCES#1)TopicsDescription and WebsiteDemographics (2016 Data)U.S. Census Bureau, CensusBirth and Death (VitalRecords)State of California, Department of Health Services: Center for HealthStatistics, Birth Records, and Vital Statistics Query System(2014 ital-Records.aspxVia University of California, San Francisco: Family Health Outcomes -county-mcah-data2)Income (2016 Data)http://www.census.govHousing (2016 Data)State of California, Department of Finance 1970-2050 PopulationPoverty (2016 Data)Education Attainment (2016Data)Projections by Age, Sex, and Race/Ethnic DetailSocial Norms (2016 Data)Access to Health Care (2016Data)Nutrition Assistance (2015Data)2016 American Community programs-surveys/acs/Feeding n-each-state.html3)WestEd, California Healthy Kids Survey, Office of Educationhttps://www.wested.org/area of work/literacy/Education (2016/2017 Data)California Department of Education -Data and Statisticshttp://www.cde.ca.gov/ds/State of California, Department of Education, Data Reporting Officehttp://data1.cde.ca.gov/dataquest/4)Injury (2013 Data)Self-Inflicted Injuries (2013Data)5)Alcohol /Drugs (2013 Data)Substance Abuse/Crime(2013 Data)State of California Department of Health Services, Epidemiology andPrevention for Injury Control Branch, California Injury Data tance Abuse/CrimeState of California Department of tics/arrestsJuvenile Arrests California Department of Justice, Criminal Justice StatisticsCenterhttps://oag.ca.gov/crimeDeveloped by CAPE: Community Assessment Planning and Evaluation Section, Division of Public Health; Sept 201714
Stanislaus County 7,929 8,020 8,061 8,445 8,728 8,826 8,549 7,941 7,804 7,737 7,592 7,579 . On average, the rate of Child Death in California using the two year interval period from 2002 to (4). Stanislaus . Developed by CAPE: Community Assessment Planning and Evaluation Section, Division of Public Health; Sept 2017 .