Transcription
Back to Our Common FutureSustainable Development in the 21st century (SD21) projectSummary for policymakers
About SD21This is a summary of the main findings “SustainableDevelopment in the 21st Century” (SD21) project. Itdraws on a series of studies that were prepared undera United Nations project, co-funded by the EuropeanCommission. The project also intended to prepare asubstantive contribution to the debate at the UnitedNation Conference on Sustainable Development(UNCSD or “Rio 20”) in 2012, which takes stock ofthe changes having occurred since the Earth Summitin 1992, and provides a clear vision and way forwardfor the international community, national governments,partnerships and other stakeholders in implementingthe sustainable development agenda in an integratedmanner.This summary takes a step back from the many initiativesof the past 20 years in terms of sectoral assessments,scenario exercises, strategies and reports linkedwith sustainable development, green economy andgreen growth, in order to analyze them under the twinimperatives of long-term sustainability and developmentimperatives. Throughout, it provides an entry point tomore detailed analysis and findings contained in thetechnical reports produced under the project. Thosereports are available from the UN website.1The approach to SD21 is based on the idea that forsustainable development to progress, its politicalnature has to be recognized. Decisions and courses ofactions that are chosen every day by governments andinternational institutions are ultimately the outcomesof confrontations of different “world views” – reflectingdifferent visions and interpretations of principles such aseconomic efficiency, equity, solidarity, empowerment,and justice, different views regarding how sustainabledevelopment should be pursued, and different viewson the means through which specific issues (e.g.food security, climate change mitigation) should beaddressed. Often, agreed courses of actions reflect a“mix” of different world views, sometimes resulting ininconsistencies and incoherence. Difficult issues aretypically left “under the rug” for the benefit of reachingpolitically palatable consensus, resulting in watereddown blueprints that do not address systemic issues.In order to reflect a broad range of views on sustainabledevelopment issues, the SD21 project instituted anexpert process to support informed policy discussions.The working tracks created under the project mobilizedindividual experts and institutions from a broad range ofperspectives and backgrounds. More than 70 leadingexperts participated in the discussion on food and1iiiagriculture. The analysis of sustainable developmentscenarios was a collaborative effort of 49 globalmodellers and scenario analysts. The studies on energysystems, land use and cities were based on inputs fromlarge and diverse groups of experts.SD21 has also encouraged a range of studiesundertaken outside of the project by leadingresearchers, analysts, think-tanks, and other internationalorganizations, in support of UNCSD. Those studiesprovide particular perspectives and specializedinformation on a wide range of important issues. Thepresent summary will help policy makers, analystsand the interested public alike to better understandthe context of these other reports, including the waysin which their recommendations can or cannot becombined for informed decision-making.This summary does not seek to be normative orprescriptive. Instead, it brings together salient scientificand political facts and illustrates important issuesthat would need to be addressed going forward. Inother words, it provides a frame of analysis againstwhich other, more normative or prescriptive reportscan be read. This will hopefully help forge a betterunderstanding and help overcoming the current gridlockon most divisive issues.This summary also illustrates how identifyingcommonalities and differences and working on ways toaddress them may not only be a necessary condition forprogress in some cases, but also a promising way forconcerted action.This summary presents selected findings from theSD21 study reports.Food and agriculture: the challenge of sustainabilityAssessment of implementation of Agenda 21Assessment of implementation of the Rio PrinciplesChallenges and ways forward in the urban sectorBuilding a sustainable and desirable Economy-inSociety-in-NaturePerspectives on sustainable energy systems for the21st centuryLessons learned from sustainable developmentscenariosSustainable land management for the 21st centuryAll the reports are accessible at http://www.un.org/esa/dsd/dsd sd21st/21 reports.shtmlhttp://www.un.org/esa/dsd/dsd sd21st/21 reports.shtmlBack to Our Common Future
In summary: We need a renewedpolitical dealHumanity has not progressed on the road tosustainability as far as hoped in 1992. We can celebratesome notable successes, in particular the fact thathundreds of millions of people have been lifted frompoverty during the last two decades. Yet, many of theglobal problems we are facing today are more acute orlarger in scale than they were in 1992.Science and scenario modelling make it clear that if wedo not change course, the next 40 to 80 years promisea future that may be deeply unpalatable for most ofus. Even if we succeeded in pushing our technologicalcapabilities to the utmost, without doing something else,in a few decades we are likely to end up in a world thatwould offer reduced opportunities for our children andgrandchildren to flourish.Many of the outcomes that matter for sustainability– from poverty to access to education to carbonemissions to air pollution – happen at the national andlocal levels and are influenced by rules, processes,happening at those levels. However, increasingly moreof these outcomes are determined by the rules thatgovern the global economic engine, from investment ofcapital to trade to financial markets; by the mechanismsof international assistance among countries and theresources related to them; and by the way our globalcommons are managed.Many resources on which we depend for survival andflourishing – oceans, atmosphere, climate regulationsystems – are, whether we like it or not, commonresources. We all lose when they are degraded ordisappear. All our individual actions and national actionsadd up to determine what happens to our common planet.Hence, as foreseen by the Brundtland report 25 yearsago, many of our problems are common: no party cansolve them in independence from the others. Therefore,common action is needed.The political deal that emerged from the EarthSummit in 1992 has, for various reasons, neverbeen fulfilled. Neither the expected outcomes –elimination of poverty, reduction in disparities in standardof living, patterns of consumption and production thatare compatible with the carrying capacity of ecosystems,sustainable management of renewable resources – northe agreed means to achieve them, have materialized.To many, the deal from 1992 does not adequatelyreflect the changed geo-political realities ofBack to Our Common Futuretoday’s world. In the last two decades, the worldhas changed. New economic powers have emerged,while the interdependence of national economies hasgrown. We have become increasingly dependent ongrowing energy consumption and international trade.The importance of the private sector in influencingsustainability outcomes globally has grown. Wehave largely failed in adjusting international rules andinstitutional structures to these old but mountingchallenges and to this new situation.Opinions may differ on whether our currentframework for action was never fully put to thetest due to lack of political will or whether it wasinsufficient to succeed. The fact is that we have notsucceeded.For these reasons, a new political deal is needed,which provides a clear vision and way forward for theinternational community, national governments, theprivate sector, civil society and other stakeholders foradvancing the sustainable development agenda in anintegrated manner.A renewed political deal would need to address at leastthe following critical elements: What critical thresholds must not be passed in termsof poverty, global inequalities, global environmentallimits, and global stocks of common-use renewableresources? What do we need to develop and what do we need tosustain? What necessarily needs to be done in common, andwhat is best left for countries and lower levels ofgovernments to decide? How do we adjust institutions, decision-makingprocesses, and the mechanisms of management ofour global commons to more fairly reflect the neweconomic and geopolitical order? What common goals do we set for accomplishmentby the global community? What solidarity mechanismsmust be put in place to achieve those common goals? How to coordinate and enforce actions andcommitments at all levels so that they not only “addup” to keep humanity on a safe track, but also ensurethe renewed deal can be trusted by all more than theoriginal Rio deal?When a deal that is commensurate with the problemswe face today and those even greater that we will facetomorrow will materialize is unclear. What is certain isthat a deal will be needed at some point in the future.In the long term, the alternative is conflict over scarceresources in an impoverished world – one none of usshould want to see materialize.iii
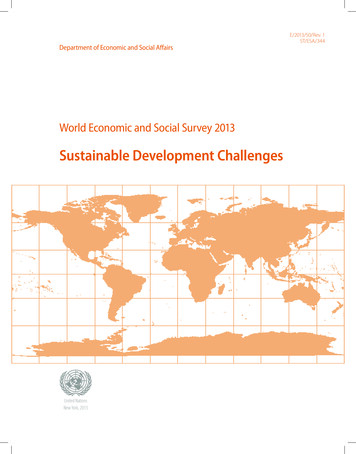
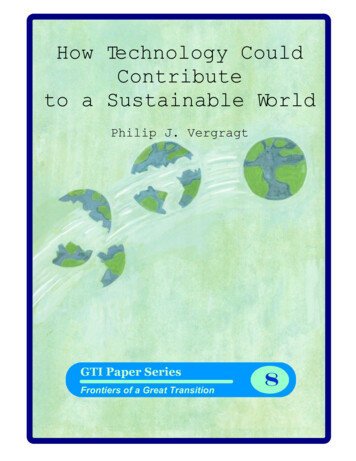
Where are we today?At the highest level, a yardstick by which to judge thesuccess of sustainable development since Rio is abroad examination of the main trends having affectedenvironment and development at the global levelsince 1992. These issues have been the subject of anenormous amount of literature coming from all circles,from academia to civil society organizations to thinktanks and national and international developmentinstitutions. Broad assessments such as the MillenniumEcosystem assessment, IPCC reports, and yearly reportson the status of the Millennium Development Goalsprovide ample data allowing one to assess what hashappened on these two fronts during the last decades.The record on development since 1992 hasbeen mixedSince 1992, human development has seen progress ona global level. Some countries have developed rapidly.Progress has been registered in access to education,on the health front, and in access to basic servicessuch as water and sanitation. Areas of progress alsoinclude increased access of citizens to information andincreased participation in decision-making, human rights,indigenous peoples, and gender equality.However, numerous gaps remain on the developmentagenda. Poverty has not been eradicated. Indeed, if Chinais taken out of the statistics, the absolute number of poorFigure 1 – Trend in number ofundernourished people, 1970-2010(whatever definition is used) has remained more or lessstable since 1990, with marked regional differences. Basicfood insecurity concerns as many people, about 1 billion,as it did in 1970. Income inequality is growing, both acrossand within countries. Close to 43 million people worldwideare displaced because of conflict or persecution. Overall,the Millennium Development Goals (MDGs), a set of goalsthat the international community set for itself in 2000, arenot on track to be achieved in 2015 as contemplated.Global environmental problems havebecome more acuteAt the same time, at the global level, the impacts ofthe human enterprise on the environment have beenincreasing. Many resources on which humanity dependsfor survival are witnessing trends that, if continued, wouldlead to depletion or collapse. 80 percent of fish stocksare estimated to be used at or beyond capacity, and thefigure has been increasing since four decades at least.Deforestation, although curbed during the past decade,has continued. What is known of the loss of biodiversitypoints to our current inability to limit it, with the currentrate of species extinction being estimated by some to be100 to 1000 times higher than in pre-industrial times andtwo orders of magnitude above a safe level for humansin the long term. Some of the major ecosystems suchas oceans are thought by scientist to be approachingdangerous thresholds that could trigger massive collapse.Current rates of ocean acidification in the Atlantic andPacific oceans exceed those experienced in the lastglacial termination by a factor of 100.Progress on improving literacy, 1990-200965Sub-Saharan Africa10502009100073Southern Asia 01995-97750Source: FAO, 2011.198019902000939297South-Eastern Asia94Eastern Asia959899Caucasus & Central Asia100Developed regions1006019708987Western AsiaLatin America & the Caribbean1979-812000-0217568Northen Africa85072Oceania7080901002010Source: UNDESA, Millennium Development Goals Report 2011Back to Our Common Future
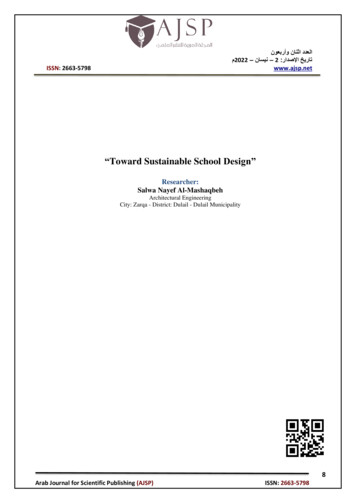
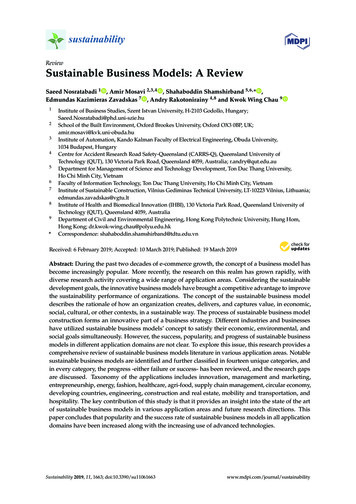
Where are we today?Figure 2 – Long-term trends in CO2 concentrations, and state of marine fisheriesCO2 concentrations400Fish stocksAtmospheric CO 2 at Mauna Loa Observatory10080Parts per 0002010YearSource: NOAA, 2012.In summary, while the “development transition” is still tobe achieved at the global level, the impacts of humanactivity on the global environment have worsened. Bythis broad criterion, one may say that the transition tosustainable development has not been successful.We are getting closer to global ecologicallimitsIn recent years scientists have devoted time to identifywhat is referred to as planetary limits or boundaries,denoting sets of limits or thresholds that define a “safeoperating space” for humanity. For example, in 2009J. Rockström and colleagues reported that at leastthree planetary boundaries had already been breached,including those related to anthropogenic interferencewith the climate system, biodiversity, and the nitrogenand phosphorus cycles. Some studies have concludedthat the size of the current global agricultural system hasalready outstripped safe boundaries for land use change.Back to Our Common Future1985Overexploited Depleted RecoveringUnderexploited Moderately exploited19952008Fully exploitedSource: UNDESA, Millennium Development Goals Report 2011.Even though the definition of such thresholds, thenumber of relevant limits, and the way they correlate witheach other are not yet fully understood and are subjectto scientific and political debates, the consequencesof trespassing some of them such as greenhouse gasconcentrations in the atmosphere have been explored atan increasing level of detail. Whatever the “real” relevantthresholds may be, and whatever the “acceptable”level of risk that we collectively may want to selectwith respect to trespassing them, all the scientificassessments point to humanity as a whole getting closerto the limits, in some cases at accelerating speed.2
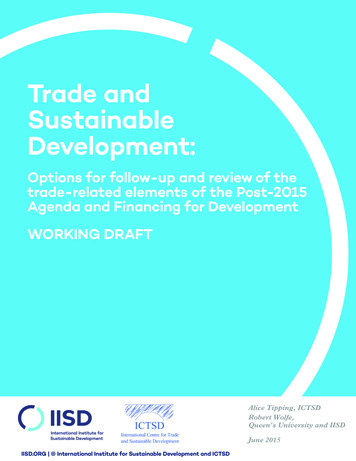
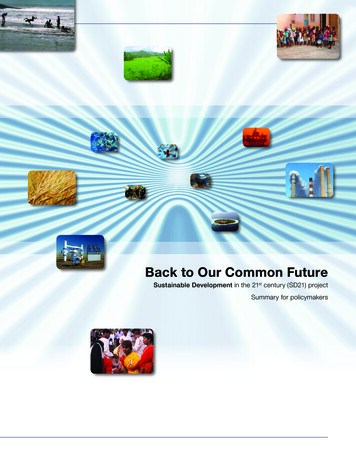
How did we get there?Figure 3 – Long-term trends in material use and energy consumptionMaterial useEnergy80Source: F. Krausmann et al. (2009), Growth in global materials use,GDP and population during the 20 th century, Ecological Economics,68, updated to 2009.At the global level, the impacts of the human enterpriseon the environment are increasing. By historicalstandards, the path from an “empty” to a “full” world hasbeen remarkably swift. Most of the expansion took placein the last century in what has been called the “greatacceleration.” In the 20 th century, a 4-fold increase inhuman numbers was accompanied by a 40-fold increasein economic output and a 16-fold increase in fossil fueluse, along with a 35-fold increase in fisheries catchesand a 9-fold increase in water use. Carbon dioxideemissions increased 17 times, sulphur emissions by13 and other pollutants by comparable amounts. Globalprimary energy use, carbon emissions, biodiversityloss, nutrient loadings, deforestation, global fossil waterextraction are all still increasing.The impact of human activity on the environment (the“environmental footprint”) is the product of populationsize, its level of affluence and structure of consumption,and a technology factor which measures the impact (e.g.pollution) associated with each dollar of GDP createdin the production process. At the macroeconomic level,changes in environmental impacts can be related tochanges in these variables.3OilCoal250Biomass and 0193019200191001900 1910 1920 1930 1940 1950 1960 1970 1980 1990 2000Natural dern renewable electricity:wind, solar, geothermal, etc.1860504501850Billion tons60Primary energy (EJ)70500Construction mineralsOres and industrial mineralsFossil energy carriersBiomassSource: A. Grübler, 2008, “Energy transitions.” in Encyclopediaof Earth.Over the last five decades, both affluence andpopulation have increased rapidly, each being aboutequally responsible for the overall five-fold growth inthe economy. In recent years, the affluence factor hasexceeded the population factor in driving growth. Butboth are clearly important in explaining the increase ofhuman footprint.Since the Earth Summit, private consumption has growntremendously. In many emerging countries, middleincome groups have been growing fast, contributing tothe rapid emergence of a global “consumer class” whoseconsumption choices tend to follow patterns observedin developed economies. In rapidly developing countries,the trends in consumption are set up by their fastgrowing cities. Many large cities of the developing worldnow appear comparable to cities in developed countriesas far as carbon emissions and resource consumptionare concerned – so far, there is no clear evidence thatthe impacts of urbanization on consumption patterns aregoing to be substantially different in newly urbanizingcountries from what they are in OECD countries.Back to Our Common Future
How did we get there?On the other hand, examples of efficiency gains abound.For example, global primary energy efficiency hasincreased by a third since 1980. The carbon intensity ofeach dollar of economic output has fallen by about thesame amount.However, historically, reductions of impacts throughimproved technology have been insufficient tocounterbalance increases linked with those in populationand affluence. For example, between 1990 and 2007carbon intensities have declined on average by 0.7%per year. Population has increased at a rate of 1.3% andaverage per capita income has increased by 1.4% eachyear (in real terms) over the same period. Efficiency hasnot even compensated for the growth in population, letalone the growth in incomes. Instead, carbon dioxideemissions have grown on average by 2% per year,leading to a 40 percent increase in emissions between1990 and 2007.The unrelenting growth in resource consumption sincethe beginning of the 20th century, when data becomemeaningfully available, largely reflects “rebound effects” –energy or resources saved through more environmentallyfriendly products or services are used in additionalconsumption.To date, Government actions at all levels to limit thenegative impacts of human activities on the ecosystemhave strongly focused on technology. Populationhas proved difficult to fully address in a coordinatedway among nations. Income growth has been thestated objective of all development policies includingthose focused on poverty eradication, and is seen asindispensable. Directly influencing consumption patterns,which together with income determine the “affluence”factor of environmental impacts, has also been consideredundesirable as a policy goal in many countries.In practice, the reluctance or practical difficulty to addressa range of issues related to population and affluencehas left technology as the main policy lever of focusin the sustainability debate. In such a growth-focusedperspective, absolute decoupling is necessary to achievesustainability. Hence, policy efforts have focused onenhancing and accelerating technological progress, inparticular in terms of efficiency and pollution reduction.Actual progress in technology performance at the globallevel has fallen short of such ambitions. While over thelong run increasing eco-efficiency of technology use hasgreatly reduced the amounts of resources consumedand pollution produced per unit of output, absoluteamounts of consumption and pollution have continued toincrease unsustainably.The scope of current national and global policies andtechnology programmes does not “add up” to thescale of actions required, calling for a reality check ofcurrent plans. For example, the goal of establishing arenewable low-carbon energy technology system on aglobal scale remains elusive, with modern renewablesjointly accounting for 0.7 per cent of primary energy,compared to fossil fuels’ share of 81 per cent in 2008.Global CO2 emissions have increased considerablyfaster in the 2000s than in previous decades. Despitenational and international efforts to accelerate anddirect energy technology change, the pace of the globalenergy and fuel transitions has slowed significantlysince the 1970s.What is “decoupling”?The concept of ‘decoupling’ refers to the processby which economic output becomes progressivelyless dependent on material throughput, resourcesand energy as production processes are mademore resource or energy efficient. Relativedecoupling refers to a decline in the ecologicalimpact per unit of economic output. The situation inwhich resource impacts decline in absolute terms iscalled absolute decoupling.Back to Our Common Future4
What can be expected frombusiness as usual?No one knows which path the world will take in the next40 years. But there has been an impressively strongconsensus among experts about the major sustainabilityissues and the broad direction of trends. In contrast,big differences exist on the suggested policy solutionsarising from different world views, grounded in differentvalues.Many “business-as-usual” (BAU) scenarios haveexplored the potential consequences of the worldcontinuing its dominant development model. Most recentscenarios of this type are “dynamics-as-usual” (DAU)scenarios that assume across the board incrementalimprovements following past dynamics. In principle,these scenarios are the closest to future projections.They provide a sketch of what the world could look likein 2050, if we continued the historical path of incrementalimprovements in reaction to perceived crises, insteadof a shift toward a long-term perspective that aims toanticipate the troubles ahead.How have DAU scenarios performed inretrospect?Mainstream DAU scenarios developed in the 1990sgreatly underestimated actual global economicgrowth and energy demand, and overestimatedthe rate of technology change. On balance, theyprojected lower environmental pressures thanactually occurred. For example, actual GHGemissions in the 2000s followed the highestscenario contained in the set of IPCC-SRESscenarios created in 1997 and published in 2001,much higher than its DAU scenario.The description in this section is based on work done forRio 20, in particular by the OECD and PBL. More detailsare provided in the SD21 scenario report.This DAU world in 2050 is one of high materialconsumption by 6 billion people in both “North” and“South”, which coexists with another 3 billion peopleliving in poverty. By its sheer scale, human activitywill have transgressed the majority of the planetaryboundaries as defined by J. Rockström and colleaguesin 2009, with unknown effects but increasing the longterm risk of global collapse of the ecosystem. The effectsof such potential collapse are not included in any ofthe mainstream scenarios. Similarly, the models do notaccount for the consequences of potential price shocks5and supply disruptions that might result from increasedcompetition for resources, such as a collapse of globalfish stocks. Hence, the picture they paint is likely anoptimistic view of the consequences of continuing as inthe past.People in 2050A more crowded, urban world. World population willbe 9.2 billion in 2050, 2.2 billion higher than today, withmost of the increase in South Asia, the Middle East andAfrica. Urbanization will reach 70%, implying an increaseof 2.8 billion people in urban areas, compared to adecrease of 0.6 billion in rural areas.Persistent poverty and hunger amid riches. Greatprogress is expected for another 2 billion people beinglifted from poverty and hunger. As in recent decades,such progress will be fast enough to compensate for thegrowing world population, but leave roughly as manypeople extremely poor (almost 3 billion people living onless than US 2 per day) as today. The number of peoplegoing hungry will likely be reduced by 500 million people,still leaving 250 million with insufficient food intake.One billion people without access to basicservices. More than 240 million people, mostly in ruralareas, will remain without access to improved watersource, and 1.4 billion people without access to basicsanitation. Child mortality from diarrhea, caused byunsafe water supply and poor sanitation, will decrease,but Sub-Saharan Africa will lag behind. In 2050, there willstill be some 1.8 billion people without access to modernenergy services for cooking and heating, down from 2.75billion in 2010.Universal primary and secondary education for all.Great progress is expected on making not only primary,but also secondary education universal, with womenmost likely accounting for most of the higher-leveldegrees world-wide in 2050.Economy in 2050Global middle class in a US 300 trillion worldeconomy. Gross world product quadruples to US 300trillion in 2050, with Brazil, Russia, India, China andSouth Africa (BRICS) alone accounting for 40% of theworld economy. Income convergence across countriescontinues rapidly. Average GDP per capita is expectedto triple to US 33,000 in 2050, a level similar to OECDcountries today. In OECD countries GDP per capita isexpected to double. GDP per capita in BRICS wouldquintuple to US 37,000 in 2050. However, some ofthe most vulnerable and poorest economies remainmarginalized.Back to Our Common Future
What can be expected from business as usual?An energy-hungry, fossil-fueled world. Globalprimary energy use increases by 80%, with a fairlystable mix of fossil fuels (85%), modern renewablesources (10%), and nuclear energy (5%). Rapid energyefficiency and intensity improvements will continue to beoutstripped by energy demand. Demand for bioenergywill increase by 35% by 2035. A large share of the newarea for production of feedstock will come from clearingforests and conversions of pastureland. Food prices arelikely to increase. National energy security is expected todecrease for most countries, especially the large Asianeconomies.A thirsty world. Results from integrated assessmentsindicate rapid and significant increases in water demandfrom all economic sectors. Competing demands willpose increasingly difficult allocation problems and limitthe expansion of key sectors, in particular food andagriculture.Nature and life support in 2050Two thirds of world population living under waterstress. In 2050, a whopping 3.9 billion people (morethan 40% of world population) will live in river basinsunder severe water stress, and 6.9 billion people willexperience some water stress. Groundwater continuesto be exploited faster than it can be replenished and isalso becoming increasingly polluted. Surface water andgroundwater quality is stabilized and restored in mostOECD countries, whereas it deteriorates in developingcountries. The number of people at risk from floodsmight increase by 400 million to 1.6 billion, with the valueof assets at risk almost quadrupling to US 45 trillion.Global deterioration of urban air pollution, butfewer deaths from indoor air pollution. Urbanair quality will continue to deteriorate globally, withconcentrations in many cities far exceeding acceptablehealth standards. Premature deaths from exposure toparticulate matter might double to 3.6 million per year,SO2 emissions increase by 90% and NOx emissions by50%. This is despite continued declines in SO2, NOxand black carbon emissions in developed countries.Yet, there will be fewer premature deaths from indoor airpollution after 2020.Back to Our Common FutureFewer forests, more land for agriculture until2030, then reversed trends. Agricultural landarea is expected to increase until 2030, intensifyingcompetition for land, and might decline thereafter, in linewith declining population growth and agricultural yieldimprovements. Deforestation rates most likely continue todecline, especially after 2030, but most primary forestsmight be destroyed by 2050, even if zero net forest losswere to be achieved after 2020.Accelerated increase in GHG emissions and globalwarming. GHG emissions are expected to increaseat an accelerated rate at least until 2030, leading to anincrease from 48 to 83 GtCO2-e from 2010 to 2050.Most of the GHG emissions increase will be due tolarge emerging economies. This is despite expecteddecreases in LULUCF emissions from 2040 onwards.Atmospheric GHG concentrations might reach about 685ppmv (CO2-e), eventually leading to a 3-6 C warming.Unabated loss of biodiversity. Biodiversity isexpected to decline by at least 10%, with the highestlosses in Asia, Europe, and Southern Africa. Pressurefrom invasive alien species will increase.Collapse of ocean fisheries. Although they are notincluded in mainstream scenario exercises, there isevidence that continued overfishing beyond maximumsustainable yield, together with ocean warming andacidification, eutrophication, habitat degradation, anddestruction of coral reefs, might lead to a global collapseof ocean fisheries based on “wild catch”, with efforts toreplace by aquaculture-based fisheries.Human interference with phosphorus and nitrogencycles well beyond safe thresholds: Eutrophication ofsurface water and coastal zones is expected to increasealmost everywhere until 2030. Thereafter, it mightstabilize in developed countries, b
Assessment of implementation of Agenda 21 Assessment of implementation of the Rio Principles Challenges and ways forward in the urban sector Building a sustainable and desirable Economy-in-Society-in-Nature Perspectives on sustainable energy systems for the 21st century Lessons learned from sustainable development scenarios