Transcription
FinalReportUniversity Transportation Research Center - Region 2Techniques for Ef icient Detection ofRapid Weather Change and Analysis oftheir Impacts on a Highway NetworkPerforming Organization: State University of New York (SUNY)October 2017Sponsor:University Transportation Research Center - Region 2Federal Highway Administration/U.S. Department of Transportation
University Transportation Research Center - Region 2The Region 2 University Transportation Research Center (UTRC) is one of ten original UniversityTransportation Centers established in 1987 by the U.S. Congress. These Centers were establishedwith the recognition that transportation plays a key role in the nation's economy and the qualityof life of its citizens. University faculty members provide a critical link in resolving our nationaland regional transportation problems while training the professionals who address our transportation systems and their customers on a daily basis.The UTRC was established in order to support research, education and the transfer of technologyin the ield of transportation. The theme of the Center is "Planning and Managing RegionalTransportation Systems in a Changing World." Presently, under the direction of Dr. Camille Kamga,the UTRC represents USDOT Region II, including New York, New Jersey, Puerto Rico and the U.S.Virgin Islands. Functioning as a consortium of twelve major Universities throughout the region,UTRC is located at the CUNY Institute for Transportation Systems at The City College of New York,the lead institution of the consortium. The Center, through its consortium, an Agency-IndustryCouncil and its Director and Staff, supports research, education, and technology transfer under itstheme. UTRC’s three main goals are:ResearchThe research program objectives are (1) to develop a theme based transportation researchprogram that is responsive to the needs of regional transportation organizations and stakeholders, and (2) to conduct that program in cooperation with the partners. The program includes bothstudies that are identi ied with research partners of projects targeted to the theme, and targeted,short-term projects. The program develops competitive proposals, which are evaluated to insurethe mostresponsive UTRC team conducts the work. The research program is responsive to theUTRC theme: “Planning and Managing Regional Transportation Systems in a Changing World.” Thecomplex transportation system of transit and infrastructure, and the rapidly changing environment impacts the nation’s largest city and metropolitan area. The New York/New JerseyMetropolitan has over 19 million people, 600,000 businesses and 9 million workers. The Region’sintermodal and multimodal systems must serve all customers and stakeholders within the regionand globally.Under the current grant, the new research projects and the ongoing research projectsconcentrate the program efforts on the categories of Transportation Systems Performance andInformation Infrastructure to provide needed services to the New Jersey Department of Transportation, New York City Department of Transportation, New York Metropolitan TransportationCouncil , New York State Department of Transportation, and the New York State Energy andResearch Development Authorityand others, all while enhancing the center’s theme.Education and Workforce DevelopmentThe modern professional must combine the technical skills of engineering and planning withknowledge of economics, environmental science, management, inance, and law as well asnegotiation skills, psychology and sociology. And, she/he must be computer literate, wired to theweb, and knowledgeable about advances in information technology. UTRC’s education andtraining efforts provide a multidisciplinary program of course work and experiential learning totrain students and provide advanced training or retraining of practitioners to plan and manageregional transportation systems. UTRC must meet the need to educate the undergraduate andgraduate student with a foundation of transportation fundamentals that allows for solvingcomplex problems in a world much more dynamic than even a decade ago. Simultaneously, thedemand for continuing education is growing – either because of professional license requirementsor because the workplace demands it – and provides the opportunity to combine State of Practiceeducation with tailored ways of delivering content.Technology TransferUTRC’s Technology Transfer Program goes beyond what might be considered “traditional”technology transfer activities. Its main objectives are (1) to increase the awareness and level ofinformation concerning transportation issues facing Region 2; (2) to improve the knowledge baseand approach to problem solving of the region’s transportation workforce, from those operatingthe systems to those at the most senior level of managing the system; and by doing so, to improvethe overall professional capability of the transportation workforce; (3) to stimulate discussion anddebate concerning the integration of new technologies into our culture, our work and ourtransportation systems; (4) to provide the more traditional but extremely important job ofdisseminating research and project reports, studies, analysis and use of tools to the education,research and practicing community both nationally and internationally; and (5) to provideunbiased information and testimony to decision-makers concerning regional transportationissues consistent with the UTRC theme.Project No(s):UTRC/RF Grant No: 49198-39-28Project Date: October 2017Project Title: Techniques for Ef icient Detection of RapidWeather Change and Analysis of their Impacts on aHighway NetworkProject’s hniquesef icient-detection-rapid-weather-changePrincipal Investigator(s):Catherine T. LawsonAssociate ProfessorDepartment of Geography and PlanningSUNY AlbanyAlbany, NY 12222Tel: (518) 442-4775Email: lawsonc@albany.eduFeng ChenAssistant ProfessorDepartment of Computer ScienceSUNY AlbanyAlbany, NY 12222Tel: (518) 437-4940Email: fchen5@albany.eduCo Author(s):Adil AlimSUNY AlbanyAlbany, NY 12222Joshi AparnaSUNY AlbanyAlbany, NY 12222Performing Organization(s):State University of New York (SUNY)Sponsor(s):)University Transportation Research Center (UTRC)U.S. Department of Transportation/Federal HighwayAdministrationTo request a hard copy of our inal reports, please send us anemail at utrc@utrc2.orgMailing Address:University Transportation Reserch CenterThe City College of New YorkMarshak Hall, Suite 910160 Convent AvenueNew York, NY 10031Tel: 212-650-8051Fax: 212-650-8374Web: www.utrc2.org
Board of DirectorsUTRC Consortium UniversitiesThe UTRC Board of Directors consists of one or two members from eachConsortium school (each school receives two votes regardless of thenumber of representatives on the board). The Center Director is anex-of icio member of the Board and The Center management team servesas staff to the Board.The following universities/colleges are members of the UTRCconsortium.City University of New YorkDr. Robert E. Paaswell - Director Emeritus of UTRCDr. Hongmian Gong - Geography/Hunter CollegeClarkson UniversityDr. Kerop D. Janoyan - Civil EngineeringColumbia UniversityDr. Raimondo Betti - Civil EngineeringDr. Elliott Sclar - Urban and Regional PlanningCornell UniversityDr. Huaizhu (Oliver) Gao - Civil EngineeringHofstra UniversityDr. Jean-Paul Rodrigue - Global Studies and GeographyCity University of New York (CUNY)Clarkson University (Clarkson)Columbia University (Columbia)Cornell University (Cornell)Hofstra University (Hofstra)Manhattan College (MC)New Jersey Institute of Technology (NJIT)New York Institute of Technology (NYIT)New York University (NYU)Rensselaer Polytechnic Institute (RPI)Rochester Institute of Technology (RIT)Rowan University (Rowan)State University of New York (SUNY)Stevens Institute of Technology (Stevens)Syracuse University (SU)The College of New Jersey (TCNJ)University of Puerto Rico - Mayagüez (UPRM)Manhattan CollegeDr. Anirban De - Civil & Environmental EngineeringDr. Matthew Volovski - Civil & Environmental EngineeringUTRC Key StaffNew Jersey Institute of TechnologyDr. Steven I-Jy Chien - Civil EngineeringDr. Joyoung Lee - Civil & Environmental EngineeringDr. Camille Kamga: Director, UTRCAssistant Professor of Civil Engineering, CCNYNew York Institute of TechnologyDr. Marta Panero - Director, Strategic PartnershipsNada Marie Anid - Professor & Dean of the School of Engineering & Computing SciencesDr. Robert E. Paaswell: Director Emeritus of UTRC and DistinguishedProfessor of Civil Engineering, The City College of New YorkNew York UniversityDr. Mitchell L. Moss - Urban Policy and PlanningDr. Rae Zimmerman - Planning and Public AdministrationDr. Kaan Ozbay - Civil EngineeringDr. John C. Falcocchio - Civil EngineeringDr. Elena Prassas - Civil EngineeringRensselaer Polytechnic InstituteDr. José Holguín-Veras - Civil EngineeringDr. William "Al" Wallace - Systems EngineeringRochester Institute of TechnologyDr. James Winebrake - Science, Technology and Society/Public PolicyDr. J. Scott Hawker - Software EngineeringRowan UniversityDr. Yusuf Mehta - Civil EngineeringDr. Beena Sukumaran - Civil EngineeringState University of New YorkMichael M. Fancher - NanoscienceDr. Catherine T. Lawson - City & Regional PlanningDr. Adel W. Sadek - Transportation Systems EngineeringDr. Shmuel Yahalom - EconomicsDr. Ellen Thorson: Senior Research FellowPenny Eickemeyer: Associate Director for Research, UTRCDr. Alison Conway: Associate Director for EducationNadia Aslam: Assistant Director for Technology TransferDr. Wei Hao: Post-doc/ ResearcherDr. Sandeep Mudigonda: Postdoctoral Research AssociateNathalie Martinez: Research Associate/Budget AnalystTierra Fisher: Ofϔice AssistantAndriy Blagay: Graphic InternStevens Institute of TechnologyDr. Sophia Hassiotis - Civil EngineeringDr. Thomas H. Wakeman III - Civil EngineeringSyracuse UniversityDr. Riyad S. Aboutaha - Civil EngineeringDr. O. Sam Salem - Construction Engineering and ManagementThe College of New JerseyDr. Thomas M. Brennan Jr - Civil EngineeringUniversity of Puerto Rico - MayagüezDr. Ismael Pagán-Trinidad - Civil EngineeringDr. Didier M. Valdés-Díaz - Civil EngineeringMembership as of January 2017
TECHNICAL REPORT STANDARD TITLE PAGE1. Report No.3. Recipient’s Catalog No.2.Government Accession No.5. Report DateOctober 6, 20174. Title and SubtitleTechniques for Efficient Detection of Rapid Weather Change and Analysis of their Impacts on a Highway Network6. Performing Organization Code7. Author(s)Catherine T. Lawson, University at AlbanyFeng Chen, University at AlbanyAdil Alim, University at AlbanyJoshi Aparna, University at Albany8. Performing Organization Report No.9. Performing Organization Name and AddressUniversity at Albany1400 Washington AvenueAlbany, New York 1222210. Work Unit No.11. Contract or Grant No.49198-39-2812. Sponsoring Agency Name and AddressUniversity Transportation Research CenterThe City College of New York137th Street and Convent Ave,New York, NY 10031Federal Highway AdministrationU. S. Department of TransportationWashington, D. C.13. Type of Report and Period CoveredFinal Report9/1/2016 – 8/31/201714. Sponsoring Agency Code15. Supplementary Notes16. AbstractAdverse weather conditions have a significant impact on the safety, mobility, and efficiency of highway networks. Annually, 24 percent of all crashes, more than 7,400roadway fatalities, and over 673,000 crash related injuries were caused by adverse weather conditions between 1995 and 2005 [1]. In addition, weather contributed to 23percent of all non-reoccurring delay and approximately 544 million vehicle hours of delay each year [2]. Nearly 2.3 billion dollars each year are spent by transportationagencies for winter maintenance that contribute to close to 20 percent of most DOTs yearly budgets [2]. These safety and mobility factors make it important to develop newand more effective methods to address road conditions during adverse weather conditions.This project develops techniques for efficiently detecting rapid weather change events and analyzing their impacts on the traffic flow characteristics of a highway network. Itis composed of three components, including 1) detection of rapid weather change events in a highway network using the streaming weather information from a sensornetwork of weather stations; 2) detection of rapid change events on the traffic flow characteristics (e.g., travel time) of the highway network; and 3) analysis of correlationsbetween the detected weather and traffic change events in space and time. The proposed approach was applied to a weather dataset provided by New York StateMesonet and a traffic flow dataset, the National Performance Management Research Data Set (NPMRDS), provided by NYSDOT, from Mar. 1, 2016 to Dec. 31, 2016. Theempirical results provide potential evidence about the significant impacts of rapid weather change events on traffic flow characteristics of the Interstate 90 (I-90) Highway inthe state of New York. The limitations of the proposed approach and the empirical study are also discussed.17. Key Words18. Distribution Statement19. Security Classif (of this report)20. Security Classif. (of this page)UnclassifiedUnclassifiedForm DOT F 1700.7 (8-69)21. No of Pages22. Price
DisclaimerThe contents of this report reflect the views of the authors, who are responsible for the facts andthe accuracy of the information presented herein. The contents do not necessarily reflect theofficial views or policies of the UTRC. This report does not constitute a standard, specificationor regulation. This document is disseminated under the sponsorship of the Department ofTransportation, University Transportation Centers Program, in the interest of informationexchange. The U.S. Government assumes no liability for the contents or use thereof.
Contents1 Introduction12 Literature Review13 Weather Station and Traffic Message Channel (TMC) real networks33.1 Mesonet Weather Station Network . . . . . . . . . . . . . . . . .33.2 Traffic Message Channel (TMC) Network . . . . . . . . . . . . .43.3 Data Description . . . . . . . . . . . . . . . . . . . . . . . . . . .63.3.1 Weather Data . . . . . . . . . . . . . . . . . . . . . . . . .63.3.2 Traffic Data . . . . . . . . . . . . . . . . . . . . . . . . . .74 Methodology and Proposed Approach4.1 Problem definition . . . . . . . . . . .4.2 Weather change event Detection . . .4.2.1 Normalization of Time Window4.2.2 Change event detection . . . .4.2.3 Ranking of the results . . . . .4.3 Traffic change event Detection . . . . .4.4 Multi-Variable change event Detection4.4.1 Selection of Related Variables .4.4.2 Multi-GraphMP algorithm . .4.5 Correlation Study . . . . . . . . . . .4.5.1 Problem definition . . . . . . .4.5.2 Correlation Statistic Function .4.5.3 Hypothesis Testing . . . . . . .5 Experiments and Discussions5.1 Experiments . . . . . . . . . . . . . . . .5.1.1 Time-Lag Effect and Detection .5.1.2 Weather Change Event Detection5.1.3 Traffic Change Event Detection .5.1.4 Correlation Study . . . . . . . .5.2 Discussions and Limitations . . . . . . .6 3334
1IntroductionAnalysis of the rapid (or sudden) weather changes has real-world implications inthe transportation field such as improvement of transportation safety, mobility,and efficiency in response to rapid weather changes. Weather acts throughvisibility impairments, precipitation, high winds, and temperature extremesto affect driver capabilities, vehicle performance (i.e., traction, stability, andmaneuverability), pavement friction, roadway infrastructure, crash risk, trafficflow, and agency productivity. On average, there are over 5,748,000 vehiclecrashes each year. Approximately 22% of these crashes, nearly 1,259,000, areweatherrelated. Weatherrelated crashes are defined as those crashes that occur in adverse weather (i.e., rain, sleet, snow, fog, severe crosswinds, or blowing snow/sand/debris) or on slick pavement (i.e., wet pavement, snowy/slushypavement, or icy pavement). On average, nearly 6,000 people are killed andover 445,000 people are injured in weather-related crashes each year [3]. Thesesafety and mobility factors make it important to develop new and more effectivemethods to address road conditions during adverse weather conditions.Existing techniques to detect a change point in weather conditions [4, 5,6, 7, 8] either do not work with sensor networks or explore only regular-shapedsubsets. The impact of weather conditions on traffic conditions has been studiedin [9, 10, 11, 12, 13, 14, 15, 16], however, the impact of rapid weather changeson traffic conditions is not well-explored. Also, [17, 18, 19, 20] study thesingle point traffic flow forecasting, however, there is no multi-point traffic flowforecasting model that can deal with distribution changes. This project aims toaddress three main research questions: How can rapid weather changes in a highway network be detected in realtime using the streaming multivariate weather information collected fromweather stations near the network? How can rapid traffic flow changes in the highway network be detectedin real time using the steaming traffic flow information collected from thehighway network sensors? How can the significance of correlations between rapid weather changesand traffic flow changes in space and time be well assessed?The remainder of this report is organized as follows: Section 2 reviews existing literature on rapid weather change detection. Section 3 proposes themodeling of real weather station network and Traffic Message Channel networkinto graphs and provides details about data processing. Section 4 introduces ourresearch methodology. Section 5 presents the experiment and numerical resultsfollowed by the concluding remarks and future research directions in Section 6.2Literature ReviewThe literature review is organized based on the three research questions asdiscussed in the previous section.1
1) Detection of rapid weather changes. This is also called a changepoint detection problem, and refers to the identification of abrupt variation ofweather variables (e.g., temperature, humidity, wind, gust, pressure, and solarradiation) in a certain geographic region and a time point due to distributionalor structural changes. A number of algorithms are available for change pointdetection, including detection of a change point in a univariate or multivariate time series collected from a single sensor node (weather station) [4, 5, 6],and detection of a change point in a collection of multivariate time series frommultiple sensor nodes in a sensor network, where an unknown subset of sensornodes are affected by the change point [7, 8]. As there are a large (exponential)number of possible subsets, much of this literature only explores regular-shapedsubsets, such as circles and rectangles, in order to restrict the search space. Toour knowledge, only a few references have addressed techniques for detecting achange point in a sensor network, where both the subset of sensor nodes andthe subset of weather variables that are impacted by the change point are unknown [7, 8]. In particular, Neil explores space-time scan statistics to identifythe best combination of subsets sensor nodes and weather variables as the indicator of a change point [7]. Jiang et al. explore joint sparse principle componentanalysis (PCA) algorithms to identify the indicating subsets of sensor nodes andvariables for detecting a change point [8].2) Statistical impact analysis. The impact of weather conditions (variables) on traffic conditions (e.g., speed, volume, travel time) was largely studiedusing statistical analysis techniques based on linear or logistic regressions [9],such as the impact of rainy weather on the speed variance of rural highways [10],the impact of cold and snow on traffic volumes [11], the impact of snow on traveltime [12], and several others [13, 14]. Only a few references have studied theimpact of weather conditions using nonlinear techniques [15, 16]. In particular,Mohammed et al. explore a mixture of linear regression models to study theimpact of weather events (e.g., rain, fog, haze) on congestion identification [15].Martchouk and Mannering apply a first-order autoregressive model to study theimpact of weather events on travel time [16]. To our knowledge, there is limitedwork that has studied the impact of rapid weather changes on traffic conditions.3) Short-term traffic flow forecasting. A number of algorithms are available for traffic flow forecasting [17, 18]. Most of the algorithms have focusedon “one point” (or single road link) short-term traffic prediction that considered only the temporal domain and did not take into account the dependenciesbetween road links (spatial domain) [18]. These so-called univariate methodsare generally based on the use of time-series-based methods, such as the autoregressive integrated moving average (ARIMA) [19], back-propagation neutral networks, nonparametric regressions, and several others [20]. Despite thesesuccesses in single-point prediction, recent advances demonstrate that the multipoint forecasting models that take into consideration “geographic advantage”of urban network provide better prediction results, such as the spatio-temporal(ST) ARIMA [21], generalized STARIMA [22], and our recently proposed spatiotemporal random effects (STRE) model [18]. All the preceding forecasting mod-2
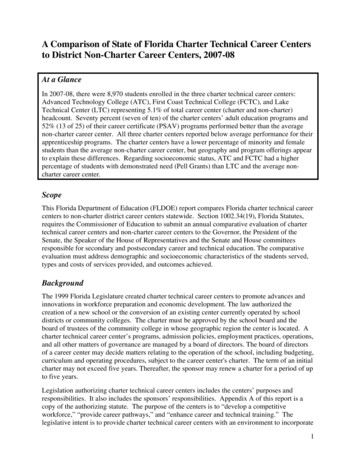
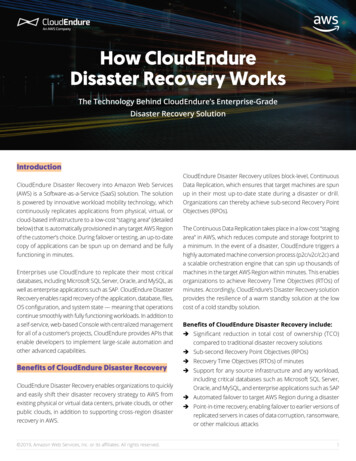
els assume that the distribution of traffic conditions does not change over time.However, rapid weather changes will lead to change of distribution of trafficflow. To our knowledge, there is no multi-point traffic flow forecasting modelthat can deal with distribution changes. In the machine learning field, switchingstate-space models are designed to model change of distributions [23], but theintegration of switching state-space models into existing traffic flow forecastingmodels is nontrivial.Table 1 AbbreviationsSymbolMeaningT2MTemperature that is taken at 2 meters from surfaceTemperatureT9MTemperature that is taken at 9 meters from surfaceTMCTraffic Message ChannelI-90Interstate 90MADMean Absolute DeviationEMSEvaluated Mean ScanPICPattern Instance CountTSTest StatisticsGLRTGeneralized Likelihood Ratio Test statistic3Weather Station and Traffic Message Channel(TMC) real networksIn this section, we discuss the weather and traffic flow datasets that we usedduring our experiments,and the modeling of the weather station netwrork graphand the TMC network graph. The weather dataset was originally provided byNew York State Mesonet [24]. The traffic flow dataset was provided by the National Performance Management Research Data Set (NPMRDS) and has beenmade available by Albany Visualization and Informatics Lab (AVAIL) on behalfof New York State Department of Transportation (NYSDOT) and UniversityTransportation Research Center (UTRC). In Section 3.1 and Section 3.2 we willdiscuss the details of the Mesonet Weather Station Network and Traffic MessageChannel (TMC) Network, respectively.3.1Mesonet Weather Station NetworkThe New York State Mesonet consists of 125 stations across the state of NewYork. Each station houses a suite of automated sensors, which sample thesensors data every 3 to 30 seconds, then the data are packaged into 5-minuteaverages and transmitted in real-time to a central facility located at Universityat Albany (UAlbany). We selected 10 weather stations along the I-90 route, suchas Batavia, South Bristol, Waterloo, Jordon, Westmorland, Central Square,Cold Brook, Sprakers, Cobleskill, Stephentown. Figure 1 shows locations ofweather stations (represented by red stars) on the map.3
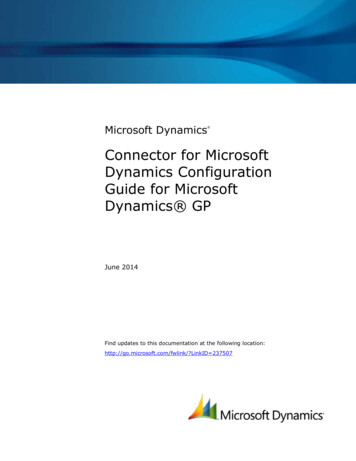
Figure 1: Mesonet geographic locationsBased on the spatial neighborhood relationships of the selected weather stations, we modeled a graph viz. weather station graph, consisting weather stations as nodes in the graph and spatial neighborhood relationships between thenodes as edges. We indexed the 10 selected weather stations 0 to 9, {“BATA”:0,“SBRI”:1, “WATE”:2, “JORD”:3, “CSQR”:4, “WEST”:5, “COLD”:6, “SPRA”:7,“COBL”:8, “STEP”:9}, as shown in Figure 2.Figure 2: Weather station network modeling3.2Traffic Message Channel (TMC) NetworkWe have used the National Performance Management Research Data Set (NPMRDS). NPMRDS provides vehicle probe-based travel time data for passengerautos and trucks. The real-time probe data were collected from a variety ofsources including mobile devices, connected autos, portable navigation devices,commercial fleet, and sensors. NPMRDS includes historical average travel timesin 5-minutes increments on daily basis covering the National Highway System(NHS). The data are divided into two parts. The first part is a Traffic MessageChannel (TMC) static file containing TMC information that does not changefrequently. The second part includes travel times and identifies roadways georeferenced to TMC location codes. The two datasets need to be combined inGIS-based software to provide the full picture. We used the data provided byNPMRDS which includes the traveling time of I-90 West and I-90 East routes.The I-90 West route section includes 52 TMCs and the I-90 East route section4
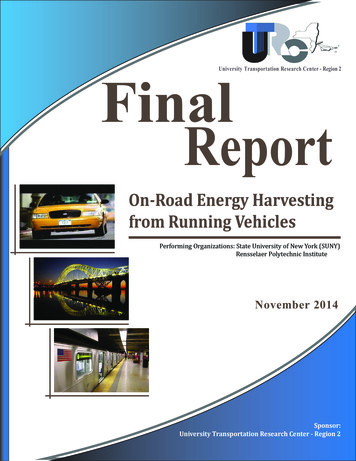
Figure 3: Single TMC centroid point calculation exampleincludes 54 TMCs. Each TMC has a length of the channel and geographicinformation of the channel where the geographic location coordinate is a polygon. We calculated the TMCs centroid geographic coordinates (i.e. latitudeand longitude) and plotted them on the map. Figure 3 shows an example of thecentroid point of a polygon latitude and longitude coordinates. Figure 4 is themap plot of I-90 West TMC centroid locations. The I-90 East TMCs map plothas the same shape as that of I-90 West and therefore is not shown.Figure 4: TMC centroid geographic locations of I-90 West routeWe modeled the TMC networks for I-90 West route and I-90 East route intotwo TMC network graphs separately, based on neighborhood relationships ofthe TMCs. In each of the TMC network graphs the nodes represent TMCs andedges represent the neighborhood relationships between the TMCs. Because ofthe spatial structure of the TMC real network, we get two path graphs. Figure 5shows the constructed graph of I-90 West (indexed the TMC with new ID 0 to51) and I-90 East (indexed the TMC with new ID 0 to 53) TMC network.Figure 5: I-90 West and I-90 East TMC network graphs5
3.3Data DescriptionWe have access to the weather and traffic data from Mar. 1, 2016 to Dec. 31,2016, provided by Mesonet and NPMRDS. As discussed in Section 3.1 and Section 3.2, we modeled both weather station network and I-90 TMC networks assensor graphs. The weather stations and TMCs both have records in 5-minutesincrements. This means each weather station packages 5 minute averages ofeach weather variable and each TMC has the average traveling time for every5 minutes. See Figure 6 for the examples of raw data (a) format of weatherstation record and (b) format of TMC record. All the data are in ”.CSV”file format. Mesonet weather data has Station ID, datatime (consists of dateand time which have 5 min time interval), 8 weather variables (T2M, T9M, rh,avg wind speed etc.). The variables temp 2m and temp 9m in 6 are representedby T2M and T9M throughout this report. NPMRDS data has TMC originalID, epoch (or the time slots, i.e. epoch number 1 represents time 00:00am, 2represents 00:05am, etc.), npmrds date, travelTime.Figure 6: Mesonet and NPMRDS raw data formatsFor the weather and traffic data, we have records of 5 min intervals for allweather variables and TMC traveling time. We denote 5 min interval time asa time slot (epoch), in total we have of 288 time slots for each day. A Mesonetweather station records each weather variable every 5 minutes and obtains total288 records per day. Similarly, each TMC has 288 traveling time records perday.3.3.1Weather DataWe obtained the weather data from Mar. 1, 2016 to Dec. 31, 2016 (a totalof 306 days). For 10 selected stations, the complete data of the following 8weather variables is available: T2M [degF], T9M [degF], Relative humidity [%],Average wind speed [mph], Max wind speed [mph], Wind direction [degree],Solar radiation [W/m2 ] and Station pressure [mbar].6
Extraction of daily data We pre-processed the raw data and extracted therecords of each variable. For each individual weather variable, we extracted thedaily data for 10 selected weather stations. Further, we generated a file thatincludes 10 stations daily data. Figure 7 shows the weather variable T2M’svalues for 10 stations on Mar. 1, 2016. The 1st column is the weather stationID, the following 288 columns are the records of 288 time slots. The cell(i, j)represents the T2M values of ith weather station at jth time slot on Mar. 1,2016. For all 8 weather variables, we followed the same process. At the end, foreach variable we got 306 files for 306 days and in total we had 8 306 i.e. 2448files.Figure 7: Mar. 1, 2016 processed data for T2MExample Plots Each weather variables have different shapes of plots. Toshow the visualization of our weather station network one day data, we give theexample plots in this section. In Figure 8 and 9 we show the example plots ofall 8 variables on Mar. 25, 2016.3.3.2Traffic DataWe have access to the traffic data from Mar. 1, 2016 to Dec. 31, 2016 (a totalof 306 days same as the weather data) for both I-90 East and I-90 West route.For both, I-90 West and I-90 East route, we have the traffic traveling time data.Extraction of daily data We pre-processed the raw traffic data in a similarway to the weather ra
Mailing Address: University Transportation Reserch Center The City College of New York Marshak Hall, Suite 910 160 Convent Avenue New York, NY 10031 Tel: 212-650-8051 . Hofstra University (Hofstra) Manhattan College (MC) New Jersey Institute of Technology (NJIT) New York Institute of Technology (NYIT)