Transcription
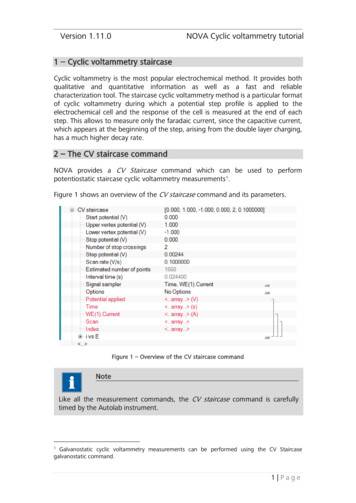
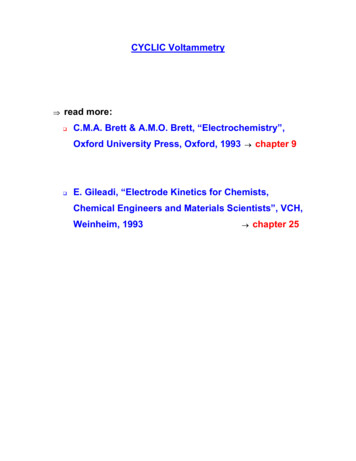
Acta Materialia 50 (2002) 1063–1073www.actamat-journals.comLarge deformation simulations of cyclic displacementinstabilities in thermal barrier systemsM.Y. Heba,*, J.W. Hutchinson b, A.G. EvanscaMaterials Department, University of California, Santa Barbara, CA 93106-5050, USADivision of Engineering and Applied Science, Harvard University, Cambridge, MA 02138, USAcPrinceton Materials Institute, Princeton University, Princeton, NJ 08540, USAReceived 15 August 2001; accepted 18 October 2001AbstractThe cyclic displacement instability exhibited by a thermally grown oxide (TGO) in a thermal barrier system hasbeen simulated using a scheme that embodies large-scale thickening. The investigation has three main objectives. (i)A sensitivity study that probes the influence of the thermo-mechanical properties of the bond coat. It uses propertiesthat closely resemble those relevant to actual bond coat materials. (ii) Explore the influence of the size of the imperfections present on the bond coat surface and address the critical size below which the instability is suppressed. (iii) Adetermination of the influence of TGO growth kinetics ranging between linear and parabolic. 2002 Acta MaterialiaInc. Published by Elsevier Science Ltd. All rights reserved.Keywords: Physical vapor deposition (PVD); Thermal barrier systems; Computer simulation; Layered materials; Fatigue1. IntroductionThermal barrier systems used in gas turbines aretri-layers, comprising an alloy bond coat, an oxidethermal barrier coating (TBC) and a thermallygrown oxide (TGO) [1–5]. Durability assessmentshave drawn attention to the importance of cyclicplasticity in the bond coat, through its governanceof TGO displacement instabilities [6–9]. The mostvivid manifestation is the periodic downward displacements of the TGO in a system with a Pt–allemande bond coat (β–NiAl with Pt in solution) that* Corresponding author.E-mail address: ming@engineering.ucsb.edu (M.Y. He).creates lateral cracks in the superposed TBC (Fig.1) [6]. The effect is motivated by the combinedinfluence of the thermal expansion misfit betweenthe TGO and the substrate, as well as the growthstrains in the TGO [6–11].Earlier numerical simulations have demonstratedresponses that duplicate the experimental trends[8,9]. However, because of numerical limitations,changes in the TGO thickness upon cycling havebeen limited to levels smaller than the initial thickness. This restriction has confined the scope to asmall number of cycles conducted on pre-oxidizedsystems with a thin, initial TGO [8,9]. The presentarticle establishes a procedure for incorporatingfinite thickening and focuses on its consequences.The simulations are performed for a bond coat hav-1359-6454/02/ 22.00 2002 Acta Materialia Inc. Published by Elsevier Science Ltd. All rights reserved.PII: S 1 3 5 9 - 6 4 5 4 ( 0 1 ) 0 0 4 0 6 - 2
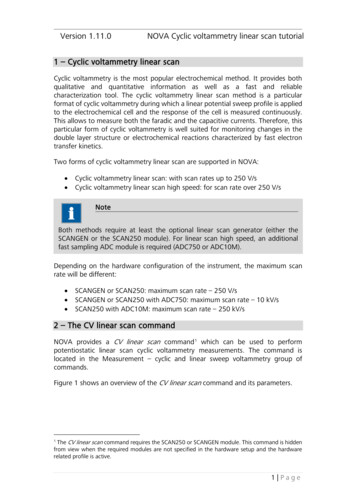
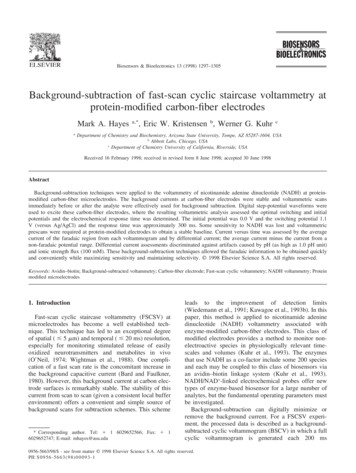
1064M.Y. He et al. / Acta Materialia 50 (2002) 1063–1073present on the bond coat surface, and the effect ofTGO growth kinetics (linear relative to parabolic).The ability to incorporate finite thickeningenables another key aspect of the instability to beassessed. Namely, the influence of the amount ofnew TGO forming at the interface to cause thickening, relative to that forming on the internal grainboundaries that results in a growth strain, eg [1].The latter allows the TGO to elongate at the instability [6].2. The modelTwo topological choices have been used in prioranalyses: one for a surface having sinusoidal undulations (ridges and valleys), subject to plane strain[8], and the other for isolated, axi-symmetric undulations and protuberances [9]. The trends appear tobe insensitive to this difference. The present simulations use the sinusoidal morphology. The TGOlayer oscillates with amplitude A0 and wavelength2L, varying as: z (A0 / 2) cos (px / L) (Fig. 2),with A0 / L 0.6 in all calculations.Most of the concepts underlying the propagationof instabilities have been elaborated elsewhere[8,9,15] and are only summarized here for completeness. The TGO characteristics are explainedfirst. The growth is simulated by a stress-free straintensor applied at the maximum temperature [9,15].Consistent with experimental findings [6,14], thisstrain has a small lateral component, eg, and aFig. 1. The TGO displacement instability upon thermal cycling of a TBC system with a Pt–aluminide bond coat [6].ing representative thermo-mechanical properties[9,12,13]. That is, the alloy has temperature-dependent yielding characteristics, as well as a thermalexpansion misfit with the substrate [13].By introducing features that closely resemblethose applicable to actual bond coat systems, theorigins of several effects observed in experiments[6,14] have been distinguished. These include therole of the bond coat mechanical properties as wellas the influence of the size of the imperfectionsFig. 2.A schematic of the configuration analysed.
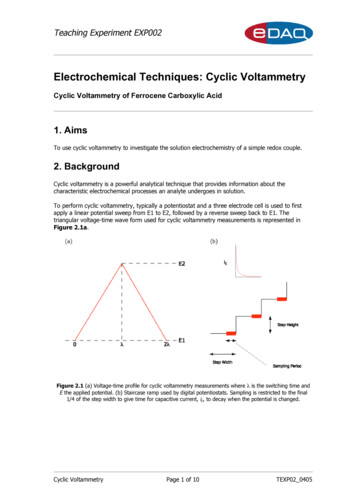
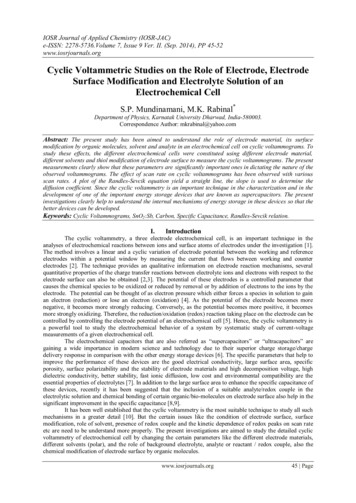
M.Y. He et al. / Acta Materialia 50 (2002) 1063–1073larger thickening component, h / h0. The thickening per cycle, h, is a variable, initially taken tobe a fixed fraction, f, of the initial thickness, h0.Subsequent simulations are performed with theparabolic thickening kinetics found experimentally[1,16]: whereupon the increment in thickness percycle, subject to hot time, t, becomes: t h h h02t(1)where t is the cumulative hot time.Stress redistribution upon cycling is simulatedby imparting the yield characteristics plotted inFig. 3(a) [9,15]. That is, at the peak temperature,the TGO yields when the Mises stress reaches 1GPa, imposing a maximum on the growth stress[1,10]. On cooling and reheating it behaves elastically, because of the rapid increase in yieldstrength at lower temperatures. The stress at ambient then equals the sum of that from growth withthat from thermal expansion misfit (sambient 4.5 GPa) [1,10].The bond coat is considered next. It is taken tohave a temperature-dependent yield strength hav-Fig. 3. The temperature-dependent yield strengths used for thesimulations: (a) TGO, (b) bond coat [9].1065ing the form depicted in Fig. 3(b) [9,12]. Thestrength up to temperature T1 (taken as 300 C inall calculations) is 1 GPa. At temperatures aboveT2, the strength sbcY min is allowed to vary in therange of 50–200 MPa. It changes linearly from T1to T2.Time-dependent (creep) effects are notaddressed with this representation. They are beingexamined in a separate study [17]. The bond coatis assigned a thermal expansion misfit with thesuperalloy substrate. For most calculations it istaken as: as 3 ppm / C ( as asub abc)[13,18].The stresses in the substrate are sufficientlysmall that they never attain the yield strength [8,9],enabling an elastic representation to be used.3. The finite element implementationThe simulations have been conducted by thefinite element method, using the general-purposecode ABAQUS. The unit cell (Fig. 2) has beendescribed elsewhere [8]. A typical mesh includesabout 3600 10-node generalized plane strainelements, which account for the bi-axial nature ofthermal loading. Periodic boundary conditions areimposed. The material properties are similar tothose used previously (Esub 200 GPa, nsub 0.3, Ebc 200 GPa, nbc 0.3, Etgo 400 GPa,and ntgo 0.2) [1,8,9,13]. The new feature is thesub-routine for simulating TGO growth occurringat the maximum temperature. The lateral component, exx ezz eg, is incorporated byimposing a transformation strain to all elements inthe TGO layer, taken to be uniform through thethickness. Non-uniformities set up stress (chemicalpotential) gradients that would be rapidly eliminated through matter redistribution by grain boundary diffusion. The thickening simulation requires adifferent strategy. A strain et is imposed on the rowof the bond coat elements immediately adjacent tothe TGO. An engineering strain measure is used,such that the ratio of the new volume to the original volume in the row of elements experiencingoxidation is, (1 et)(1 eg)2. Since eg is typicallysmall compared with et, the relative volume changeupon changing from the alloy host phase to the
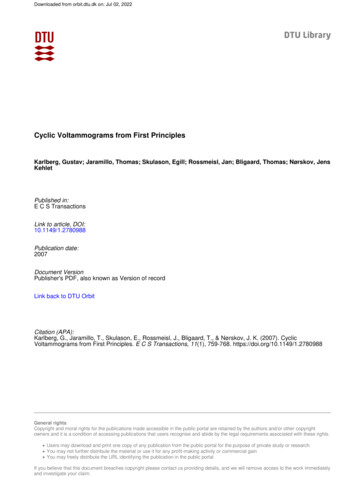
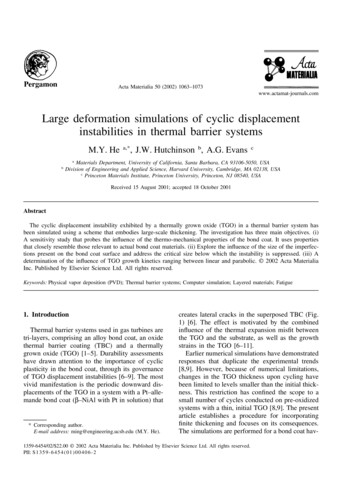
1066M.Y. He et al. / Acta Materialia 50 (2002) 1063–1073oxide product phase is effectively et [19,20]. Simultaneously, the properties of these elements areswitched from those characteristic of the bond coatto those applicable to the TGO. To avoid numericalinstability the properties are changed incrementally, in a linear manner, as the thickening isimposed. The chosen thickening rate dictates thedimensions of the elements that undergo oxidation.For example, when et 1, in order to realize athickening per cycle, h, the thickness of thosebond coat elements experiencing the transitionwould be h / 2. Two user subroutines have beenwritten to perform these adaptations. Unless statedotherwise, the following simulations use a strainratio, eg / ( h / h0) 0.005, suggested by experimental measurements for a system with a Pt–aluminide bond coat [6].4. General responsesPreliminary results for small thickness changes[Fig. 4(b) and (c)] elaborate and embellish earlierresults [8,9]. A plot of the maximum Mises stressinduced in the bond coat during one cycle (cooling,reheating and TGO thickening), relative to its yieldstrength [Fig. 4(a)], reveals the range of the cyclicplastic deformation beneath the impression [regionA in Fig. 4(a)]. Because of the expansion misfit,the entire bond coat yields on cooling, but zone Bin Fig. 4(a) remains elastic on reheating. Withinthe cyclic domain (zone A), the stress plot [Fig.4(b)] indicates temperatures at which yieldingcommences on cooling, Tstartyield, and then ceases,,becauseoftherapidrise in yield strengthTceaseyieldbelow T2 [refer to Fig. 3(b)]. It also shows the temperature, Treyield, at which reverse yielding occurson reheating. Note that the stress readjusts, by sgrowth, as the TGO thickens at the peak temperature, causing Tstartyield to decrease in the second cycle.Thereafter, it remains invariant.The maximum vertical component of the plasticstrain in zone A, eplzz [Fig. 4(c)], reveals a complementary feature. That is, the temperatures foryielding, its cessation and for re-yielding are againapparent. But also note that, in this zone, eplzzincreases on a cycle-by-cycle basis, such that theplastic strain at ambient becomes systematicallylarger. Such strain accumulation is an indicator ofratcheting [9,15].The foregoing responses, as well as others,become more vivid when a larger TGO thickeningrate is incorporated into the simulations. Largescale thickening results pertinent to the issues outlined in Section 1 are summarized in the following sections.5. Large-scale thickening5.1. The lateral growth strainAscertaining the role of the lateral growth strainis crucial. To assess this, simulations performed forzero growth strain have been compared with thosefor strains in the range, eg 5–20 10 4, all forthe same thickening per cycle, h / h0 0.2. Theresults plotted in Fig. 5 typify all of the casesexplored. Namely, absent a growth strain, theamplitude change rate, dA / dN, systematicallydecreases over about five cycles to a low (almostzero) level. It never becomes precisely zero,reflecting the continuous thickening of the TGO.When a growth strain exists (d A / dN increasesover the first few cycles and reaches a steady state,(d A / dN)ss [Fig. 5(a) and (b)]. The growth strainappears to be necessary because it allows the TGOto lengthen as the imperfection amplitudeincreases. Note that when the ratcheting rate is normalized by the growth strain [Fig. 5(c)],(d A / dN)ss is similar for all cases.Given the key influence of the growth strain, allof the following calculations are performed foreg / ( h / h0) 0.005, except the results shown inFigs. 11 and 13.5.2. StressesPlots of the stress components (syy, szz) duringa thermal cycle reveal the basis for cyclic plasticity[Fig. 6(a)]. Variations in sxx are similar to syy: thisstress has been omitted from the plots for clarityof presentation. Moreover, only the key featuresare emphasized. Upon cooling, locations of type A(Fig. 3) that experience cyclic yielding develop syycompressions, accompanied by szz tensions, con-
M.Y. He et al. / Acta Materialia 50 (2002) 1063–10731067Fig. 4. (a) The regions of the bond coat that experience cyclic yielding (A) relative to those that yield only on cooling (B). (b) Thechange with temperature of the Mises stress in the bond coat, relative to the yield strength, for two thermal cycles, calculated at alocation (site A) in the bond coat that experiences cyclic yielding. The temperatures at which yielding begins and ceases are indicated,as well as the reyield temperature. (c) The accumulation of plastic strain over 1.5 thermal cycles for the same location and conditionsused to plot the stress depicted in Fig. 4(b) (h0 / L 0.08, A0 / 2L 0.3, h / h0 0.2, T2 600 C, sYminbc 100 MPa, eg 10 3).sistent with established effects of thermal expansion misfit [1,19]. The deviatoric stresses, se, beingessentially the difference between syy and szz, arelarge, facilitating the plastic strain accumulationshown in Fig. 4. At locations outside this zone(region B in Fig. 3) all of the stresses are compressive [Fig. 6(b)] [1,19], such that the deviatoricstress is too small to cause reverse yielding.The stresses readjust as the TGO thickens (Fig.6). In the reverse yielding zone, A, all of thestresses increase upon thickening, whereas in zoneB, they decrease.5.3. Plastic strainsThe plastic strain, eplzz, evolutions in zones A andB (Fig. 7) give some understanding of the consequences of the stresses. In this (and subsequent)
1068M.Y. He et al. / Acta Materialia 50 (2002) 1063–1073tive of a small downward displacement. The strainsoccur primarily during TGO growth.5.4. Amplitude changesThe amplitude changes, A, are plotted in Figs.8 and 9. A small increase in amplitude occurs isothermally, during TGO growth, Agrowth, highlightedin the inset, remaining invariant as the system cycles.A larger increase happens on cooling to ambient. Itis non-linear down to Tceaseyield (Fig. 9), reflecting thedevelopment of plastic strains. Thereafter, the cooling is strictly elastic. On re-heating, because of elastic unloading, the amplitude decreases along thesame path. There is a small non-linear domainabove Treyield (Fig. 9). The consequence is a residualplastic displacement Acycle, highlighted in the inset(Fig. 8). Note that Acycle Agrowth. On a cycleby-cycle basis, the displacements continue toaccumulate (Fig. 8). Effects of T2 and a (Fig. 8) [9]indicate that the qualitative behavior is insensitive tothe parameter selection.Other results (Fig. 10) reveal that the cyclicamplitude change rate decreases as sminY bcincreases [8,9].6. Parabolic thickeningFig. 5. The amplitude change rate subject to large-scale thickening. (a, b) A comparison of the response when the growthstrain is zero and when finite, at fixed thickening per cycle. (c)The amplitude change per cycle normalized by the growth strain(when eg 0) (h0 / L 0.08, A0 / 2L 0.3, h / h0 0.2,T2 600 C, sYminbc 100 MPa).figures, the abscissa refers to time steps t used inthe numerical procedure. It relates to the cycling inthe following manner. Each thermal cycle includesthree steps: (1) cooling from 1000 to 0 C; (2)reheating from 0 to 1000 C; (3) TGO thickeningand growth at 1000 C. In zone A, eplzz accumulatesin each cycle, as the zone yields and re-yields,resulting in a cumulative upward displacement.There is no plastic strain during TGO growth,because the material beneath the TGO unloadselastically. In zone B, eplzz is an order of magnitudesmaller and acts in the opposite direction, indica-Modifications that arise when the TGO thickness increases in a parabolic (non-linear) manner [1,16] are addressed. The thickening law isthat expressed by (1). Conducting such calculations requires a change to the input file forTGO thickening, with a corresponding changein the in-plane growth strain. Both growthstrains, e g and h / h0, are changed to assure thatthey remain proportional, e g / ( h / h0) 0.0375.One set of results (Fig. 11) is typical. It compares the amplitude change rate, d( A) / dN, forlinear and parabolic growth, all other aspectsremaining invariant. The consequence is that,under parabolic conditions, the ratcheting ratediminishes on a cycle-by-cycle basis [Fig. 11(a)]instead of assuming a steady state. Note, however, that the amplitude change per increment inTGO thickness, A / h [Fig. 11(b)], is essentially the same for both kinetic representations.
M.Y. He et al. / Acta Materialia 50 (2002) 1063–10731069Fig. 6. Changes in the two components of the stress for a large-scale TGO thickening simulation. (a) In the region A subject tocyclic yielding and (b) the region B that yields only on cooling. Note that the szz stress is tensile in region A, causing the Misesstress to increase rapidly as the temperature decreases (h0 /L 0.08, A0 / 2L 0.3, h/ h0 0.2, T2 600 C).This trend mimics that measured experimentally(Fig. 12) [6]. Both experiment and simulationreveal that the ratcheting rate decreases by abouta factor of three. Accordingly, the simulationestablishes a direct connection between theratcheting rate and the thickening kinetics ofthe TGO.7. Imperfection size effectTo explore size effects, simulations have beenperformed for ratios of initial TGO thickness toundulation amplitude, h0 / A0, between 0.1 and 4,all for fixed imperfection aspect ratio, A0 / L 0.6, and for linear thickening ( h / L 0.016).The results are plotted in Fig. 13. As in all previoussimulations, the growth rate, d( A) / dN initiallyincreases and then attains a steady state,(d A / dN)ss, after about five cycles. Note from Fig.13(b) that (d A / dN)ss decreases systematically asthe imperfection becomes smaller (larger h0 / A0).There is almost an order of magnitude decreaseover the imperfection size range investigated.However, some ratcheting still occurs at the smallest size, A0 / h0 1 / 4.
1070M.Y. He et al. / Acta Materialia 50 (2002) 1063–1073Fig. 7. The accumulation of the vertical component of the plastic strain, eplzz in regions A and B for the same conditions used todetermine the stresses shown in Fig. 6. The temperatures/times at which the plastic strains arise are highlighted within the insets(h0 / L 0.08, A0 / 2L 0.3, h / h0 0.2, T2 600 C, sYminbc 100 MPa, eg 10 3). Here t refers to the time steps used in thenumerical calculations: (1) cooling from 1000 to 0 C; (2) reheating from 0 to 1000 C; (3) TGO thickening and the growth at 1000 C.8. ConclusionBy developing a sub-routine that allows instability simulations subject to large scale thickeningof the TGO, four principal effects have been demonstrated.(i)The calculations verify previous findings
M.Y. He et al. / Acta Materialia 50 (2002) 1063–10731071Fig. 9. Details of the amplitude changes shown in Fig. 8 forthe first, fifth and tenth cycles (h0 / L 0.08, A0 / 2L 0.3, 3). h / h0 0.2, T2 750 C, sminY bc 100 MPa, eg 10Fig. 8. The changes in imperfection amplitude that occur ona cycle-by-cycle basis for various choices of bond coat properties. The inset shows the amplitude change per cycle arisingbecause of cyclic yielding, Acycle relative to that induced(isothermally) by TGO growth, Agrowth (h0 / L 0.08, A0 / 2L 0.3, h/ h0 0.2, sYminbc 100 MPa, eg 10 3).(ii)(iii)[9] that a lateral growth strain is a necessary condition for continued cycle-bycycle growth of the instability, becausethis strain allows the TGO to elongatewith the bond coat as the imperfectionamplitude increases.The results also verify the earlier predictions [9] that the ratcheting rate is reducedby elevating the high-temperature deformation resistance.A new finding is that there are substantialreductions in instability growth as theimperfection size approaches the thicknessof the initial TGO layer. This predictionFig. 10. The influence of the high temperature yield strengthon the ratcheting (h0 / L 0.08, A0 / 2L 0.3, h / h0 0.2,T2 900 C, eg 10 3).(iv)is consistent with the effect of surfaceplanarization on instability development[14].The calculations demonstrate that theratcheting rate diminishes on a cycle-bycycle basis when the TGO exhibits parabolic growth, contrasting with the steadystate that occurs when the growth is linear.The parabolic simulations are in accordance with experimental measurements [6].
1072M.Y. He et al. / Acta Materialia 50 (2002) 1063–1073Fig. 12. Experimental measurements of the ratcheting rate fora TGO having parabolic growth characteristics [6].Fig. 11. (a) A comparison of the ratcheting rates for linear andparabolic TGO thickening. (b) The same results plotted as theamplitude change per TGO thickness increment, A / h(h0 / 2L 0.3, A0 / 2L 0.3, h /h0 / L 0.016, T2 750 C,sYminbc 100 MPa).AcknowledgementsThe work was supported in part by the Officeof Naval Research under ONR contract no.N00014-99-10170 and by the Advanced Gas Turbine Systems Research program of the Departmentof Energy under grant 01-01-SR093 through theSouth Carolina Energy Research and DevelopmentCenter. Helpful suggestions by the reviewer aregratefully acknowledged.Fig. 13. Effects of the relative imperfection amplitude, A0/h0on the ratcheting rate (A0 / 2L 0.3, h / L 0.016, T2 3750 C, smin).Y bc 100 MPa, eg 10
M.Y. He et al. / Acta Materialia 50 (2002) 1063–1073References[1] Evans AG, Mumm DR, Hutchinson JW, Meier GH, PettitFS. Prog. Mater. Sci. 2001;46:505–53.[2] Miller RA. J. Am. Ceram. Soc. 1984;67:517.[3] Hillery R, editor. NRC Report, Coatings for high temperature structural materials. National Academy Press, 1996.[4] Wright PK. Mater. Sci. Eng. 1998;A245:191–200.[5] Strangman TE. Thin Solid Films 1985;127:93–105.[6] Mumm DR, Evans AG, Spitsberg I. Acta mater.2001;49:2329–40.[7] Gell M, Vaidyanathan K, Barber B, Cheng J, Jordan E.Metall. Mater. Trans. 1999;30A:427–35.[8] He MY, Evans AG, Hutchinson JW. Acta mater.2000;48:2593–601.[9] Karlsson AM, Evans AG. Acta mater. 2001;49:1793–804.1073[10] Tolpygo V, Clarke DR. Acta mater. 2000;48:3283–93.[11] Ambrico JM, Begley MR, Jordan EH. Acta mater.2001;49:1577–88.[12] Strangman TE. PhD Thesis, University of Connecticut,1978.[13] Hemker KJ. Unpublished results.[14] Spitsberg I, Mumm DR, Evans AG. J. Mater. Res., inpress.[15] Karlsson AM, Levi CG, Evans AG. Acta mater., in press.[16] Smialek JL, Jayne DT, Schaeffer JC, Murphy WH. ThinSolid Films 1994;253:285–92.[17] Balint D, Hutchinson JW. Unpublished research.[18] Watanabe M, Mumm DR, Chiras S, Evans AG. Scriptamater., 2002; 46: 67–70.[19] Evans AG, He MY, Hutchinson JW. Prog. Mater. Sci.2001;46:249–71.[20] Rhines FN, Wolf JS. Metall. Trans. 1970;1:1701–5.
Large deformation simulations of cyclic displacement instabilities in thermal barrier systems M.Y. He a,*, . CA 93106-5050, USA b Division of Engineering and Applied Science, Harvard University, Cambridge, MA 02138, USA c Princeton Materials Institute, Princeton University, Princeton, NJ 08540, USA Received 15 August 2001; accepted 18 October .