Transcription
www.acsami.orgResearch ArticleFemtosecond Laser Densification of Hydrogels to GenerateCustomized Volume Diffractive GratingsZheng Xiong, Arun Poudel, Ameya R. Narkar, Zhe Zhang, Puskal Kunwar, James H. Henderson,and Pranav Soman*Downloaded via 63.159.209.50 on June 13, 2022 at 20:27:54 (UTC).See https://pubs.acs.org/sharingguidelines for options on how to legitimately share published articles.Cite This: https://doi.org/10.1021/acsami.2c04589ACCESSRead OnlineMetrics & MoreArticle RecommendationsABSTRACT: Inspired by nature’s ability to shape soft biological materials to exhibit a range of optical functionalities, we reportfemtosecond (fs) laser-induced densification as a new method to generate volume or subsurface diffractive gratings within ordinaryhydrogel materials. We characterize the processing range in terms of fs laser power, speed, and penetration depths for achievingdensification within poly(ethylene glycol) diacrylate (PEGDA) hydrogel and characterize the associated change in local refractiveindex (RI). The RI change facilitates the fabrication of custom volume gratings (parallel line, grid, square, and ring gratings) withinPEGDA. To demonstrate this method’s broad applicability, fs laser densification was used to generate line gratings within thephenylboronic acid (PBA) hydrogel, which is known to be responsive to changes in pH. In the future, this technique can be used toconvert ordinary hydrogels into multicomponent biophotonic systems.KEYWORDS: femtosecond laser, densification, refractive index, hydrogel, diffractive grating, pH sensorof key analytes within their matrix.18 Methods based onlithography19 (E-beam,20 multibeam interference,21 nanoimprinting,22 and digital projection15) have been widely usedto fabricate nano-/microstructures on hydrogel surfaces andmodify their refractive indices (RI) and light shaping properties.17 However, for subsurface or volumetric processing ofhydrogels in a user-defined manner, two-photon-absorptionbased laser writing may be the only realistic method of choice asit can generate customized patterns within ordinary hydrogelswith high design flexibility in 3D.23 29 Being embedded within ahydrogel matrix, printed structures are free from opticalmisalignment issues or damage during handling yet facilitatethe modulation of pattern periodicity via analyte diffusion withinthe porous matrix. Previously, our group showed that femtosecond (fs) laser writing can generate “densified” structures1. INTRODUCTIONEvolution has provided many strategies to manipulate light byshaping ordinary materials (chitin, keratin, and cellulose) intohierarchical structures to satisfy specific biological functions,something even sophisticated man-made manufacturing findschallenging to replicate.1 For instance, many organisms arecapable of changing the size or periodicity of nano-/microscalepatterns to dynamically modulate their optical properties.Although such periodic patterns are commonly found onsurfaces, organisms such as chameleons, cuttlefish, and squidhave skin with subsurface or embedded patterns of crystalswhich, upon stimulation, modulate their periodicity, resulting ina change in skin color.2 5 Inspired by such natural photonicstructures, researchers have developed new processing methodsto generate custom patterns on or within ordinary materials andconvert them into “smart” optical devices.6,7Compared to conventional optical materials (semiconductors, glass, metals, and polymers), hydrogels have gainedwidespread utility in biomedical applications because of theirclose resemblance to the cellular microenvironment and theirexcellent optical transparency.8 17 Hydrogels exhibit 3D crosslinked networks of hydrophilic polymers, which allow diffusion XXXX The Authors. Published byAmerican Chemical SocietyReceived: March 15, 2022Accepted: May 31, 2022Ahttps://doi.org/10.1021/acsami.2c04589ACS Appl. Mater. Interfaces XXXX, XXX, XXX XXX
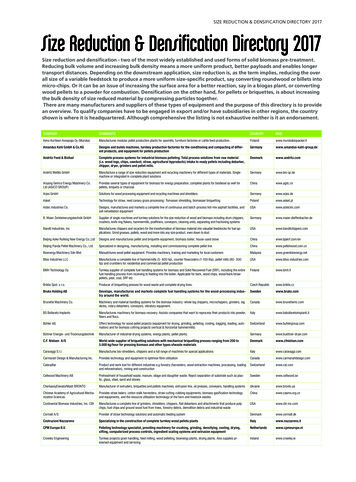
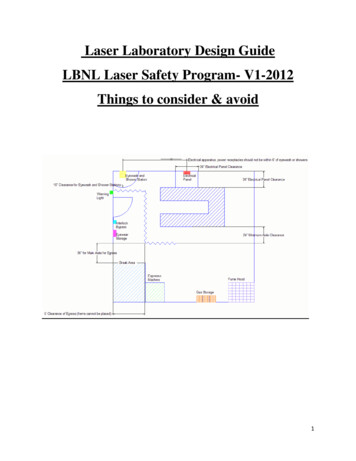
ACS Applied Materials & Interfaceswww.acsami.orgResearch ArticleFigure 1. (A) Sketch of a custom-built femtosecond laser fabrication platform to generate subsurface densified or ablated patterns within the volume ofpartially cross-linked hydrogel. Inset depicts schematic of cross-linking of PEGDA monomers with exposure to a fs laser. With increased laser dosage,ablation of voids via cavitation is depicted. (B) Schematic of a testing setup to capture diffraction pattern generated by a hydrogel with embeddedgratings.then transferred to well plates and incubated in PBS for 24 h to facilitateremoval of un-cross-linked prepolymer before testing them at 25 C byusing a rheometer (8 mm diameter bottom plate, gap 0.5 mm).Storage modulus (G′) and loss modulus (G″) were measured at 0.5%strain for a range of 0.1 100 Hz. The elastic modulus was calculated bywithin ordinary gelatin-based hydrogels, which can be used asbiophysical cues to align cells encapsulated within the gelatinmatrix.30 In the present work, we investigate whether fs laserdensification induced RI change can be used to print customvolume diffractive gratings within ordinary poly(ethyleneglycol) diacrylate (PEGDA) hydrogels and pH-responsive 3(acrylamido)phenylboronic acid (PBA) hydrogels. We anticipate this design and processing strategy can be used to makeintegrated photonic systems using a large library of smarthydrogels.the equation E 2G(1 τ), where G G′ 2 G″ 2 , where thePoisson’s ratio, τ, was assumed as 0.33. The linear regions of bothmoduli recorded between 1 and 10 Hz were used to calculate the elasticmodulus (E). The swelling behavior was assessed by first immersingpartially cross-linked hydrogel samples in PBS for 12 h under roomtemperature, followed by measuring the weight ratio between dried andswollen states with a laboratory balance (Thermo Scientific).Femtosecond Laser Writing Setup. A custom laser fabricationplatform was designed and built by combining a wavelength-tunableTi:sapphire fs laser (Coherent, Chameleon, USA) with a Zeissmicroscope (Observer Z1, Germany), as shown in Figure 1A. Thebeam from the fs laser (wavelength tunable from 690 to 1080 nm, 80MHz, 140 fs) is expanded 3 times to fully fill the back-aperture of anobjective. The laser beam is directly focused inside a hydrogel sample,which is mounted on an XYZ stage of the Zeiss microscope. A λ/2waveplate and Glan-Taylor polarizer (Thorlabs, USA) is combined toachieve a polarization-based power tuning system. A halogen brightlight source (450 nm long-pass filter) is used for illumination, and aHamamatsu FLASH4.0 V3 sCMOS digital camera is used to captureimages of fs laser processing within hydrogels in real time. The wholesystem is automatically controlled by using the Visual Basic forApplication (VBA) interface within the Zeiss microscope software.Femtosecond Laser Densification Process Flow. Hydrogelsamples were fabricated in two steps. In the first step, the prepolymersolution composed of 90% PEGDA and 0.25% photoinitiator, LAP, waspipetted between two glass slides with a 1 mm thick PDMS spacer andthen partially cross-linked. In the second step, the fs laser, focused by ahigh numerical aperture objective lens (NA 0.55, 10 , Zeiss,Germany), was used to generate user-defined patterns by moving thestage controlled by a custom-written Visual Basic code (Figure 1). Thelaser dosage was changed by modulating the average power of the laserusing the polarization-based tuning system or by modulating thescanning speed of the XY stage.2. METHODSPEGDA Prepolymer Preparation. Poly(ethylene glycol) diacrylate (PEGDA, Mn 700 Da) and phosphate buffered saline (PBS) werepurchased from Sigma-Aldrich and used without further modification.The photoinitiator, lithium phenyl-2,4,6-trimethylbenzoylphosphinate(LAP), was synthesized by using a previously established protocol.30The prepolymer solution was composed of varying amounts of PEGDA(10% 90%, v/v) with LAP (0.25%, w/v, for all compositions). Theprepolymer solution was mixed for 10 min by using a magnetic stirrer,filtered (pore size 0.2 μm), and used within 2 days after preparation.During the fabrication process, 30 μL of the prepolymer solution waspipetted onto a microscope glass slide (48 mm 24 mm, FisherScientific) that was surface modified by using Sigmacote (SigmaAldrich). A PDMS spacer (Sigma-Aldrich) was placed between themicroscope slide (bottom) and a glass coverslip (top) to control theprepolymer layer thickness of 1 mm.Characterization of PEGDA Prepolymer and Partially CrossLinked PEGDA Samples. Refractive indices of cross-linked sampleswere directly measured by using digital refractometer (Sper Scientific).To characterize absorption properties, absorption spectra of thehydrogel samples held in plastic cuvettes were measured by using ascanning spectrophotometer from 250 to 1100 nm (ThermoScientific). The elastic modulus was measured by using a standardrheometer (AR2000, TA Instruments, USA). Briefly, samples wereprepared by casting the prepolymer solution in a PDMS mold (8 mmdiameter, 100 μm thickness) and by partially cross-linking using UVlight (power 3.5 mW cm 2, Omnicure S2000) for 10 s. Samples wereBhttps://doi.org/10.1021/acsami.2c04589ACS Appl. Mater. Interfaces XXXX, XXX, XXX XXX
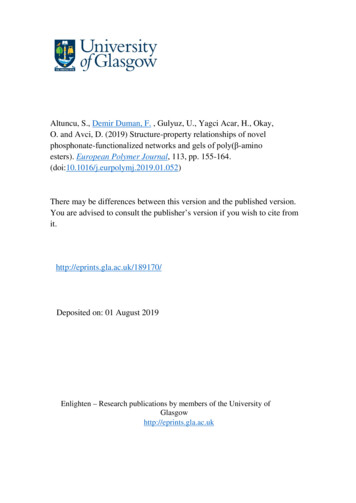
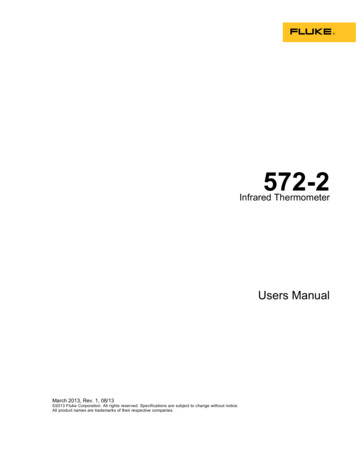
ACS Applied Materials & Interfaceswww.acsami.orgResearch ArticleFigure 2. Characterization of PEGDA hydrogels with different concentrations (10%, 30%, 50%, 70%, and 90%). Gross visualization (A) andabsorption spectrum plot (B) demonstrate that the optical transparency increases in visible wavelength range with an increase in PEGDAconcentration. (C) Refractive index increases from 1.35 to 1.48 with increasing PEGDA concentration. (D) Elastic modulus and swelling ratio increasewith an increase in PEGDA concentration. Black arrow in (B D) point to the selection of PEGDA 90% as the base material for this work.to solutions of varying pH, and changes in the distance between firstorder maxima within the diffractive patterns were recorded. Briefly,Tris-HCl buffer solution (pH 8.59) was prepared, and the solutions ofdifferent pH value were obtained by adding a calculated amount of 1 MNaOH solution. The volume of NaOH solution required to reach acertain pH in 6 mL of buffer solution was recorded by using a pH meter(FiveEasy F20, Mettler Toledo), and during an experiment the samevolume was added to the buffer solution to obtain the desired pH.Diffraction patterns were captured by a digital single lens reflex camera(Canon EOS Rebel T6i), analyzed by using ImageJ, and plotted inOrigin. All experiments were repeated three times.Characterization of PEGDA Samples with Densified Subsurface Gratings. Post-writing, PEGDA samples were imaged by usingphase-contrast (Lecia DM6000, Germany) and confocal microscopy(Zeiss observer X1). Samples were kept hydrated during phase-contrastmicroscopy whereas samples were incubated in Rhodamine B solution(10% w/v) for 2 min, washed three times with PBS before confocalimaging (10 objective). Images were reconstructed by using Zeiss Zensoftware. The setup shown in Figure 1B was used to visualize thediffraction patterns. Briefly, a He Ne laser (11 mW, Thorlabs, USA)was used to irradiate samples with embedded gratings. A CMOS camera(Thorlabs, USA) placed 100 mm from the sample was used to capturethe diffraction pattern. A power meter (Newport, USA) mounted on alinear stage (Thorlabs, USA) at the same location as the camera wasused to measure intensity of each diffraction order.Fabrication and Characterization of Phenylboronic Acid(PBA) Hydrogel with Embedded Gratings. A precursor consistingof 1 M hydroxyethylacrylamide (HEAA), 40 mol % PBA, and 6 mol %methylenebisacrylamide (MBAA) (both PBA and MBAA were relativeto HEAA) was dissolved in a solution containing 1585.5 μL of dimethylsulfoxide (DMSO) and 2000 μL of deionized (DI) water. Thephotoinitiator, LAP, was maintained at 1 wt %. A 1 mm thickrectangular sample was prepared by pipetting the precursor solutionwithin a space created by two standard glass slides and spacers. Thewhole construct was kept in a UV box (B9Creations Model Cure LightBox, λ 390 410 nm, 65 D) and cross-linked for 4 s. This duration waschosen to keep the hydrogel in a partially cross-linked state. Sampleswere washed in DI water and soaked in 0.1% LAP solution for 10 minbefore fs laser densification of line gratings was performed at a power of400 mW and a scanning speed of 400 μm/s with a 50 objective (0.55NA, Zeiss). Resultant diffraction patterns were recorded by using awhite screen placed 1.5 m from the sample. Samples were then exposed3. RESULTSCharacterization of PEGDA Prepolymer and PartiallyCross-Linked Samples. To develop durable samples, thePEGDA composition was optimized by using the dual criteria ofhigh optical transparency and mechanical stability. Weinvestigated the optical loss for PEGDA hydrogels by choosinga range of concentrations (10%, 30%, 50%, 70%, and 90% v/v)in Figure 2A. PEGDA hydrogels with 10% concentration held ina standard cuvette were white in color, indicating scatteringacross the visible spectrum. With increasing concentration, thePEGDA hydrogels became more transparent. (Figure 2B).PEGDA 10% had a normalized absorption of 0.4, while theabsorption gradually dropped to 0.2 with increasing concentration over 50%. The refractive index (RI) increased linearlywith the prepolymer concentration, reaching a maximum of 1.48for 90% PEGDA hydrogels (Figure 2C). The elastic modulus ofChttps://doi.org/10.1021/acsami.2c04589ACS Appl. Mater. Interfaces XXXX, XXX, XXX XXX
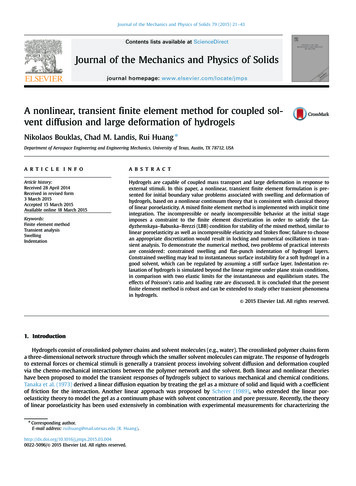
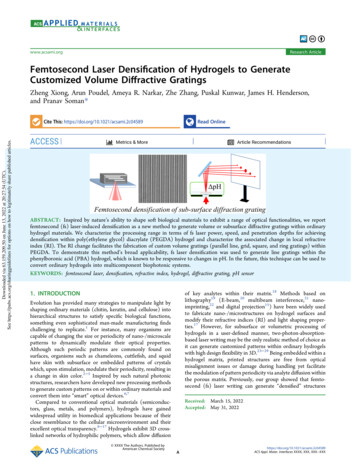
ACS Applied Materials & Interfaceswww.acsami.orgResearch ArticleFigure 3. Characterization of fs laser hydrogel modification in the densification (green) and ablation (red) regimes as a function of laser power withconstant print speed (A), processing speed with constant power (B), and processing depth with constant speed and power (C). Phase contrast images(top view) are shown for data points highlighted with a green circle (densification) or red circles (ablation). Scale bar: 10 μm.PEGDA hydrogels, as measured by rheometer, increased withincreasing PEGDA concentration Figure 2D; for 90% PEGDA,the modulus was 176 kPa. Swelling tests were performed toinvestigate the stability of the optical properties in an aqueousenvironment. The swelling ratio in Figure 2D increased asPEGDA concentration increased from 1.05 to 1.51. For 90%PEGDA, circular sample showed no visible deformation or anychanges in transparency (inset in Figure 2D). On the basis ofthese results, 90% PEGDA was chosen for all subsequent studies.Characterization of Densification Range as a Functionof Laser Power, Speed, and Penetration Depth. Hydrogelsamples (90% PEGDA) were partially cross-linked by using UVlight, and these samples were used to generate definedembedded gratings via the fs laser densification process. Theexposure time for UV cross-linking was carefully controlled toensure the presence of free acrylate groups due to incompleteconversion of acrylate double bonds into covalent bonds. The fslaser dosage was increased by changing either the power or thestage speed based on the schematic of fs laser densification andablation with increasing laser dosage (inset in Figure 1). At lowerdosages, free acrylate groups are converted into covalent doublebonds by two-photon cross-linking in the presence of photoinitiator (LAP).31 This process is different than regular singlephoton UV cross-linking, as densification processing likelyDhttps://doi.org/10.1021/acsami.2c04589ACS Appl. Mater. Interfaces XXXX, XXX, XXX XXX
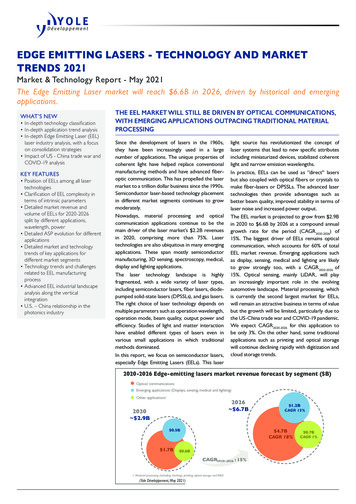
ACS Applied Materials & Interfaceswww.acsami.orgResearch ArticleFigure 4. (A) Schematic of the testing setup with several parameters: n is the refractive index of base hydrogel while Δn is the change in refractive indexdue to laser-induced densification of line grating structure with period, d 10 μm, width, and a 1 μm. (B) Phase contrast image (top view) of adensified line grating with a higher RI as compared to the surrounding materials. The cross section shows the grating height, h 14.52 μm. (C)Photograph of the grating’s diffraction pattern. (D) Intensity ratio between zeroth diffraction order and first diffraction order and theoreticalcalculation of corresponding refractive index change (Δn 0.0051). Scale bar: 10 μm.measure the intensity at the zeroth, first, and second diffractionorder of the pattern, and the RI change Δn was calculated byusing the diffraction efficiency at various diffraction orders. Theefficiency as a function of the RI change is derived based onFourier optics as follows.32 For a phase grating, the transmissionfunction can be written asresults in collapse and compaction of PEGDA chains, resultingin a region that appears brighter as compared with the rest of theUV-cross-linked PEGDA. Further increasing the laser dosagecaused ablated cracks or voids. Next, we identified experimentalconditions to achieve reliable densification of structures within90% PEGDA. To do this, laser power, speed, and processingdepth were systematically varied, and the resultant changes inthe width of the line patterns were measured. An increase in laserpower led to continuous material modification shifting fromdensification to ablation with a constant stage speed of 1000μm/s. We also observed an increase in the width of the densifiedlines and the ablated microcracks (Figure 3A). Additionally,increasing the scanning speed resulted in a decrease in the widthof densified lines with a constant power of 200 mW (Figure 3B).On the basis of these results, we chose a power of 200 mW and astage speed of 1000 μm/s and characterized the processingdepth range to reliably generate densified patterns. We alsofound that patterns could be generated in the range 100 500μm below the surface (within the matrix) (Figure 3C).Calculation of Refractive Index Change Due toDensified Gratings. An optimized laser power of 200 mWand a scanning speed of 1000 μm/s were used to obtainmicrostructures within 90% PEGDA hydrogel samples. Aschematic and a representative image of the fabricated phasegrating at a depth of 200 μm within 90% PEGDA are shown inFigure 4A,B. Phase-contrast microscopy imaging (top view)shows fs laser densified regions as brighter than the surroundinghydrogel, indicating an increase in RI of densified structures.The size (a 1 μm) and spacing (d 10 μm) give the duty ratioρ as 1:10. The height, h, of the grating was measured as 14.52 μmby imaging the cross section of the sample. The RI changebetween densified and unmodified PEGDA can be representedby n Δn, where n is the RI of unmodified PEGDA. To measurethe change in RI, a He Ne laser beam (λ 632.8 nm, 11 mW)was used to irradiate the embedded grating, and the energydistribution of the diffraction orders was measured. Thediffraction pattern (Figure 4C) was captured by using aCMOS camera behind the sample. A power meter was used to1ixyixyt(x , y) (ei(ϕ Δ ϕ) ei Δ ϕ) rectjjj zzz combjjj zzz eiϕdka{kd{(1)where the original phase ϕ 2π (n Δn)h,λthe RI induced phase2π Δnh,λdifference Δϕ h is the grating height, d is the period ofthe grating, and a is the line width. Here we assume the laserinduced RI change is uniform in the modified region. Thediffraction spectrum F[t(x,y)] of eq 1 can be calculated by usingFourier transformation, and the actual diffraction energydistribution I(x,y) is the product of the diffraction spectrumconjugates:I(x , y) ⟨F[t(x , y)]F *[t(x , y)]⟩(2)On the basis of eq 2, the efficiency of mth diffraction order, ηm,can be calculated byη0 1 2ρ(1 ρ)(1 cos Δϕ)ηm 1 1(1 cos 2mπρ)(1 cos Δϕ)m2π 2(3)where ρ is the duty ratio of the volume grating, in this case 1:10.On the basis of eq 3, the theoretical relationship between theRI and the intensity ratio is plotted in Figure 4D. By taking theratio of measured light intensities of diffraction orders first andzeroth (0.01087), the corresponding RI change within thedensified grating is calculated as 0.0051. This result shows thepotential of fs laser densification to make embedded diffractioncomponents within hydrogels for biophotonics 89ACS Appl. Mater. Interfaces XXXX, XXX, XXX XXX
ACS Applied Materials & Interfaceswww.acsami.orgResearch ArticleFigure 5. Custom-defined subsurface grid, square, and ring gratings generated by fs laser densification within partially cross-linked PEGDA hydrogel.Confocal images facilitated by Rhodamine B staining clearly highlight the increased density of embedded microstructures while photographs capturedat far field show the generated diffracted patterns. Scale bar for bright field and confocal images: 50 μm.Figure 6. (A) Phase contrast image of subsurface grating densification within phenylboronic acid (PBA) hydrogel with periodicity of 3 μm. (B)Schematic of testing setup depicts capture of the diffraction pattern on a screen. (C) Series of photos showing the changes in the distances betweenfirst-order maxima when PBA hydrogels are immersed in a buffer solutions of different pH values. (D) Plot showing response dynamics of the PBAbased pH detector (marking shows the onset of pH detection).Generation of Customized Subsurface Patterns. Next,we used the optimized fabrication parameter (200 mW laserpower and 1000 μm/s scanning speed) and generated severalembedded beam shapers, including grid, square, and ringgratings, inside 90% PEGDA hydrogel by using the fs laserinduced densification method. Phase contrast and confocalFhttps://doi.org/10.1021/acsami.2c04589ACS Appl. Mater. Interfaces XXXX, XXX, XXX XXX
ACS Applied Materials & Interfaceswww.acsami.orgimages of densified patterns show higher brightness andfluorescence intensity respectively as compared to thesurrounding material (Figure 5). Their optical properties ofdensified lines in terms of far-field diffraction patterns are alsopresented. Grid and square gratings exhibit symmetricaldiffraction points, while the ring grating exhibits a centralbeam of high intensity (zeroth order) with associated concentrichigh-order cone beams. Minor distortion in some diffractedpoints can be attributed to misalignment of the He Ne laserused for testing. This result shows that fs laser densification canbe used to generate customized subsurface diffraction patternswithin ordinary hydrogels.Densification within Phenylboronic Acid (PBA) Hydrogel. Here, we tested whether fs laser densified line gratingsgenerated in pH sensitive hydrogels can be used to detect pH bymonitoring changes in grating periodicity. Partially cross-linkedPBA hydrogel samples (UV light, 4 s) were used to patternsubsurface line gratings by using fs laser densification (Figure6A). Upon exposure to solutions of varying pH, the hydrogelsswelled, resulting in a change in the grating period, which in turnresulted in a change in the distances between first order maximaof the projected diffractive patterns (Figure 6C). The change ingrating period (d) resulted in a change in the diffraction angleand changes in the first-order maxima spacing following theequation gm L tan ϕm, where gm is the distance between zerothorder with m order (in our case m 1), L is the distance fromsample to capturing screen (1.5 m), diffraction angle of mthorder ϕm sin 1(kλ/d) where k is integral number, λ is theHeNe wavelength (0.6328 μm), and d is the period of thegrating (3 μm). Only lateral swelling of densified patterns wasused for this characterization, as vertical swelling, if any, wouldbe negligible due to the large distance between the sample andthe capturing screen. Maximum swelling was observed beyondpH 8.8, with the swelling nearly plateauing beyond pH 9 (Figure6D). Moreover, we observed a consequent decrease in thedistance between two first-order maxima. Although this resultshows that fs laser densification can be extended to otherresponsive hydrogels, more work needs to be done to improvethe linearity, specificity, and accuracy of hydrogel detectorsbefore they can be implemented in practice.this work, we show that fs laser densification allows thetransformation of ordinary hydrogels into photonic diffractiveelements by fabricating user-defined subsurface gratingstructures.As compared to conventional photonic materials, fs lasermodification within hydrogels is still in its infancy. Previouswork has shown that focusing ultrafast laser pulses insidetransparent hydrogels induces localized permanent structuraldensification. Our results show that a RI change of 0.0051between densified and surrounding hydrogel is sufficient tomodulate the properties of light. This falls within the reported RIchange range for polymeric materials.34,35 With increasing fslaser dosage, two regimes of densification and ablation werecharacterized. Below specific laser power, stage speed, andpenetration depth thresholds (Figure 3), local densification wasobserved, while working above the thresholds resulted in theformation of hollow voids or unstable bubbles within thehydrogel matrix. In this work, we focus on the densificationphenomenon.At present, fs laser-induced densification in both conventionaloptical materials and hydrogels remains poorly understoodbecause of the involvement of multiple nonlinear processes.Control experiments were performed to show that densificationby a fs laser is distinct from simple photo-cross-linking usingsingle-photon polymerization by conventional light sources (UVlamps and lasers). For instance, partially cross-linked sampleswith fs laser densified lines were irradiated with a UV lamp for upto 10 min to ensure complete cross-linking, and yet densifiedlines remain visible and appear brighter as compared to thesurrounding hydrogel. We also found that the presence ofphotoinitiator (LAP) is necessary for fs laser densification.Others have reported no change in Raman spectra of densifiedlines, an indicator of material chemistry, even with a significantRI change of 0.06.25,27,29,36 This suggests that densificationinduced RI change below the damage threshold of the hydrogeldoes not change the polymer composition, which impliesadditional cross-linking of the same hydrogel material due tolocal heat accumulation at the laser focus. The underlying causeof RI change via fs laser densification within hydrogels remainsunclear, but it likely involves collapse or entanglement ofpolymer chains or water expulsion from densified regions due tolocal heat accumulation at the laser’s focal point.Surface patterning of nano-/microstructures on hydrogelsthat respond to specific analytes (pH, glucose) by swelling is anactive research field. PBA-based hydrogels have been used todetect analytes such as glucose,37 CO2,38 temperature,39 andpH.40 In this work, solutions of varying pH were used tocharacterize changes in diffractive patterns of embedded linegrating. Subsurface densified patterns show a narrow range ofdetection with a nonlinear response. The nonlinearity in the pHplot is linked to the pKa value of PBA 8.841 (Figure 6D). At pH pKa, the hydrogel sensor is in its equilibrium state because thePBA exists in an uncharged trigonal conformation. As thehydrogel approached the pKa value of phenylboronic acid( 8.8), this equilibrium shifts toward a charged tetrahedralstructure, thus causing swelling of the hydrogel sensor andinitiating a change in diffractive pattern spacing.Before this method can be used to make hydrogel-basedphotonic devices, substantial work must be performed. Forinstance, the depth of subsurface patterning is limited by thetransparency of the hydrogel matrix, which limits the method’susefulness for making multilayered volumetric photonicelements. To resolve this issue, hybrid fs laser processing, a4. DISCUSSIONInspired by nature’s manufacturing strategy to create structuralphotonics, many strategies have been used to make hydrogelbased photonic devices for a range of biomedical applications.17Most current methods focus on patterning the surface of naturaland synthetic hydrogels (silk, chitin, chitosan, BSA, polyacrylamide, poly(acrylic acid) , PEGDA, and PDMS) for manyphotonic applications. However, fabrication of subsurface orvolumetric gratings within hydrogels remains challenging. Otherthan fs laser densification, subsurface patterning can be alsoachieved by Multibeam interference lithography (MBIL) andbottom-up self-assembly-based methods; however, thesemethods have key limitations.33,34 For instance, MBIL canonly fabricate periodic structures with geometries that areallowed by the incident angles, wavelengths, and intensities ofthe interfering beams. On the other hand, bottom-up strategies,although faster and scalable, rely on self-assembly processesoptimized for specific materials and process conditions, limitingtheir use to fabricate custom-designed defect-free subsurfacestructures with precise orientation and/or alignment. Therefore,conversion of ordinary hydrogels into photonic elements withcustom pattern designs remains difficult with these methods. InGResearch Articlehttps://doi.org/10.1021/acsami.2c04589ACS Appl. Mater. Interfaces XXXX, XXX, XXX XXX
ACS Applied Materials & Interfaces www.acsami.orgACKNOWLEDGMENTSWe gratefully acknowledge funding from NIH’s R21AR076645and R21AR076642 and NSF’s DMR-1609523 grants. We arealso grateful for funding from NSF’s Advanced Manufacturingprogram (CMMI-2022421).new method that is independent of materials’ optical properties,can be used to pattern densified structure at virtually any depthwithin the hydrogel matrix.42 The RI can also be enhanced byperforming fs laser densification in the presence of dyes,nanoparticles, and metallic ions. Moreover, material propertiesand pattern designs need to be optimized to increase detectionrange, sensitivity, and specificity for biosensing applications.43 46 Overall, fs laser densification will pave the way forminiaturized and integrated hydrogel-based photonic systemswhere multiple photonic elements are embedded within ahydrogel matrix, a capability not achieved by surface structuringmethods.47 REFERENCES(1) Vaz, R.; Frasco, M. F.; Sales, M. G. F. Photonics in Nature andBioinspired Designs: Sustainable Approaches for a Colourful World.Nanoscale Adv.
Femtosecond Laser Densification of Hydrogels to Generate Customized Volume Diffractive Gratings Zheng Xiong, Arun Poudel, Ameya R. Narkar, Zhe Zhang, Puskal Kunwar, James H. Henderson,