Transcription
United StatesDepartmentof AgricultureForest ServiceRocky MountainResearch StationResearch PaperRMRS-RP-58May 2006Comparison of Crown FireModeling Systems Used inThree Fire ManagementApplicationsJoe H. Scott
Scott, Joe H. 2006. Comparison of crown fire modeling systems used in three firemanagement applications. Res. Pap. RMRS-RP-58. Fort Collins, CO: U.S. Department ofAgriculture, Forest Service, Rocky Mountain Research Station. 25 p.AbstractThe relative behavior of surface-crown fire spread rate modeling systems used in three firemanagement applications—CFIS (Crown Fire Initiation and Spread), FlamMap and NEXUS—is compared using fire environment characteristics derived from a dataset of destructivelymeasured canopy fuel and associated stand characteristics. Although the surface-crownmodeling systems predict the same basic fire behavior characteristics (type of fire, spread rate)using the same basic fire environment characteristics, their results differ considerably. Acrossthe range of inputs used in these comparisons, CFIS predicted the highest incidence of crownfire and the highest resulting spread rates, whereas FlamMap predicted the lowest crown fireincidence and lowest spread rates. NEXUS predictions fell between those two systems.Keywords: forest fire behavior modeling, transition, crown fraction burned, rate of spread,FlamMap, NEXUS, CFISAuthorJoe H. Scott is a Research Forester, Systems for Environmental Management, Missoula, Montana. Joehas more than 15 years experience in wildland fire science research and development, including 10 years withSystems for Environmental Management in Missoula, MT. He has conducted investigations of surface andcanopy fuel characteristics, fire behavior modeling, and crown fire hazard assessment. Joe is the leaddeveloper of NEXUS, a computer system for assessing crown fire potential; lead developer of FireWords, anannotated, illustrated glossary of wildland fire science terminology; co-developer of FuelCalc, a system forcomputing summarizing and formatting ground, surface and canopy fuel characteristics; and lead developerof a new set of standard fire behavior fuel models for national application. Joe earned a B.S. in Forestry andResource Management from the University of California at Berkeley, an M.S. in Forestry from the Universityof Montana, and is a Certified Forester as recognized by the Society of American Foresters.AcknowledgmentsPreparation of this manuscript was supported by the Fire Modeling Institute, Missoula Fire SciencesLaboratory, Rocky Mountain Research Station, USDA Forest Service; and by Systems for EnvironmentalManagement. I am grateful for the review comments provided by James Agee, University of Washington; PatriciaAndrews, Missoula Fire Sciences Lab; Miguel Cruz, ADAI, Portugal; Mark Finney, Missoula Fire Sciences Lab;Pete Fule, University of Arizona; Russ Parsons, Missoula Fire Sciences Lab; and Jan Van Wagtendonk, USGSYosemite Field Station.You may order additional copies of this publication by sending yourmailing information in label form through one of the following media.Please specify the publication title and number.Telephone(970) 498-1392FAX(970) 498-1122E-mailWeb siteMailing Publications DistributionRocky Mountain Research Station240 West Prospect RoadFort Collins, CO 80526
Table of ContentsPageIntroduction . 1Study Areas . 2Fire Environment . 3Background: Component Models . 6Crown Fire Spread Rate . 6Crown Fire Occurrence or Initiation . 8Sustained Active Crown Fire Spread . 11Final (Surface-Crown) Spread Rate . 13Crown Fire Modeling Systems .FlamMap .NEXUS .CFIS (Crown Fire Initiation and Spread).13131415Results .Crown Fire Occurrence .Potential for Active Crown Fire .Type of Fire .Final Rate of Spread .1515151818Discussion . 22Management Implications . 23References . 24
Comparison of Crown FireModeling Systems Used inThree Fire ManagementApplicationsJoe H. ScottIntroductionEarly efforts to predict wildland fire behavior characteristics were focused onsurface fires, primarily their rate of spread and intensity. Later research and development efforts have produced several physics-based research models (Albini 1996,Butler and others 2004, Grishin 1997, Linn and others 2002) and operational models(Cruz and others 2004, 2005, Forestry Canada Fire Danger Group 1992, Rothermel1991) for predicting crown fire occurrence and spread rate. The physics-based models,based on principles of combustion chemistry, fluid dynamics, and heat transfer, arecalculation intensive and costly to operate, precluding their application to most firemanagement problems. However, physics-based models could be used to study avariety of wildland fire phenomena (Linn and others 2002), including fire-atmosphereinteractions, plume domination, ember transport, steady-state spread, and initiationand cessation of crown fire. Operational models of crown fire spread rate, based largelyon empirical data collected on both unplanned and experimental fires, are simplemathematical models whose great speed of calculation and relative ease of use allowsapplication to important fire management problems at large spatial and temporal scales(for example, assessing fire potential across a large landscape, or predicting large firegrowth over many days). Unlike the physics-based models, which enjoy broaderapplicability, valid use of empirical models is restricted to situations similar to thoseon which the models were built.For purposes of this paper, a fire model is defined as a mathematical relationship thatdescribes a single aspect of a fire (Andrews and Queen 2001). Rothermel’s (1972)model for predicting flame front spread rate at the head of a surface fire is a notableexample. A fire modeling system is a series of fire models used in concert to predictanother aspect of fire. For example, separate models of surface fireline intensity andminimum fireline intensity crown fire initiation are used together to predict whethera crown fire can initiate (Alexander 1988, Van Wagner 1977). A fire managementapplication is one or more models or systems applied coherently to support firemanagement decisionmaking. FARSITE, for example, is a fire management application incorporating dozens of models and modeling systems to simulate fire growthacross a two-dimensional landscape; its output is used to support decisions regardingappropriate response on wildfires and wildland fire use incidents.A variety of surface-crown spread rate modeling systems have been incorporatedinto fire management applications over the past decades, including BehavePlusversion 3 (Andrews and others 2005), the Canadian Forest Fire Behavior PredictionSystem (CFFBPS; Forestry Canada Fire Danger Group 1992), FARSITE (Finney1998), FlamMap (Finney and others 2006), FFE-FVS (Reinhardt and Crookston2003), FMAplus (Carlton 2005), NEXUS (Scott 1999, Scott and Reinhardt 2001), andUSDA Forest Service Res. Pap. RMRS-RP-58. 20061
CFIS (Crown Fire Initiation and Spread; Cruz and others 2005). The surface-crownspread rate system in each of those applications integrates separate models of surfacefire behavior characteristics (intensity or fuel consumption), transition to crown fire(or crown fire occurrence), and crown fire spread rate. Of the eight systems identifiedabove, six (all but CFIS and CFFBPS) are built upon a common set of component firemodels that includes Rothermel’s (1972) surface fire spread rate and (1991) crown firespread rate models, and Van Wagner’s (1977) crown fire initiation and spread models.Of those six systems, FlamMap and FARSITE employ identical surface-crown spreadrate systems. FlamMap 3.0 and FARSITE 4.1.05 now include a switch that enables theuser to select between their standard method (Finney 1998) and a new method basedlargely on NEXUS (Scott and Reinhardt 2001). The FlamMap and FARSITE implementation of Scott and Reinhardt (2001) does not include condition crown fire, but in allother respects is identical to the results of NEXUS. This paper will help a user interpretthe impact of that switch on fire behavior simulations. The surface-crown systems inFFE-FVS and BehavePlus are consistent with that of NEXUS. FMAplus can be set, atthe user’s discretion, to use the surface-crown system of either FARSITE/FlamMap orNEXUS. Therefore, detailed comparison of the surface-crown spread rate systems inFlamMap, NEXUS, CFIS, and CFFBPS covers the range of surface-crown spread ratesystems used in current fire management applications. For most fuel types, theCFFBPS integrates surface and crown fire spread rates into a single predictive equationthat encompasses the full range of behavior, whether surface or crown. However, forfuel type C-6 (conifer plantation), separate equations are used for surface and crownfire behavior, and a transition function is used to scale between the separate predictions– the first implementation of such a dual-equation approach in an operational system.However, due to fundamental differences in inputs between the CFFBPS and theothers, I do not include the CFFBPS in the detailed comparisons.The purpose of this paper is to compare the primary outputs of the surface-crownspread rate systems used in CFIS, FlamMap, and NEXUS. The descriptions andcomparisons presented in this paper will be useful for interpreting output from those firemanagement applications.Study AreasRather than exercise each system through the entire range of possible input values, asin a sensitivity analysis, I made the comparisons for five intensively sampled coniferstands for which stereo photographs, stand data, and canopy fuel characteristics werereadily available (Scott and Reinhardt 2005): ponderosa pine/Douglas-fir (PPDF)pure ponderosa pine (PP)Douglas-fir (DF)lodgepole pine (LP)Sierra Nevada mixed conifer (SNMC).The multi-storied PPDF stand is located on a gentle NE-facing slope west of Missoula,Montana. The ponderosa pine overstory is approximately 120 years old. Douglas-fir hasestablished in the under- and middle-story, creating continuous canopy fuel from theground to the top of the canopy. The single-storied PP stand is located on a gentle slopenear Flagstaff, Arizona. Ponderosa pine is both the existing and potential naturalvegetation type, even without fire; no other conifer species are present in this forest. Theplot was established in the densest part of a dense stand, thus the high initial basal area(BA 69.0 m2 ha–1; table 1). The single-storied DF stand is located on a moderately steepsoutheast-facing slope southwest of Salmon, Idaho. Douglas-fir dominates the plot, with2USDA Forest Service Res. Pap. RMRS-RP-58. 2006
Table 1—Stand and fuel characteristics of five conifer stands. Site and stand characteristics arefrom Scott and Reinhardt (2002). Canopy fuel characteristics are from Scott andReinhardt (2005). Surface fuel and miscellaneous characteristics are assumed orcalculated from other inputs.PPDFPPDFLPSNMCSlope (pct)AspectElevation (m)6NNE1050Site characteristics1125SSE230823007NE22907NNE1300SD (# ha–1)BA (m2 ha–1)SH (m)CC (pct)48130.42359Stand 238246.83474CBD (kg m–3)CBH (m)CFL (kg m–2)FMC (pct)0.08901.40100Canopy fuel 01000.10121.72100FBFMEFFM (pct)LFM (pct)SFC (kg m–2)106801.5Surface fuel characteristics10106680801.51.5106801.5106801.5WAF (fraction)0.100.100.10Miscellaneous0.110.10Notes: SD stem density (greater than 10 cm d.b.h.), BA basal area, SH stand height, CC canopy cover,CBD canopy bulk density, CBH canopy base height, CFL canopy fuel load, FMC foliar moisturecontent, FBFM fire behavior fuel model, EFFM estimated fine dead fuel moisture, LFM live fuel moisture,SFC surface fuel consumption, and WAF wind adjustment factor.a small amount of lodgepole pine. The single-storied LP stand is located on a gentle slopeeast of Helena, Montana. A shade-tolerant understory of subalpine fir was onlybeginning to establish in this stand. The SNMC stand (composed of white fir, incensecedar, ponderosa pine, and Douglas-fir) is located at Blodgett Forest Research Station,SE of Auburn, California. This stand originated after clearcut logging around 1910, andwas treated with commercial thinning about 20 years prior to sampling. Despite theorigin and management of this stand, its canopy fuel profile is more similar to a multistoried stand than single-storied, due in part to the high productivity of the site andpresence of shade tolerant species. Scott and Reinhardt (2002, 2005) describe these fivestands and their associated canopy fuel characteristics in more detail.I also compared system outputs for the PPDF stand at various levels of residual basalarea (BA) resulting from low thinning (Scott and Reinhardt 2005). The first level,understory removal (UR), simulates removal of all trees less than 5 cm d.b.h. Subsequentlevels simulated progressive removal, from below (smallest diameter trees first), of 25,50, and 75 percent of the initial BA.Fire EnvironmentMeasured, estimated, or assumed fire environment characteristics (fuel, weather,and topography) are described below and summarized for each stand (table 1), and forthe PPDF stand across different levels of simulated canopy fuel reduction treatment(table 2).USDA Forest Service Res. Pap. RMRS-RP-58. 20063
Table 2—Stand and fuel characteristics of a ponderosa pine-Douglas-fir stand through progressive levels of basal area(BA) removal. Site and stand characteristics are from Scott and Reinhardt (2002). Canopy fuel characteristicsare from Scott and Reinhardt (2005). Surface fuel and miscellaneous characteristics are assumed orcalculated from other inputsInitialstandUnderstoryremovedSlope (pct)AspectElevation (m)6NNE10506NNE1050SD (# ha–1)BA (m2 ha–1)SH (m)CC (pct)48130.4235948130.02359CBD (kg m–3)CBH (m)CFL (kg m–2)FMC (pct)0.08901.40100FBFMEFFM (pct)LFM (pct)SFC (kg m–2)WAF (fraction)25% Basalarea removed50 % Basalarea removed75% Basalarea removedSite characteristics6NNE10506NNE10506NNE1050Stand py fuel 401000.022120.24100106801.5Surface fuel 00.100.180.22Miscellaneous0.11Notes: SD stem density (greater than 10 cm d.b.h.), BA basal area, SH stand height, CC canopy cover, CBD canopy bulkdensity, CBH canopy base height, CFL canopy fuel load, FMC foliar moisture content, FBFM fire behavior fuel model, EFFM estimated fine dead fuel moisture, LFM live fuel moisture, SFC surface fuel consumption, and WAF wind adjustment factor.Fuel—Canopy fuel characteristics for each stand were taken directly from Scott andReinhardt (2005). Canopy bulk density (CBD) was defined as the maximum 3-m verticalrunning mean bulk density of available canopy fuel, which includes the foliage,0-3 mm live branchwood, and 0-6 mm dead branchwood. CBD varies from a low of–3–30.089 kg m in the PPDF stand to 0.257 kg m in the DF stand (table 1). In the PPDF–3stand, CBD decreased to 0.022 kg m after removal of 75 percent of the initial basalarea (table 2). Canopy base height (CBH) is defined as the lowest height above the–3ground at which the canopy bulk density exceeds a threshold of 0.011 kg m . Usingthis criterion, initial CBH varies from 0 m in the PPDF stand to 5 m in the PP stand(table 1). In the PPDF stand, CBH increased to 12 m after removal of 75 percent of theinitial BA (table 2). Foliar moisture content (FMC) is assumed to be 100 percent for allspecies at all sites (Philpot and Mutch 1971). (Table 3 contains a complete list ofvariables used in this paper.)To focus the analysis on the relative behavior of the models and systems (as opposedto the stands themselves), I assumed that surface fuels in each of the stands arerepresented by fire behavior fuel model 10 (FBFM 10; Albini 1976, Anderson 1982).Further, I assumed that FBFM 10 would still represent surface fuels after each level ofcanopy fuel reduction in the PPDF stand.Fine dead surface fuel moisture (EFFM) was estimated using Rothermel’s (1983) fuelmoisture tables, assuming a late summer, mid-afternoon fire, using the same generalweather condition (temperature and humidity) for all simulations. The tables indicated4USDA Forest Service Res. Pap. RMRS-RP-58. 2006
Table 3—Complete list of max)RfinalR’aRpRsR’sR’saSSFCU10WAFcanopy bulk density (kg m–3)canopy base height (m)canopy depth (m)crown fraction burned (dimensionless)canopy fuel load (kg m –2)estimated fine (dead) fuel moisture content (percent)fire behavior fuel model (categorical)foliar moisture content (percent)fuel strata gap (m)fireline intensity (kW m–1)critical surface fireline intensity to initiate crown fire (kW m–1)rate of spread (m min–1)rate of spread of an active crown fire (m min–1)near-maximum rate of spread of an active crown fire (m min–1)final fire rate of spread, whether surface or crown (m min–1)critical crown fire rate of spread to sustain active crown fire (m min –1)passive crown fire rate of spread (m min –1)surface fire rate of spread (m min –1)critical surface fire rate of spread to initiate crown fire (m min–1)surface fire rate of spread for U10 CI (m min–1)mass flow rate (kg m –2 min –1)surface fuel consumption (kg m –2)wind speed 10 m above the surrounding vegetation (km hr –1)wind adjustment factor (dimensionless)an EFFM of 6 percent for the initial condition for all stands (table 1). In the PPDF stand,EFFM was estimated to be 3 percent after removal of 75 percent of initial basal area(table 2). Canopy cover remained unchanged after removal of the understory; thereforethe initial condition and UR treatment were given the same EFFM value of 6 percent.The two intermediate levels of treatment were assigned EFFM of 4 and 5 percent so thatEFFM decreased evenly with treatment (table 2). For use in Rothermel’s surface firespread model, 10-hr timelag moisture content was assumed to be 1 percentage point higherthan EFFM; 100-hr timelag moisture content was assumed to be 2 percentage pointshigher than EFFM (Rothermel 1983). Live surface fuel moisture content was assumedto be 80 percent, representing dry, late summer conditions.An estimate of surface fuel consumption (SFC) is required for the Cruz and others(2004) crown fire occurrence model, which classifies SFC into three categories. BecauseI do not have estimates of surface fuel load to use for estimating SFC, I simply assignedSFC to the middle category (1 – 2 kg m–2) for all stands and all levels of BA removal.Weather—I assumed an afternoon temperature of 21–32 C and relative humidity of15–19 percent for all stands and levels of BA removal. Wind speeds above and below theforest canopy are important variables in the models and systems being compared. Ratherthan assume a single wind speed for the comparisons, I computed system outputs overa range of open wind speeds (U10; wind speed measured 10 m above the forest canopy),and the U10 at which the systems predict a certain type of crown fire would occur.Mid-flame wind speed is a required input for predicting surface fire spread rate inRothermel’s (1972) model. I estimated mid-flame wind speed by multiplying U10 by awind adjustment factor (WAF), which is the ratio of open to mid-flame wind speed. WAFwas estimated using Albini and Baughman’s (1979) model for forested areas on flatground, with a lower limit of 0.10. Unconstrained, the Albini and Baughman (1979)model indicates WAF 0.09 for the DF stand and 0.08 for the SNMC stand. Their modelUSDA Forest Service Res. Pap. RMRS-RP-58. 20065
computes WAF assuming open wind speed is measured at 6.1 m rather than 10 m. U10was converted to U6.1 by dividing by 1.15 (Turner and Lawson 1978). WAF varied from0.10 to 0.11 for the initial condition of all stands (table 1), which is consistent with theRothermel (1983) guideline for dense canopies on flat ground. For the PPDF stand, WAFincreased from a minimum of 0.10 for the initial condition (table 1) to 0.22 for the mostopen treatment level (table 2). Wind direction was assumed to be upslope in all cases.Topography—Slope steepness at each site was gentle; only the DF site exceeded11 percent slope (table 1).Background: Component ModelsIt is helpful to first review the relative behavior of the component models thatcomprise each spread rate modeling system before comparing them.Crown Fire Spread RateFollowing significant crown fire events of the 1988 fire season, Rothermel (1991)constructed a simple statistical model of the behavior of sustained crown fire runs in thenorthern Rocky Mountains. The dataset consisted of eight crown fire runs on sevendocumented wildfires. Duration of crown fire runs varied from 45 minutes to severalhours. Observed average crown fire spread rate was estimated as the total distance of therun divided by its duration. In addition to this average spread rate for the run, Rothermelalso estimated the maximum crown fire spread rate observed during the run (these datawere available for only five of the eight runs). Slope steepness, open (6.1-m) wind speed,and dead and live surface fuel moistures were estimated for each run. The observedaverage crown spread rate was correlated linearly with predictions made with theRothermel (1972) surface fire spread model as adjusted by Albini (1976), using FBFM10 (Albini 1976, Anderson 1982). FBFM 10 was used for the correlation in all cases, eventhough a different FBFM might have better represented actual surface fuels. Wind speedsat 6.1 m were adjusted by a factor of 0.4 to estimate mid-flame wind speed (even thougha different wind adjustment factor might have been chosen for actual conditions) becauseit better represented “mid-flame” wind speed of an active crown fire. In Rothermel’scorrelation, average crown fire spread rate is 3.34 times faster than the predictions madewith FBFM 10 using a 0.4 wind adjustment factor.Ra 3.34 Rs(FBFM 10;WAF 0.4)(1)Where Rs(FBFM 10; WAF 0.4) is the surface fire spread rate predicted with FBFM 10 usinga 0.4 wind adjustment factor. Near-maximum spread rate is 1.7 times faster than theaverage spread rate.Ra(max) 1.7Ra(2)During crown fire runs of those durations, medium- or long-distance spotting couldhave contributed to overall fire growth and, therefore, to its estimated spread rate.However, there is no way to determine the magnitude of the spotting effect on spreadrate, if any, on any of the fires in Rothermel’s analysis. In that respect, compared tocrown fire spread rate models developed without spotting (that is, for shorter durationsor on smaller fires, such as experimental crown fires), Rothermel’s model might overpredict spread rate. On the long runs used in the correlation, which covered manythousands of acres each, canopy and surface fuels, topography, and wind speed likelyvaried considerably. The fires may have experienced lulls, periods of surface spread,or only passive crowning at times during the run, potentially leading to underprediction of fully active crown fire spread rate. Rothermel’s near-maximum spread6USDA Forest Service Res. Pap. RMRS-RP-58. 2006
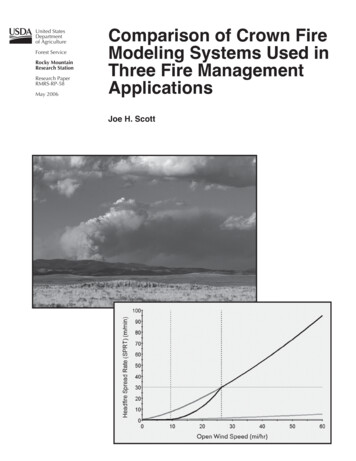
rate model, based on shorter, higher spread rate runs, would be less affected bytemporal and spatial variability in the fire environment.Rothermel’s average and near-maximum crown fire spread rate models predict littlevariation in spread rate among sites (fig. 1a). The only input that varied among sites wasslope steepness, so variation in that input accounted for all of the variation in predictedoutput. The DF stand is predicted to have slightly higher spread rate than the others dueto its steeper slope. In the PPDF stand, predicted spread rate increased as the canopy wasopened (BA removed) due to treatment (fig. 1b), because surface fuel moisture waspredicted to decrease.Using a database of 25 active crown fires, Cruz and others (2005) constructed a nonlinear regression model to predict active crown fire spread rate from U10, EFFM, andCBD. Data for the regression consisted of small-scale experimental crown fires (smallscale only in relation to the typical size of a naturally occurring crown fire) in mature andimmature jack pine (Pinus banksiana), black spruce (Picea mariana), and red pine(Pinus resinosa) plantations. A fire was considered an active crown fire if its spread ratewas at least 90 percent of that needed to maintain a mass flow rate of 3.0 kg m–2 min –1 (0.05 kg m–2 s–1) for the observed CBD (Van Wagner 1977). Predicted active crownfire spread rate isRa 11.02 !U10 0.9 ! CBD 0.19 ! e( "0.17EFFM )(3)Figure 1—Potential active crown fire rate of spread (Ra ) as predicted by three different models for a range of open wind speeds (U10)in (a) five different conifer stands, and (b) a ponderosa pine/Douglas-fir stand as basal area (BA) is removed to simulate low thinning.Complete model inputs are described in tables 1 and 2. Forest types include: PPDF ponderosa pine/Douglas-fir; PP ponderosapine; DF Douglas-fir; LP lodgepole pine; and SNMC Sierra Nevada mixed-conifer.USDA Forest Service Res. Pap. RMRS-RP-58. 20067
The Cruz and others (2005) spread rate model does not include slope as a predictivefactor; most of the fires used in the regression were on essentially flat ground ( 11 percentslope).Because EFFM was the same for the initial condition of all sites, variation in predictedactive crown fire spread rate with the Cruz and others (2005) model is due entirely tovariation in CBD; the DF stand has the highest predicted spread rates because it has thehighest CBD (fig. 1a). As the PPDF canopy was opened, EFFM and CBD both decreased.Those variables have opposing effects on spread rate in the Cruz and others (?) model,decreasing CBD leads to lower spread rate while decreasing EFFM leads to higherspread rate. Potential crown fire spread rate was predicted to increase as the canopy isprogressively opened (fig. 1b) because the effect of EFFM overpowered that of CBD.In summary, the two Rothermel (1991) models and the Cruz and others (2005) crownfire spread rate model predicted the initial condition of the DF stand would have thehighest Ra of the five sites, but for different reasons; Rothermel’s for that stand’srelatively steep slope, and Cruz and others for its relatively high CBD. There is no overlapin predictions using the three models across the stands or simulated treatments. PredictedRa is primarily determined by model choice rather than by the range of inputs for theexample stands (fig. 1). Rothermel’s near-maximum spread rate model predicts (bydesign) spread rate values 1.7 times the average. Over the range of U10 between 10 and60 km h–1, the Cruz and others model predicts crown fire spread rate between 2.5 and 5.1times the Rothermel average, and between 1.1 and 3.0 times the Rothermel nearmaximum. This variation in predicted spread rates is presumably due to differences innature of the fires used for constructing each model. Rothermel’s crown fires were longduration runs in coniferous forests of the western United States. Even the near-maximumspread rates he used were of much longer duration than the observations used by Cruzand others, and could have included periods of passive crown fire or surface fire spread.By contrast, the fires used in the Cruz and others model were much shorter durationexperimental crown fires primarily in the northern forests of Canada. The experimentalcrown fires were small compared to the usual size of a crown fire. In most cases, the lineardimensions of the experimental plots were only three to five times the flame length. Alarge free-burning crown fire might have a much different response to environmentalconditions than a small experimental crown fire.The Rothermel models do not include CBD as a predictive factor, whereas CBD hasa small, directly proportional effect on Ra in the Cruz and others model. By contrast,Grishin (1997) found that increasing CBD would lead to a decrease in Ra, due to thehigher energy requirement to heat the additional fuel. Albini’s (1996) radiation-drivencrown fire spread rate model predicts Ra inversely proportional to CBD for small CBDvalues, then directly proportional for higher values (Butler and others 2004).Crown Fire Occurrence or InitiationIn this se
CFFBPS integrates surface and crown fire spread rates into a single predictive equation that encompasses the full range of behavior, whether surface or crown. However, for fuel type C-6 (conifer plantation), separate equations are used for surface and crown fire behavior, and a transition function is used to scale between the separate predictions