Transcription
Approaches for Estimating the Supplyof Ecosystem Services: Conceptsfor Ecosystem-Based Managementin Coastal and Marine EnvironmentsFiona E. Culhane, Leonie A. Robinson, and Ana I. LillebøAbstract Ecosystem services have emerged as a critical concept for EcosystemBased Management (EBM) in aquatic environments, namely in coastal and marineenvironments. However, despite conceptual advances over the last two decades,major challenges remain in the operationalisation of ecosystem service concepts andpractical application. This chapter describes a selection of EBM assessmentapproaches applied to coastal and marine environments, where the ecosystemservices approach is key. These approaches range from qualitative to quantitative,all being transdisciplinary. In the first, (ODEMM project, supported by linkageframeworks) trade-offs in EBM management options can be considered, in termsof their potential to reduce ecological risk, maintain sustainable supply of ecosystemservices, and the governance complexity associated with implementing them. In thesecond, (AQUACROSS project, combining causality links relations and spatialmulticriteria analysis) trade-offs are supported by maps with governance boundaries,spatially explicit valuation of ecosystem services and ecological risk. In the third,(MCES project, supported by the GIS-based modelling tool InVest) trade-offs aresupported by a developed spatially explicit proxy for the habitats’ vulnerability todeliver ecosystem services. Finally, we describe a policy-based operational assessment tool that allows users to assess the current and future capacity of regional seasto supply ecosystem services, based on their current and future ecosystem statusreporting. We go on to describe some lessons learnt from our experience in applyingthese approaches.F. E. Culhane (*) · L. A. RobinsonSchool of Environmental Sciences, University of Liverpool, Liverpool, UKe-mail: F.Culhane@liverpool.ac.uk; Leonie.Robinson@liverpool.ac.ukA. I. LillebøDepartment of Biology & CESAM, Campus Universitário de Santiago, University of Aveiro,Aveiro, Portugale-mail: lillebo@ua.pt The Author(s) 2020T. G. O’Higgins et al. (eds.), Ecosystem-Based Management, Ecosystem Servicesand Aquatic Biodiversity, https://doi.org/10.1007/978-3-030-45843-0 6105
106F. E. Culhane et al.Lessons Learned For marine ecosystems, data availability is often a barrier to operationalising theecosystem service concept. Ideally, spatial data would be available and, in manycases, it is becoming so. However, assessments are needed now. We show thatthere is existing information that can be applied to ecosystem service assessmentsfor marine environments, and this should not be a barrier to carrying outassessments now. Consider all the ways that nature contributes to human wellbeing. There arecriticisms of some approaches to ecosystem service classifications and assessments, because the services cannot be clearly linked to market values andeconomic assessments. This narrows our perspective on the breadth of ecosystemservices. We show that by carrying out a supply side assessment, all the ways thatnature contributes to wellbeing can be considered. This can be seen as complementary to demand side assessments and as an end-point in itself. Economicvaluation does not need to be the only end point.Needs to Advance EBM Scientists and policy makers need to be open to draw on different approachesincluding expert judgement and stakeholder knowledge, policy information, aswell as, detailed habitat mapping or spatially explicit modelling techniques.These can then be used, together or in isolation, to show how ecosystem integritycan affect human well-being, fulfilling the critical need for balanced (economic,ecological, social) management actions to be taken.1 IntroductionThe concept of nature benefits for humans, is not new, however, it was first in 1983,almost forty years ago, that Ehrlich and Mooney used the term ‘Ecosystem Services’in an International Scientific Indexing (ISI) journal (see Flood et al. (2020) for adiscussion of earlier development of the concept). Under the title ‘Extinction,Substitution, and Ecosystem Services’ and using different biomes, authors showcased the need for a “conservative approach to the maintenance of services throughminimizing anthropogenic extinctions” (Ehrlich and Mooney 1983). Regarding themarine biome, the biggest biome in the world, and the accompanying ecosystemsservices, authors highlighted the impact of fisheries over fish stocks and the role ofeconomy as a driver for extinction and for substitution of target species. Theirrecommendations followed the need for a “careful preservation of ecosystems andthus of the populations and species that function within them”. Since then theconcept of ‘Ecosystem Services’ has evolved in order to become effectivelyoperationalised, but major challenges still remain, namely, how to decide who willwin and who will lose, as trade-offs are inherent to the decision making process. Thisis of paramount importance in the context of global socio-ecological challenges and
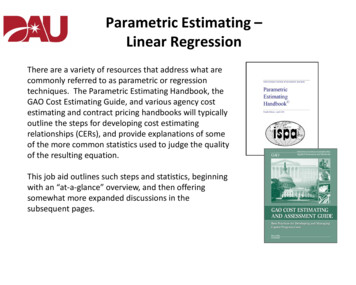
Approaches for Estimating the Supply of Ecosystem Services: Concepts for. . .107sustainable development strategies for coastal and marine environments. Suchchallenges include human indirect drivers like sea level rise, extreme weather events(e.g. floods and storm surges) and invasive species, and human direct drivers(e.g. economic activities). Global strategies tackling these challenges include thosebased around Blue Growth, Biodiversity and Climate Change. Ecosystem-BasedManagement (EBM) acknowledges that human well-being and ecological status arelinked and integrates multiple drivers and pressures into adaptive management plans(UNEP 2011). In this context, ecosystem services have emerged as a critical conceptto operationalise EBM.1.1Ecosystem Services ConceptEcosystem services have been defined in different ways over the years, with the termservices often being used interchangeably to mean “the benefits people obtain fromecosystems” (MA 2005), to the ecosystem structures, processes or functions thatgenerate the services. More recently, the ecosystem service cascade model has beenwidely adopted to clearly delineate where a service sits in relation to what generatesit (in the ecosystem), and what benefits people get from it (in the socio-economicsystem) (Potschin and Haines-Young 2011). Following the rationale of the ecosystem services ‘cascade’ model and Culhane et al. (2019a), we define ecosystemservices here as:Ecosystem services represent the flow of ecosystem capital that is realised because of ahuman active or passive demand (modified from EEA (2015)). They are thus the final outputsfrom ecosystems that are directly consumed, used (actively or passively) or enjoyed bypeople. (Fisher et al. 2009; Haines-Young and Potschin 2013; Maes et al. 2013)Examples of coastal and marine ecosystem services include nutrition from fish andshellfish, flood and coastal protection from saltmarsh habitats, and artistic inspirationfrom seascapes and marine animals (Culhane et al. 2019a, and see Fig. 1 for furtherexamples). In order to recognise all the services that ecosystems and marine environments supply, typologies of services have been developed. These categoriseservices and make their assessment operational. Early international initiatives todevelop typologies classified services under four broad categories: provisioning(such as food from fish); regulation and maintenance (such as waste regulation);supporting (such as primary production); and cultural services (such as marinespecies to observe or to research) (MA 2005; TEEB 2010). The concept of FinalGoods and Ecosystem Services (FEGS) also developed (see DeWitt et al. (2020) fora summary of this). These are a subset of ecosystem services, generally not includingthe supporting services, that can be directly linked to a beneficiary, thus avoidingdouble-counting when assigning a monetary or market value. Following these,ecosystem service typologies have been further developed and/or adapted for themarine environment (e.g. Böhnke-Henrichs et al. 2013), see Fig. 1 for some examples from this typology, which retains supporting services). CICES, the CommonInternational Classification of Ecosystem Services (Haines-Young and Potschin
Fig. 1 Examples of marine ecosystem services from the typology of Böhnke-Henrichs et al. 2013, displayed as cards developed in the ODEMM project(Robinson et al. 2014). Habitat services link to those in the TEEB classification and are included under the Supporting Services of other classifications, such asthe Millennium Ecosystem Assessment. The ODEMM ecosystem services cards are available to download for use from alyses108F. E. Culhane et al.
Approaches for Estimating the Supply of Ecosystem Services: Concepts for. . .1092013) is the reference typology for the European Union’s assessments linked to theBiodiversity Strategy (EC 2011). It is a hierarchical typology that recognises threecategories of ecosystem services: provisioning, regulation and maintenance, andcultural services at the broadest level and further subdivides these categories intomore specific services at lower levels (see Flood et al. (2020) for further discussionof ecosystem service classification systems). CICES includes only ‘final’ services,though one criticism of the typology is that some of the included services are, in fact,supporting (or intermediate). CICES was developed primarily for terrestrial environments but has been adapted for the marine environment (Culhane et al. 2019a),and should be applicable across biomes allowing a Europe wide assessment.1.2Policy BackgroundAround twenty years ago, Costanza and colleagues estimated the value of theworld’s Ecosystem Services and natural capital, showing that coastal (tidal marshand mangroves) and marine (open ocean, shelf, estuaries, seagrasses) servicesaccounted for circa 68% of the global value for ecosystem services (Costanzaet al. 1997). Just after, in the year 2000, the Millennium Ecosystem Assessmentwas called for by the United Nations Secretary-General Kofi Annan, as part of the‘The Role of the United Nations in the 21st Century’. Regarding ecosystems, theobjective was “to assess the consequences of ecosystem change for humanwell-being and to establish the scientific basis for actions needed to enhance theconservation and sustainable use of ecosystems and their contributions to humanwell-being” (MA 2005).Then ten years ago, the global initiative ‘The Economics of Ecosystems andBiodiversity (TEEB)’ focused on ‘making nature’s values visible’ in order to mainstream the values of biodiversity and Ecosystem Services into decision-making at alllevels (TEEB 2010). Within TEEB special attention is given to ‘blue growth’ andhuman dependence on healthy ocean ecosystems and on coastal and marine biodiversity. About the same time, the European Union (EU) Biodiversity Strategy for2020 aimed to halt the loss of biodiversity and Ecosystem Services, reflecting thecommitments taken in 2010 within the International Convention on BiologicalDiversity. As part of the strategy, working groups for mapping and assessment ofecosystem services, including a marine pilot, provided supporting guidance for EUmember states (Maes et al. 2016). Just after, in 2012, an independent intergovernmental body of the United Nations ‘The Intergovernmental Science-Policy Platformon Biodiversity and Ecosystem Services (IPBES)’ was established “to strengthenknowledge foundations for better policy through science, for the conservation andsustainable use of biodiversity, long-term human well-being and sustainable development”. This platform stands for nature and biodiversity, in the same way that the‘Intergovernmental Panel on Climate Change (IPCC)’ provides the latest sciencebased assessments related to climate change, including possible response options.
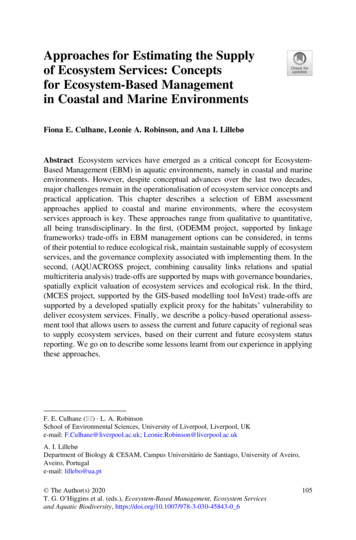
110F. E. Culhane et al.In the last five years, different but complementary initiatives have taken placeacknowledging the need for global actions towards unprecedented changes in nature,climate and human population growth. In 2015, the United Nations, together withgovernments, businesses and civil society, agreed on the Sustainable DevelopmentAgenda for 2030 that integrates seventeen interlinked Sustainable DevelopmentGoals (SDG’s). Although, SDGs should not be addressed individually, SDG 14 isdevoted to ‘Conserve and sustainably use the oceans, seas and marine resources forsustainable development’. In the same year the ‘Paris Agreement on climate change’entered into force, being essential for the achievement of the SDGs. The formerinitiatives, TEEB, IPBES, as well as the EU Strategy for biodiversity beyond 2020are also framed in the scope of the SDGs.In this context, Ecosystem-Based Management (EBM), a holistic approach thataims to balance the multiple interrelated dimensions of ecological integrity andhuman well-being, appears a useful framework to operationalise the concept ofecosystem services (Gómez et al. 2016, 2017). Likewise, one can argue that achieving EBM might be more attainable where the ecosystem services approach isincluded, since it enables stakeholders and decision makers to see a tangible wayin which the integrity of ecosystems directly (actively or passively) affects the wellbeing of humans. To this end this chapter aims at showcasing selected EBMassessment approaches applied to coastal and marine environments that incorporateunderstanding and assessment of ecosystem services and to draw lessons learnt fromour experience.2 Operationalising Ecosystem Services in EBM2.1Ecosystem Services and Trade-Offs in EBM ManagementOptionsDifferent decision support tools can support trade-off options regarding the provisioning of ecosystem services. These can be supported by linkage frameworks (e.g.,see Robinson and Culhane 2020), by causality links relations (e.g., AquaLinksTool,Nogueira 2018), by spatially-explicit GIS-based modelling tools (e.g., Willaert et al.2019) or by a combination of the above mentioned decision support tools (e.g., seeLillebø et al. 2020). Three selected examples are now presented.2.1.1ODEMM Project: https://www.odemm.comIn the ODEMM project a typology of marine ecosystem services was developed(Böhnke-Henrichs et al. 2013) and an assessment undertaken whereby stakeholderscompared management options based on three major criteria: ecological risk, ecosystem service supply and governance complexity (Robinson et al. 2014: Chap. 7).
Approaches for Estimating the Supply of Ecosystem Services: Concepts for. . .111As illustrated in Fig. 2, management options could be applied to reduce impactsthrough a number of different pathways, and the reduction in risk to ecologicalcomponents was considered in terms of any resultant change in the supply ofecosystem services (a framework that aligns with the DPSIR, and later DAPSI(W)R(M) concepts, see Elliott and O’Higgins (2020)). This was considered against thecomplexity of governance required to implement the compared managementoptions, and the effect of ecological risk reduction on potential achievement ofecological goals as set out by the Marine Strategy Framework Directive.It was not always the case that management options delivered benefits in terms ofall three criteria considered in the same way (Fig. 3). In terms of the examplesexplored, stakeholders generally found that the management option that deliveredthe best reduction in risk to achievement of the MSFD good environmental statusobjectives, was also least complex in terms of governance required to instigate it, butwas not the most promising in terms of the benefits to sustainable supply of services.This helps to illustrate the trade-offs experienced in EBM. Participants involved inthe ODEMM trade off exercises found the approach to be very useful in terms ofhelping to visualise “how the sea works”, providing a “practical approach to linkmanagement options with potential changes in the provision of ecosystem services”(ODEMM Deliverable 19).2.1.2AQUACROSS Project: https://aquacross.euThe EBM approach (see Piet et al. 2020) was applied to the Vouga river coastalwatershed, along a continuum of freshwater to marine habitats under the classification of the Natura 2000 network (Lillebø et al. 2018). This case study also aimed toshowcase causality links in a linkage chain relating activities, pressures and habitats/highly mobile biotic groups and ecosystem services (Teixeira et al. 2018, 2019;Culhane et al. 2019b) and to assess the vulnerability of ecosystem componentsregarding the provisioning of ecosystem services (Lillebø et al. 2018).In this social-ecological system and as part of the EBM framework, stakeholderswere invited to value ecosystem services through a spatial multi-criteria analysis thattook place at two different spatial scales (Lillebø et al. 2019; Martínez-López et al.2019). From the resulting prioritization maps representing stakeholder’s perceptionsand beliefs regarding ecosystem services, valuations were generated and supportedthe discussion of the areas for potential interventions (ecosystems restoration) andassociated trade-offs. As part of the EBM trans-disciplinary approach, stakeholderswere also invited to express their concerns regarding the foreseen managementoptions. Simultaneously, causality links and risk assessment were undertakenthough a tool that establishes a linkage chain relating activities, pressures andhabitats/highly mobile biotic groups and ecosystem services, to assess the vulnerability of ecosystem components regarding the provisioning of ecosystem services(AquaLinksTool, Nogueira (2018)) as shown in Fig. 4. The full linkage matricesdataset is freely available for download https://zenodo.org/record/1101159#.XbKsfS3MyqA.
3bAbrasion, Smothering, MarineLitter, Nutrient Enrichment,Extraction of Species etc.Fishing, Aquaculture,Shipping, Energy,Tourism,Coastal Infrastructure etc.GES14b5a5bBiodiversity, Foodwebs,Seafloor Integrity etc24cManagement ne Mammals,Nutrients & Oxygen,Fish, Plankton etc.Sea Food, Waste Treatment,Raw Material, ClimateRegulation, Recreation etc.Fig. 2 The ODEMM Cost and Benefits analyses consider how the appraisal of management options can take into consideration both associated costs andbenefits (where benefits are described by the supply of ecosystem services). Here, the supply of ecosystem services can be altered when management options areinstigated (4 a–c), either though controls on sectors that supply key ecosystem services (5a) (e.g. instigating catch control on fisheries can alter supply of Seafooddirectly), or though the alteration in state of ecological components that contribute to the supply of ESs (5b). [State of ecological components may change due tomanagement options acting directly on ecological components (4c) or acting on pressures (4b) and/or sectors (4a) that impact ecological components (2)]. Costsassociated with management options may arise at both the level of the sector and/or at institutes involved in the governance of those management options. (FromRobinson et al. rsGovernance112F. E. Culhane et al.
Approaches for Estimating the Supply of Ecosystem Services: Concepts for. . .113Fig. 3 A final outcometable following completionof all three exercises, wherenumbers represent the orderin which the ManagementOptions (MO A, B, C) workbest, in terms of outcomesfor the different criteriaconsideredThe vulnerable habitats selected through the AquaLinksTool clearly matchedstakeholders’ concerns, as well as their ecosystem services prioritization maps(Lillebø et al. 2019; Martínez-López et al. 2019). The combined approach contributed to the effectiveness (hitting the environmental target), the efficiency (makingthe most for human wellbeing), and to equity and fairness (sharing the benefits) ofthe proposed EBM responses. Lillebø et al. (2020) detail the co-developmentprocess of an EBM plan foreseen to mitigate unintended impacts on biodiversityin Vouga estuary and to its end support the development of the Vouga estuarymanagement plan.2.1.3MCES ProjectIn the MCES project, a vulnerability index of the potential of marine and coastalhabitats to deliver ecosystem services was developed. This is an example of anapproach to implement ecosystem service assessments in EBM using spatiallyexplicit modelling tools, i.e., by generating maps, GIS-based models enable decisionmakers to assess quantified trade-offs associated with alternative managementoptions and to identify areas where these can take place. Relevant examples ofopen source models are ARIES—Artificial Intelligence for Ecosystem Services,already applied for machine learning for ecosystem services (Willcock et al.2018); MARXAN with Zones enabling to ‘develop multiple-use zoning plans fornatural resource management’ (Watts et al. 2009; Jumin et al. 2018) and InVest—Integrated Valuation of Ecosystem Services and Trade-offs, already used for calculating vulnerability of marine habitats to deliver ecosystem services (Willaert et al.2019; Cabral et al. 2015). For detailed consideration of EBM modelling tools seeFulford et al. (2020) and Lewis et al. (2020).
114F. E. Culhane et al.Fig. 4 Vulnerability (ES ) of the Vouga river coastal watershed habitats under classification ofNatura 2000 network to provide ecosystem services defined with AquaLinksTool. (Image source:Adapted from Lillebø et al. (2018), plotted with Mauri et al. (2017)). EUNIS habitats codes: A5.23Infralittoral fine sand; A5.25 Circalittoral fine sand; A2.22 Barren or amphipod-dominated mobilesand shores; A5.23 Infralittoral fine sand; A5.24 Infralittoral muddy sand; A5.25 Circalittoral finesand; A5.43 Infralittoral mixed sediments; B1.3 Shifting coastal dunes; B1.4 Coastal stable dunegrassland (grey dunes); B1.6 Coastal dune scrub; B1.8 Moist and wet dune slacks; A2.2 Littoralsand and muddy sand; A2.3 Littoral mud; A2.5 Coastal saltmarshes and saline reedbeds; A2.535Juncus maritimus mid-upper saltmarshes; A2.53C Marine saline beds of Phragmites australis;A2.554 Flat-leaved Spartina swards; A2.61 Seagrass beds on littoral sediments; A5 Sublittoralsediment; A7 Pelagic water column; J5.11 Saline and brackish industrial lagoons and canals; J5.12Saltworks; C1 Surface standing waters; C1.3 Permanent eutrophic lakes ponds and pools; C3.21Common reed (Phragmites) beds; C3.22 Common clubrush (Scirpus) beds; C2.3 Permanentnon-tidal smooth flowing watercourses; G1 Broadleaved deciduous woodland; G1.1 Riparian andgallery woodland (Alnus Betula Populus or Salix); G1.21 Riverine Fraxinus—Alnus woodland;G1.22 Mixed Quercus—Ulmus—Fraxinus woodland of great rivers; G1.31 Mediterranean riparianPopulus forests)
Approaches for Estimating the Supply of Ecosystem Services: Concepts for. . .115Fig. 5 Schematic representation of the workflow to assess the vulnerability of marine and coastalhabitats’ potential to deliver ecosystem services. (Image source: Willaert et al. 2019. Note:MSFD—Marine Strategy Framework Directive; HRA—InVEST Habitat Risk Assessment tool;ES—Ecosystem Services; EUNIS—habitat classification system)The MCES project example showcases a vulnerability-based approach to captureEcosystem Services in EBM. To this end, the considered approach combined theInVEST habitat risk assessment tool with the identified ecosystem services to createa proxy for the habitats’ vulnerability to deliver ecosystem services in support ofcoastal and marine EBM. Figure 5 illustrates the framework combining the supplyand demand for coastal and marine ecosystem services followed by Willaert et al.(2019). The case study was the western-Atlantic coast of Portugal that included theNazaré Canyon ( 3000 m depth within the study region), Óbidos Lagoon (transitional waters), São Martinho do Porto bay (marine inlet), and Berlengas Archipelago(UNESCO world biosphere reserve).As concluded by Willaert et al. (2019) “The mapping of benthic habitats hasopened new avenues, contributing to improve not only marine spatial plans, but alsothe EBM approach by facilitating the combination of spatial explicit GIS tools withsupply and demand of marine ES, human activities and their related impacts, as wellas with other natural impacts (e.g. climate change) to forecast scenarios (includingmarine ES trade-offs) and to open the floor to discussion (namely in stakeholdersparticipatory processes) and to sustainable decision making processes in a ‘BlueGrowth’ context by maximizing the net benefits provided by marine environmentsover time”.The diversity of habitats in the selected area, the proposed approach to capturevulnerability, and the generated maps (EBM base line and EBM managementoptions prospective scenarios) showcase maritime spatial planning and ‘BlueGrowth’ in the context of the SDGs for 2030.
116F. E. Culhane et al.3 A Policy-Based Regional Seas Assessment of the Capacityto Supply Ecosystem ServicesIn this section we describe an assessment approach (MECSA: Marine ecosystemcapacity for service supply assessment) developed with the European EnvironmentAgency that utilises policy-reported ecosystem status information (from the MarineStrategy Framework Directive and other relevant reporting) to assess current andfuture capacity to supply ecosystem services (Culhane et al. 2020; Culhane et al2019a). The key steps and the types of output that can be generated are summarised.3.1Using Ecosystem State Information in Ecosystem ServiceAssessmentsThe state of the ecosystem can tell us something about the capacity of the ecosystemto supply services, and this is the underlying assumption of this assessmentapproach. Across multiple services it can be assumed that good ecosystem stateunderpins good capacity for service supply, since the ecosystem service supply relieson the integrity of the ecosystem (Burkhard et al. 2012; Culhane et al. 2019b).However, at an individual service level, this is not necessarily the case, and wecannot assume that good ecosystem state will necessarily equate to good ecosystemservices supply. Thus, the second underlying assumption of this assessment is thatwe understand something about the ecosystem state-service supply relationship, andwe can use this to interpret state information in relation to what it means for thesupply of services (Box 1).Box 1 Understanding the State-Service RelationshipDifferent services will have different types of relationship with the state of theparts of the ecosystem that supplies them.Examples: Flood protection capacity is better in the presence of a greater area ofsaltmarsh habitat (King and Lester 1995). Heavily-grazed seagrass beds, even though in worse state than ungrazedareas, still support up to three times more coastal protection through theirroot system that unvegetated areas (Christianen et al. 2013). Macroalgae habitat quality is more important than habitat area for servicesupply e.g. for maintaining fish habitat (van Lier et al. 2018).It is important to understand this relationship in order to use state information to truly represent the capacity of the ecosystem to supply services.Different services rely on different aspects of the ecosystem. These need tobe identified.
Approaches for Estimating the Supply of Ecosystem Services: Concepts for. . .3.2117Steps to Implementing the MethodThis approach entails three main steps, all set in the context of understanding thestate-service relationship (Box 1). Firstly, the parts of the ecosystem that supply the service being assessed areidentified. We described an approach to identify service providing units (SPUs)(see linkage framework chapter and Culhane et al. 2018). The relative contribution of these SPUs can be determined, and only the critical ones of these takenforward for a full assessment. The second step involves determining the relative contribution of SPUs to theservice supply and identifying which are critical. In the third step, the specific state service relationship for the critical SPUs isdescribed and the most appropriate indicators of these identified. State information is then used to fulfil these indicators, though in practice, this is oftendetermined by what is available rather than what is most appropriate. This isinterpreted in relation to ecosystem service supply capacity, using understandingof the state-service relationship.3.3Example Case Study: North East AtlanticThe three steps of the method are illustrated through an example of a culturalecosystem service—recreation and leisure from whale watching in the North EastAtlantic.As well as whale watching occurring from the shore and other non-commercialroutes, it is a growing enterprise in many regions (e.g. Elejabeitia et al. 2012; IUCNACCOBAMS 2016), often representing important economic benefits to rural communities (Ryan et al. 2018). In the North East Atlantic, commercial whale watchingtours operate around the shores of Ireland, Scotland, England, Portugal and NorthernSpain. In the first step of identifying the SPUs, we define these for this service as thewhales that are watched by people, and the habitats that support those whalepopulations. Since whales are highly mobile and may make use of many habitats,we focus here on the whales themselves, as their populations are likely to reflect thecondition of their habitats. We identified the relevant SPUs by checking whale touroperator websites and the species advertised as being seen on tours (Table 1).To identify the critical SPUs for step two, we consider whether some species aremore important than others. We find that, while common species are more reliablyseen, rare species may constitute a special and equally important experience. Thus,in this case, we take all species forward as being critical. We define the state-servicerelationship as being that a greater whale population will result in a greater likelihood of seei
generate the services. More recently, the ecosystem service cascade model has been widely adopted to clearly delineate where a service sits in relation to what generates it (in the ecosystem), and what benefits people get from it (in the socio-economic system) (Potschin and Haines-Young 2011). Following the rationale of the ecosys-