Transcription
THE COX AUTOMOTIVE2018 SERVICEINDUSTRY STUDYCONSUM ER SERVICEEXPERIENCER E S E A R CHP R E S E N T AT I O N
About the Study WE INTERVIEWED3,550consumers that had atleast 1 service visit inthe past 12 months404employees of franchise dealerswho have input into decisionson service operations
POSITIVE NEWS,NEGATIVE NEWSDEALERS LEAD IN SHAREOF SERVICE VISITS ANDTHEIR LEAD IS GROWINGHOWEVER DEALERS STILL ONLY CAPTURE1 IN 3 SERVICE VISITS3
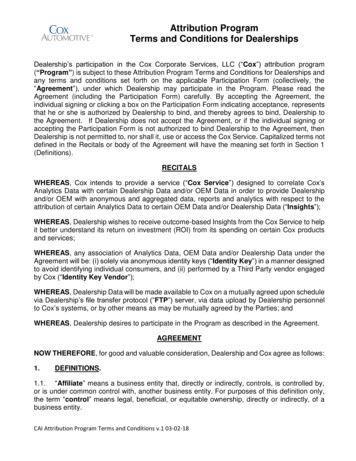
Dealership Usage Declines as Vehicles AgeSHARE OF SERVICE VISITS BY VEHICLE AGE(AMONG THOSE WHO PURCHASED FROM A DEALERSHIP)Body ShopSpecialist4%Retail5%5%8%Tire StoreQuick Lube7%6%Body Shop OtherSpecialistRetail3% 1%DealershipsTire Store 2Year OldVehiclesQuick LubeBody Shop OtherSpecialistDealerships4%5%RetailDealerships3% 2%7%29%9%2-5Year OldVehicles11%62%Tire Store 5Year OldVehicles14%56%8%GeneralRepair/ServiceStation% Under Warranty13%11%91%27%Quick iceStation8%60%Source: 2018 Cox Automotive Service Industry Study4
Dealers Struggle with Retention70%of consumers who purchased or leased from adealer did not return for service in the past yearSource: 2018 Cox Automotive Service Industry Study5
Lack of Retention Costs Franchise Dealers 266Bannual lost revenueacross all franchise dealers 1 15.9Mannual lost revenueper franchise dealer21estimate based on revenue calculations from2NADA Data 2017: Annual Report and the 2018 Cox Automotive Service Industry Study.Based on an estimated 16,800 franchise dealers in the United States6
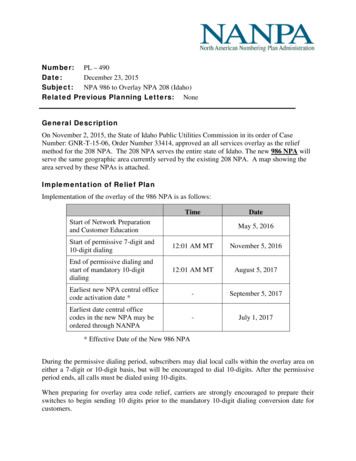
Fixed Ops is Critical to RetainingCustomers for Future Vehicle SalesLIKELY TO RETURN TO DEALER OF PURCHASE FOR NEXT VEHICLE74%of those whoRETURNEDfor service within thepast 12 monthsVS35%of those whoDID NOT return forservice within thepast 12 monthsSource: 2018 Cox Automotive Service Industry Study7
Cost and Location Being the Top Barriers to RetentionTOP REASONSTO NOT USEDEALER OF PURCHASEFOR SERVICETotal cost is NOT reasonableNOT a convenient locationThey will overcharge meUnreasonable labor chargesUnreasonable parts chargesSource: 2018 Cox Automotive Service Industry Study8
Enhanced Service Experience Can Overcome BarriersIF THE PROVIDER OFFERED ANY ENHANCEMENTSENHANCEMENTS:Request servicevisit add-ons aringservices providedValet serviceGuaranteedloaner vehicleMinimal-clickscheduling viamobile deviceVideo or pictures ofrecommendedserviceOnline bill payIn-lane bill payvia mobile device60%of consumers are more willing totravel further for service54%of consumers are willingto pay more for serviceSource: Cox Automotive Consumer Community, 20189
Dealers Agree that the Service Experience isa Critical Focus Now and in the Future97%NOW of dealers agree that thecustomer's experience in theservice department is veryimportant to their dealership96%FUTURE of dealers agree that improvingthe customer's experience in theservice department is animportant focus moving forwardSource: 2018 Cox Automotive Service Industry Study10
Dealers Think They Have Already Made Progress71%of dealers think their serviceexperience has improvedTOP REASONS WHYBetter staffImproved customer serviceBetter employee trainingSource: 2018 Cox Automotive Service Industry Study11
Dealership Experience Remains atParity with General Repair% OF CONSUMERS WHO AREVERY SATISFIED & EXTREMELY LOYAL(AM ONG THOSE WHO VISITED EACH ershipWherePurchasedVery dissatisfied,SpecialistI’ll nevergoTireback eSource: 2018 Cox Automotive Service Industry Study12
Consumer Satisfaction and LoyaltyHave Dropped Across All Providers% OF CONSUMERS WHO AREVERY SATISFIED & EXTREMELY LOYAL(AM ONG THOSE WHO VISITED EACH 60%62%3.7GeneralRepairDealershipWherePurchasedVery dissatisfied,SpecialI’ll op59%RetailAutoServiceSource: 2018 Cox Automotive Service Industry Study13
Millennials Are the Most Dissatisfied with the Current Experience% OF CONSUMERS WHO ARE DISSATISFIED& PROBABLY NOT RETURNING25%(ACROSS ALL PROVIDERS)of millennials14% 8%of gen xof baby boomersSource: 2018 Cox Automotive Service Industry Study14
Service Needs Hierarchy: Consumers Ultimately Want EaseUNDERLYINGMOTIVATIONSPeace of UST HAVEBENEFITSSaves timeSaves moneySaves effortSource: KBB Ownership Study15
5 Key Service Opportunities Based on Consumer NeedsENABLE EASE OF MAINTENANCEPROVIDE PRICE TRANSPARENCYUPGRADE OFFLINE SERVICES TOONLINE FEATURESCLOSE THE DISTANCE GAPSERVICE VALUATION ANALYSISSource: 2018 Cox Automotive Service Industry Study16
EASE OFMAINTENANCE17
Maintenance is First to Mind WhenConsumers Think of OwnershipVery dissatisfied,I’ll never go backSource: KBB Ownership Study18
Consumers Less Proactive With Maintenance as Their Vehicle Ages53%of consumers who purchased their vehicle NEW always get theirvehicle serviced according to manufacturer guidelines75% 2 year old vehicles64%2-5 year old vehicles43% 5 year old vehiclesSource: 2018 Cox Automotive Service Industry Study19
Most Vehicles Visited a Provider in 2018 for Maintenance at Least Once% OF VISITS THAT INCLUDED 82%Maintenance85%Repair36%Enhancement7%of registered vehicles wereserviced in the past 12 monthsby a third partySource: 2018 Cox Automotive Service Industry Study20
Dealers Improve Lead in Maintenance VisitsBut Still More Room to GrowSHARE OF VISITS BY TYPE OF SERVICEMaintenance526 MM2015Repair223 MM2015Dealerships179 MM34% General Repair121 MM23%Quick Lube68 MM13% Tire Store68 MM13%Retail37 MM7%Specialist26 MM5%Body Shop16 MM3%Other11 MM2%(31%)(23%)(16%)(12%)(7%)(4%)(3%)(4%)General Repair67 MM30% Quick Lube18 MM8%Specialist16 MM7%Body Shop13 MM6%Other2 MM1%(33%)(7%)(6%)(7%)(5%)Dealerships67 MM30% (27%)Tire Store24 MM11%(10%)Retail16 MM7%(5%) Indicates a significant difference from previous time period at the 95% confidence level( ) 2015Source: 2018 Cox Automotive Service Industry Study21
Consumers Visit Dealers for Maintenance Becauseof Their Connection to the Customer and VehicleTOP REASONS CONSUMERS PREFER PROVIDER FOR MAINTENANCEDEALERSHIPGENERAL REPAIRThey know my vehicleCost / PricePrior experiencePrior experienceThey know meConvenient locationSource: 2018 Cox Automotive Service Industry Study22
Many Consumers Want the Dealer Website to beTheir Primary Touchpoint for Maintenance67%of consumers want to track servicehistory via the dealer website18% of dealers have featureDEALER WEBSITE FEATURESCONSUMERS FEEL ARE IMPORTANTTO IMPROVE THEIR EXPERIENCE62%of consumers want to view OEMmaintenance recommendationsvia the dealer website50% of dealers have feature61%of consumers wantrecall updates & serviceremindersvia the dealer website18% of dealers have featureSource: 2018 Cox Automotive Service Industry Study23
2 in 5 Consumers Want an Ongoing, Remote Connection to the Dealer% OF CONSUMERS INTERESTED41%remote monitoring of vehicle health &predicting part replacement13% of dealers currently offer21% of dealers considering itSource: 2018 Cox Automotive Service Industry Study24
PROVIDE PRICETRANSPARENCY25
The Internet is Becoming a Resource forInformation on Service35% OF CONSUMERS USED THE INTERNETFOR A SERVICE RELATED ACTIVITY57%52%33%25%Gen ZMillennialsGen XVery dissatisfied,I’ll never go backBoomersSource: 2018 Cox Automotive Service Industry Study26
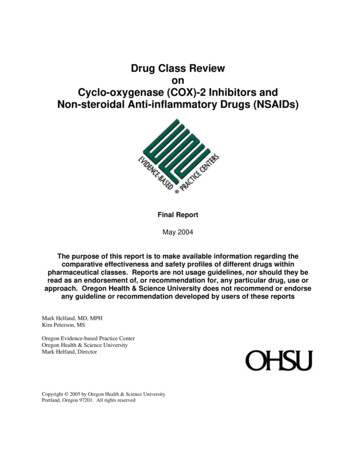
Pricing Research Top Online Activity Across All GenerationsTOP 5 ONLINEACTIVITIESBY GENERATIONGEN ZGEN X1.2.3.4.5.1.2.3.4.5.Research a specific problemFind approximate price rangesFind a telephone numberCompare prices of multiple companiesFind hours of operationResearch a specific problemSchedule an appointmentFind hours of operationFind couponsFind approximate price ch a specific problemFind hours of operationFind a telephone numberFind approximate price rangesFind how-to videosResearch a specific problemSchedule an appointmentFind hours of operationFind a telephone numberFind approximate price rangesSource: 2018 Cox Automotive Service Industry Study27
Value Surpasses Quality as Most ImportantWhen Selecting ProvidersWHAT’S MOST IMPORTANT WHEN CONSIDERING SERVICE PROVIDERS?20152018QualityValueValueQualityTOP VALUEATTRIBUTES:They won’tovercharge meTrustConvenienceConvenienceTrustTotal cost isreasonableProvides totalcost upfrontSource: 2018 Cox Automotive Service Industry Study28
Price Transparency is a TopConsumer Frustration#1Service took longer than expected#2Tried to push additional services#3Had an appointment but waited in line#4Finding out how much they charge#5Verydissatisfied,Did not providea loanervehicleI’ll never go backSource: 2018 Cox Automotive Service Industry Study29
Consumers Want Price Transparency Earlier in the ExperienceCONSUMER INTEREST INWEBSITE FEATURE OR CONCEPT70%41%of consumers want to view priceranges for various servicesvia dealer siteof consumers want a websitecomparing prices for nearbyservice departments43% of dealers have feature17% of dealers currently offerSource: 2018 Cox Automotive Service Industry Study30
A Dealer Can Create a Competitive AdvantageBy Providing Price Transparency55%of consumers would chose onedealership for service overanother if it provided onlineestimates of service costsSource: 2018 Cox Automotive Future of Digital Retail Study31
UPGRADE OFFLINESERVICES TOONLINE FEATURES32
Consumers Feel Moving Steps Online Will Improve Experience –Especially Online SchedulingCONSUMER INTEREST IN WEBSITE FEATURE OR Estimates41%ProgressTracker54%Source: 2018 Cox Automotive Service Industry StudyOnlineBill Pay31%33
Online Experiences Are Particularly Appealing to Younger Generations% OF GEN Z / MILLENNIALS INTERESTED INWEBSITE FEATURE OR CONCEPTOnlineSchedulingGEN erOnlineBill urce: 2018 Cox Automotive Service Industry Study34
2 in 5 Gen Z / Millennials Find Mobile Features AppealingGEN Z / MILLENNIAL INTEREST INMOBILE FEATURES45%43%39%Minimal-click schedulingvia mobile deviceReceiving picturesor videos ofrecommended servicesIn-lane bill payvia mobile deviceSource: 2018 Cox Automotive Service Industry Study35
A Dealer Can Create a Competitive AdvantageBy Simply Moving Scheduling Online56%of consumers would chose onedealership for service overanother if it allowed them toschedule a serviceappointment onlineSource: 2018 Cox Automotive Future of Digital Retail Study36
Scheduling Remains Primarily an Offline ActivityDue to Continued Low AwarenessONLINE91%of dealers have a schedulingfeature on their website21%of dealership servicevisits that were scheduledvia the dealer websiteAMONG THOSE WHO DONOT SCHEDULE ONLINE35%are aware their service provideroffers online schedulingSource: 2018 Cox Automotive Service Industry Study37
2 in 5 Consumers Want the Dealer to Havea More Proactive Role in Scheduling Services% OF CONSUMERS INTERESTED38%availability alertsfrom dealership21% of dealers currently offerSource: 2018 Cox Automotive Service Industry Study38
Time Spent at the Dealership is the TopConsumer Frustration#1Service took longer than expected#2Tried to push additional services#3Had an appointment but waited in line#4Finding out how much they charge#5Verydissatisfied,Did not providea loanervehicleI’ll never go backSource: 2018 Cox Automotive Service Industry Study39
Consumers Who Are Most Satisfied Spend2.5 Hours or Less at the Dealer for ServiceCONSUMER TIME SPENT (HOURS)Very satisfied,I’ll always go to themSomewhat satisfied,I might use in the futureVery dissatisfied,I’ll never go back2.43.03.7Very dissatisfied,I’ll never go backSource: 2018 Cox Automotive Service Industry Study40
CLOSE THEDISTANCE GAP41
The “Dealer Of Purchase” Tends to be Farther AwayThan Where Consumers Are Willing to Travel for ServiceDISTANCE TRAVELED BY 0%28%95%of dealers haveservice facility on thesame lot as dealership11%0%Less than 5 miles5 to 10 miles11 miles or moreDistance Traveled To Dealership Where PurchasedDistance Traveled For ServiceSource: 2018 Cox Automotive Service Industry Study42
Location Moving up as a Top Reason toNot Return to "Dealer of Purchase"TOP REASONS TO NOT USE DEALER OF PURCHASE FOR SERVICE20152018Total cost is NOT reasonableTotal cost is NOT reasonableThey will overcharge meNOT a convenient locationUnreasonable labor chargesThey will overcharge meUnreasonable parts chargesUnreasonable labor chargesNOT a convenient locationUnreasonable parts chargesSource: 2018 Cox Automotive Service Industry Study43
2 in 5 Consumers Interested inService Mobility Concepts% OF CONSUMERS INTERESTED36%39%valet servicemobile serviceproviders28% of dealers currently offer6% of dealers currently offer14% of dealers considering itSource: 2018 Cox Automotive Service Industry Study44
Gen Z & Millennials Are Leading the Wayin Interest for Service Mobility ConceptsGEN Z / MILLENNIAL INTEREST45%50%valetserviceversus 36% totalmobile serviceprovidersversus 39% totalSource: 2018 Cox Automotive Service Industry Study45
SERVICEVALUATIONANALYSIS46
Negative Equity Hits All-Time High in 2018The amount of money consumers are financing fora vehicle continues to riseHigher loan amounts and rising interest ratesoutpace the ability for longer loan terms tomaintain lower monthly paymentsLonger loan terms continue todominate the marketVery dissatisfied,I’ll never go back32%of trade-ins by new vehiclebuyers had negative equitySource: Experian; Automotive News47
2 in 5 Consumers Want to Understand the RelationshipBetween Services Needed and Vehicle Value% OF CONSUMERS WHO FEEL THISWEBSITE FEATURE IS IMPORTANTTO IMPROVE THEIR EXPERIENCE44%estimate impact ofservice on vehicle valuevia dealer site7% of dealers have featureSource: 2018 Cox Automotive Service Industry Study48
1 in 3 Consumers Are Interested In Gettinga Trade-In Value During the Service Experience32%of consumers are interestedin getting a trade-in valuefrom their service providerduring a service visit44%of millennials14%of consumers say a serviceprovider has shared thetrade-in value of their vehiclewith them during a service visit24%of millennialsDealers say 23% of trade-in value discussions leadto a follow-up discussion or completion of a trade-inSource: 2018 Cox Automotive Service Industry Study49
Gen Z & Millennials Are the Most Opento the Dealer Proactively Advising on Vehicle EquityGEN Z / MILLENNIAL INTEREST58%Estimate impact ofservice on vehiclevalue via dealer siteversus 44% total41%Dealer helps get bestreturn, advisingwhen to trade-inversus 28% totalSource: 2018 Cox Automotive Service Industry Study50
Recap ofKey Findings &Client Implications51
Key FindingsRetention continues to be a challenge, but providing anenhanced experience can improve loyalty.Dealers have increased investments in theservice experience, but consumer satisfactionremains at parity with general repair shops.The time is now to build improvedexperiences for future owners. Millennialsare the most dissatisfied with the experience.Consumers are motivated by anexperience that is ultra-convenientand stress free.52
5 Key Service Opportunities & Client ImplicationsENABLE EASE OF MAINTENANCEProvide proactive alerts & easy access to historyPROVIDE PRICE TRANSPARENCYEnable pricing research onlineUPGRADE OFFLINE SERVICES TO ONLINE FEATURESOffer online tools for critical steps of the experienceCLOSE THE DISTANCE GAPOffer pick-up/drop-off services & mobile service unitsSERVICE VALUATION ANALYSISCommunicate impact of services on vehicle valueSource: 2018 Cox Automotive Service Industry Study53
THE COX AUTOMOTIVE2018 SERVICEINDUSTRY STUDYCONSUM ER SERVICEEXPERIENCER E S E A R CHP R E S E N T AT I O N
Source: 2018 Cox Automotive Service Industry Study 27 GEN Z 1. Research a specific problem 2.Find approximate price ranges 3.Find a telephone number 4. Compare prices of multiple companies 5. Find hours of operation MILLENNIALS 1.Research a specific problem 2. Find hours of operation 3. Find a telephone number 4. Find approximate price ranges 5 .