Transcription
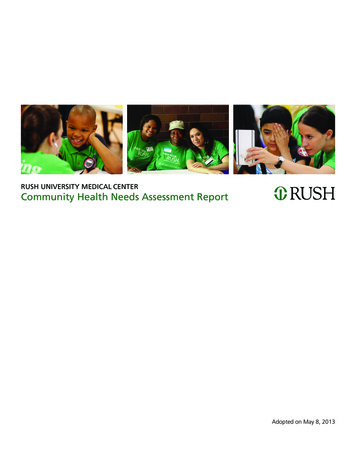
RUSH UNIVERSITY MEDICAL CENTERCommunity Health Needs Assessment ReportAdopted on May 8, 2013
AcknowledgementsRush University Medical Center would like to extend aspecial thank you to everyone who participated in theCommunity Health Needs Assessment process. The insightand collaboration of many people allowed Rush to developa comprehensive understanding of the community andits health needs and prepare for a productive communityoutreach planning effort. Specifically, we would like tothank the following individuals:Interview ParticipantsWalter BurnettAlderman 27th Ward, ChicagoReverend Marshall Elijah Hatch Sr.Pastor, New Mount Pilgrim Missionary Baptist ChurchReverend George HendersonPastor, Greater Garfield Park Missionary Baptist ChurchArt Jones, MDChief Medical Officer, Medical Home NetworkRoderick Jones, MPHDirector of Epidemiology, Chicago Department of Public HealthSally Lemke, MS, RN, WHNP-BCRush Clinic at Simpson AcademyJosé E. LopezExecutive Director, Puerto Rican Cultural CenterCheryl LuliasPresident and Executive Director, Medical Home NetworkReverend Johnny Lee MillerPastor, New Mount Pilgrim Missionary Baptist ChurchCrystal PalmerCAC Liaison, Chicago Housing AuthorityChristopher ProvenzanoExecutive Director, University Village AssociationReverend Charles RobinsonPastor, Holy Starlight Missionary Baptist ChurchErica Salem, MPHDeputy Commissioner, Chicago Department of Public HealthAndrew Teitelman, LCSWCynthia Barginere, RN, DNP, FACHEVice President, Clinical Nursing, Chief Nursing OfficerElizabeth M. CullenAdministrative Project AssistantMelanie C. Dreher, PhD, RN, FAANJohn L. and Helen Kellogg Dean of College of Nursing of Rush UniversityGena P. Faas, MPAManager, Government AffairsSarah FinneganAssociate Vice President, Donor EngagementFrancis Fullam, MASenior Director, Marketing Research and Patient RelationsLauren L. Goebel, MBA, MHSAAssistant Vice President, Rush System for HealthRobyn L. Golden, MA, LCSWDirector of Health and AgingJoan E. Kurtenbach, MPHVice President, Strategic Planning, Marketing and CommunicationsNeha MehtaSenior Analyst, Strategic Planning, Marketing and Program DevelopmentMartha Clare Morris, ScDAssistant Provost for Community ResearchTerry Peterson, MPAVice President, Corporate and External AffairsSteven K. Rothschild, MDVice Chairman, Preventive MedicineKatharine E. Struck, JDAssociate General CounselSusan M. Swider, PhD, APHN-BCProfessor, College of NursingSimone Tseng, MHSAAssociate Vice President, Strategic Planning and Program DevelopmentMarilyn Wideman, DNP, RN-BC, FAANAssociate Vice President for Community Healthcare Practice, AssociateProvost for Professional Education and Community EngagementVice President, Resident Services, Chicago Housing AuthorityElizabeth Wurth, MHSAReverend Albert D. Tyson IIIAdministrative FellowPresiding Elder, North District Chicago Conference of African MethodistEpiscopal ChurchesDebra G. WesleyPresident, Sinai Community Institute; Executive Vice President forCommunity Outreach – Sinai Health System2Community Health Needs AssessmentSteering Committee
4Executive Summary5Description of Rush’s Service Area6Methodology7Demographics and Health Trends9Section 1: Social Determinants of Health12Section 2: Access to Health Services14Section 3: Physical Activity, Nutrition, and Weight Control15Section 4: Diabetes17Section 5: Heart Disease and Cardiovascular Risk Factors18Section 6: Women’s Health19Section 7: Mental Health20Section 8: Asthma and Chronic Respiratory Disease21Reflections22Appendix A: Health Care Asset Map23Appendix B: Health Resources in Rush’s Service Area24Appendix C: References and Secondary Sources31Table of ContentsIntroduction and Mission3
Introduction and MissionRush University Medical Center’s long-standingcommitment to the community spans more than 175years. This commitment has grown and evolved throughsignificant thought and care in considering our community’smost pressing health needs. As part of this effort, Rushwill conduct a periodic, comprehensive Community HealthNeeds Assessment (CHNA), which represents a combinationof quantitative and qualitative data that serve to guide bothour community benefits and strategic planning.The assessment will be conducted every three yearsin accordance with regulations promulgated by theInternal Revenue Service pursuant to Section 501(r)(3)of the Internal Revenue Code. The CHNA will serve as afoundation for developing an implementation strategy toaddress those needs that (a) the hospital determines it isable to meet in whole or in part, (b) are otherwise part ofits mission, and (c) are not met or are not adequately metby other programs and services in the defined service area.The CHNA process was guided by a Community HealthNeeds Assessment Steering Committee. Rush is fortunateto have many representatives that are involved with ouroutreach, research and partnership efforts, also providingpublic health and local expertise of the community (seeacknowledgements page for list of Steering Committeemembers).Rush University Medical Center is an academic medicalcenter that encompasses a hospital for adults and childrenwith 669 staffed beds (including Rush Children’s Hospital),the 72-bed Johnston R. Bowman Health Center for olderadult and rehabilitative care, and Rush University. It alsooperates Rush Oak Park Hospital, which has conducted aseparate CHNA with a distinct service area.4Our Investment in the CommunityAt Rush University Medical Center, our mission isto provide the best possible care — whether it’son our campus or in the community — throughcollaboration with local institutions. Rush joinsits neighbors in serving the greater Chicago areaby providing health care, educating future healthcare providers, supporting research, and sendingvolunteers throughout our community. In fiscalyear 2011 (July 2010-June 2011), the cost toRush to provide these community benefits to theWest Side and the Chicago area was more than 220 million.This assessment considered multiple data sources, includingsecondary data (regarding demographics, health statusindicators, and measures of health care access), assessmentsprepared by other organizations in recent years, andprimary data derived from interviews with persons whorepresent the broad interests of the community, includingthose with expertise in public health.The report brings together and provides an analysis ofthese various sources, and sets forth the community healthpriorities identified through the CHNA process.
The following is a brief summary of priority health needs inRush’s service area:The assessment includes the collection and analysis ofthe most up-to-date health, social, economic, housingand other data, as well as qualitative input directly fromcommunity leaders, representatives, and agencies throughfocus groups and interviews. Additionally, ProfessionalResearch Consultants, Inc. was contracted to conducta phone survey of residents in Rush’s service area usingquestions based on the Centers for Disease Control andPrevention’s Behavioral Risk Factor Surveillance System(BRFSS) survey. This methodology allowed the steeringcommittee to analyze both quantitative data and qualitativeinput. The steering committee reviewed all data availableand collectively, through discussion, prioritized those healthneeds of our community that varied substantially frombenchmark data and often times were also aligned withnational, state and local public health initiatives. Access to Health ServicesThe CHNA enables Rush University Medical Center toensure our resources are appropriately directed towardsopportunities where the greatest impact can be realized.Rush will focus on providing resources that address eachof the following health needs through direct patientcare, health education and promotion, pipeline trainingprograms, community-based research, and developing andsupporting community partnerships aligned with theseidentified health needs in our community. Women’s HealthExecutive SummaryIn 2012, Rush University Medical Center conducted acomprehensive, multifactor assessment that fulfills federalregulatory requirements, and also provides a consistentand standardized database to guide the development andimplementation of Rush’s strategic plans while promotingopportunities to work collaboratively to address the healthneeds of service area residents. Social Determinants of HealthRush’s service area shows high rates of poverty,unemployment, low education attainment, and a largeuninsured and Medicaid population.Structural, financial, and personal barriers hinderresidents from accessing health services in the area. Physical Activity, Nutrition, Weight ControlNutrition and physical activity of the population mustbe improved to tackle high rates of obesity. DiabetesDiabetes and elevated blood sugar levels remain serioushealth issues in the service area. Heart Disease and Cardiovascular Risk FactorsHeart disease is the leading cause of death amongresidents. Many residents suffer from high bloodpressure and high cholesterol, major symptoms ofheart disease.Breast cancer mortality and mammography screeningrates show significant disparities among racial/ethnicgroups. Caesarean section rates in the area are muchhigher than CDC’s health goals. Mental HealthMany residents suffer from poor mental health statusand have high rates of symptoms for chronic depression.Substance abuse is a public health issue in the areaas well. Asthma and Chronic Respiratory DiseaseChicago has the highest asthma mortality rate in thecountry, with asthma prevalence rates particularly high inRush’s service area. Smoking rates in Rush’s service area,although declining, are higher than CDC’s health goals.5
Description of Rush’s Service AreaRush Service AreaRush UniversityMedical CenterFigure 1. Chicago Map by ZIP Code and Community AreaSource: Northeastern Illinois Planning Commission, 2003Rush identified the community it serves by includingcommunities surrounding the hospital and conductinga patient origin ZIP code analysis. Rush’s service areacomprises seven ZIP codes, including the community areasof Near West Side, Lower West Side, West Town, EastGarfield Park, West Garfield Park, North Lawndale, andSouth Lawndale.6The demographics and health status statistics used in thisreport included both the ZIP code level and community arealevel data where available. Since Chicago residents morereadily identify with community areas than ZIP codes, thereport attempted to show data by community areas wherepossible. As shown in the map (figure 1), the seven ZIPcodes in our service area show significant overlap with thecommunity areas mentioned.
Focus GroupsRush retained Professional Research Consultants, Inc. (PRC),facilitated by the Metropolitan Chicago Healthcare Council(MCHC), to conduct community interviews in Rush’s servicearea. More information on PRC is provided in Appendix C.The final 216-question survey instrument was approvedby MCHC and PRC, with input from participating memberhospitals. The survey instrument used for this study is basedlargely on the U.S. Department of Health and HumanServices’ Behavioral Risk Factor Surveillance System, as wellas various public health surveys and customized questionsaddressing gaps in indicator data relative to healthpromotion and disease prevention objectives and otherrecognized health issues.As part of the study, PRC also conducted two focus groupsin June 2012 relevant to Rush’s location — Cook Countyand Downtown/West Chicago. Sixteen key informants tookpart. These included physicians, other health professionals,social service providers, community leaders, and public healthexperts, as well as individuals who work with low-income,minority, or medically underserved populations, and thosewho work with persons with chronic disease conditions.To ensure the best representation of the populationsurveyed, a telephone interview methodology — one thatincorporates both landline and cell phones interviews —was employed. The primary advantages of telephoneinterviewing are timeliness, efficiency, and random-selectioncapabilities. For comparison purposes, PRC gave Rushaccess to data from all ZIP codes within DuPage, Lake, andCook counties.Surveys were administered among a random sample ofhouseholds within each ZIP code. Once the surveys werecompleted, they were weighted in proportion to the actualpopulation distribution at the ZIP code level to appropriatelyrepresent the demographics (gender, age, race, ethnicity,and poverty status) of the hospital’s service area.While this assessment is comprehensive, it cannot measureall possible aspects of health in the community, norcan it adequately represent all possible populations ofinterest. It must be recognized that certain informationgaps might, in some ways, limit Rush’s ability to assessall of the community’s health needs. For example, certainpopulation groups, such as the homeless, institutionalizedpersons, or those who only speak a language other thanEnglish or Spanish, are not represented in the survey data.Other population groups, for example, pregnant women,lesbian/gay/bisexual/transgender residents, undocumentedresidents, and members of certain racial/ethnic or immigrantgroups, might not be identifiable or might not be representedin numbers sufficient for independent analyses.MethodologyCommunity SurveysInterviewsRush conducted in-person individual interviews withexternal stakeholders and internal staff between September2012 and January 2013. Participants were chosen becauseof their ability to identify the primary health concerns ofthe community, their expertise in public health or theirassociation with the types of program interventions orresources that could address identified concerns.The interviewees consisted of government officials,community organization leaders, church leaders, schoolleaders, physicians, public health officials and nurses.By virtue of their positions and professional training,these individuals have considerable expertise related totheir constituent groups and have provided invaluableinsights throughout Rush’s CHNA process. Please see theacknowledgements page for the list of all participantsincluding those with special knowledge or expertise inpublic health and leaders or representatives of medicallyunderserved, low-income, and minority populations.7
MethodologySecondary SourcesExisting data sources were consulted to complementthe research quality of the CHNA. This data includeddemographics, social and health indicators, mortalitystatistics, and other public health data. Additionally,Appendix A, a health care asset map, and Appendix B,a list of various health resources in Rush’s service area,have been included to identify the existing health carefacilities and other resources within the communitywhich are available to meet the needs identified throughthis CHNA.The following sources were referenced for this report: Centers for Disease Control and Prevention (CDC) CDC’s Healthy People 2020 Chicago Department of Public Health (CDPH) CDPH’s Chicago Plan CDPH’s Healthy Chicago Plan Journal of Allergy and Clinical Immunology National Center for Health Statistics National Prevention Strategy Patient Protection and Affordable Care Act of 2010 Sinai Urban Health Institute U nited Way of Metropolitan Chicago’s Health & WellnessImpact Plan 2012 – 2016 U.S. Bureau of Labor Statistics U.S. Census Bureau U.S. Department of Health & Human Services The CHNA Steering Committee8
DemographicsIn 2010, the Rush service area had a total populationof 330,661, which is a 9 percent decrease from 2000.Most of Chicago’s community areas experienced a dropin population between 2000 and 2010. The age profileremained fairly stable from 2000 to 2010 (table 1).Community AreaAge 0–17Age 18– 44Age 45 – 64West Town15%63%16%6%West Garfield Park31%36%23%10%East Garfield Park30%38%23%9%Near West Side14%63%16%7%North Lawndale33%37%21%9%South Lawndale30%48%17%5%Lower West Side27%48%18%7%Total Rush Area23%52%18%7%Total Chicago23%44%23%10%Demographics and Health TrendsOverall, 39 percent of residents in Rush’s service area areHispanic, 32 percent are black, 24 percent are white, and 5percent identified as other. However, the race profile for theservice area varies by individual community area (figure 2).Age 65 Table 1. Age ProfileSource: Chicago Department of Public Health, 2010; U.S. Census Bureau, 0%3%1%2%WestTownHispanic4%WestGarfield ParkEastGarfield ParkCaucasian9%1%6%NearWest SideNorthLawndaleAfrican AmericanSouthLawndaleLowerWest SideOverall RushService AreaAll OtherFigure 2. Race/Ethnicity Profile for Communities in Rush’s Service AreaSource: Chicago Department of Public Health, 20109
Demographics and Health Trends250%200%150%100%50%0%Cancer (All Sites)Heart DiseaseDiabetes-relatedStrokeLung Cancer(Cerebrovascular Disease)Communities in Rush Service AreaChicagoU.S. BaselineBreast Cancerin FemalesAssault(Homicide)HP 2020Figure 3. Mortality Rates (per 100,000)Source: Chicago Department of Public Health, 2007Mortality RatesNatality RatesMost mortality rates for the communities in Rush’s servicearea are higher than the corresponding Chicago, U.S.baseline, and Healthy People 2020 target rates (figure 3).In general, mortality rates (per 100,000 population) arehigher in Rush’s community areas than in Chicago overalland the rest of the United States, with some varianceamong different racial/ethnic groups. North Lawndaleand West Garfield have particularly high mortality ratesin most disease types.The teen birth rate is calculated from the number of birthsto teens aged 15 –19 per 1,000 population of 15 –19females. West Garfield Park and North Lawndale have twoof the highest teen birth rates within Chicago, with rates of115 and 109 per 1,000, respectively. In Chicago, teen birthrates declined by 37 percent in the past decade.The mortality rate overall dropped by 21 percent inChicago between 1999 and 2007. In particular, Chicagoheart disease mortality rate decreased 37 percent duringthat time.10Infant mortality in East and West Garfield Park, NorthLawndale, and the Lower West Side is significantly higherthan the U.S. baseline of seven per 100,000.
Health StatusOverall, community survey respondents reported beinghealthy, with 44 percent reporting very good or excellenthealth and 76 percent reporting good or better health.Twenty-four percent ranked their health as fair/poor, whichis high compared to other areas (figure 4).Demographics and Health TrendsRisk factors for chronic disease — including obesity, highblood pressure, high cholesterol, diabetes, mental health,and asthma — are highly prevalent in Rush’s service area(figure 5), and were cited as major health issues by bothprimary and secondary sources. The following pagesattempt to provide a more detailed analysis of each majorhealth issue ice AreaDowntown/West Cook CountyCook CountyIllinoisU.S.Figure 4. Percent of Respondents Rating Their Physical Health as Fair/Poor in Rush’s Service AreaSource: PRC, 2012; CDC, 2011High Blood Pressure38%Obesity32%High Cholesterol26%Diabetes10%Asthma (Adult)10%Chronic Lung Disease9%Major Depression9%Heart Disease/Heart Attack4%Chronic Kidney Figure 5. Have You Ever Been Told by a Doctor or Health Professional That You Have Any of the Following? (In Rush’s service area)Source: PRC, 201211
Social Determinants of HealthOverviewViolenceThe World Health Organization defines social determinantsof health as circumstances shaped by the distribution ofwealth, power, and resources. These social determinantsare largely responsible for the differences in health statusamong communities.Violence is a major issue in Rush’s service area. The CDPH’sChicago Plan ranked violence as the 2nd most importanthealth-related issue in Chicago’s West Side. Figure 3 showsmortality rates due to homicide as much higher in Rush’sservice area compared to overall Chicago, U.S., and HealthyPeople 2020 target rates. Violence prevention is a focus ofthe Chicago Department of Public Health over the next fiveyears. In 2010 alone, violence claimed 435 lives in Chicago.Poverty, Unemployment, and EducationRush’s community areas have high rates of poverty. Fiveof the seven communities report a higher percentage ofhouseholds living below the poverty line ( 23,550) than inChicago as a whole, and all seven communities have higherrates than Illinois and the U.S. A few of Rush’s communitieshave particularly high rates of poverty. The poverty rate inEast and West Garfield Park is 40 percent and is 38 percentin North Lawndale. Six communities had an unemploymentrate above 10 percent in 2011, including West Garfield Parkwith 25 percent and North Lawndale with 19 percent.Many of the same communities with high poverty andunemployment rates also have a low level of educationalattainment among the adult population. In five of the sevencommunities in the Rush service area, more than a quarterof residents 25 years of age and older do not have a highschool diploma. In South Lawndale, 59 percent of people inthis age group do not have a high school diploma, which isthe worst rate among all communities in Chicago.12According to PRC’s surveys, 16 percent of respondents inRush’s service area ranked their neighborhood as “not at allsafe” and 9 percent have been victims of violent crime inthe past five years.Students missing school due to safety issues was also notedas a major concern in Rush’s service area.
Social Determinants of HealthHealth CoverageIn FY 2010, there were 127,057 Medicaid recipients inRush’s service area. This represents 38 percent of the area’spopulation. Children made up 59 percent of the area’sMedicaid recipients (figure 6).35%41%In 2010, Chicago had an uninsured rate of 20 percent. Ofthe uninsured, Hispanics comprise the largest proportion,followed by blacks, whites, and Asians (figure 7).According to PRC’s survey data for Rush’s service area, ofthose currently insured, 13 percent went without healthcoverage at some point over the past year.19%5%BlacksHispanics6%7%AsiansWhitesFigure 7. Chicago’s Uninsured by Race/Ethnicity10%Source: Chicago Department of Public Health, 200959%18%ChildrenOther AdultsPartialSeniorsDisabled AdultsFigure 6. Breakdown of Medicaid Enrollees in Rush’s Service AreaSource: Illinois Department of Healthcare and Family Services, FY2010Note: Partial Medicaid consist of Medicare beneficiaries who areenrolled in a Medicaid program that does not offer Medicaid healthcoverage, but does provide assistance in paying Medicare premiumsand other out-of-pocket costs. Medicaid programs that provide“partial” Medicaid benefits include Medicare Savings Programs(QMB, SLMB, QI, and QDWI).13
Access to Health ServicesOverviewRatings and Use of Health Services in Rush’s AreaThe Patient Protection and Affordable Care Act of 2010highlights the importance of access to health care as apublic health issue on a national level. In Chicago, accessto care was found to be an important issue as well. Havingaccess to health services is an important determinant ofhealth status and is critical to eliminating health disparitiesand increasing years of healthy life.Rush community area respondents reported satisfactionwith the overall health care services available to them in thearea — with ratings of 44 percent very good or excellent,36 percent good, and 20 percent fair or poor (figure 8).According to the U.S. Department of Health and HumanServices, structural, financial, and personal barriers canlimit access to health care. Structural barriers include thelack of providers or facilities to meet special needs orthe difficulties in the scheduling process for a patient toget needed care. The key financial barriers that patientsexperience are a lack of health insurance and not havingthe financial capacity to cover health services outside theirhealth plan or insurance program. Personal barriers includecultural or spiritual differences, language and transportationbarriers, not knowing how or when to seek care, orconcerns about confidentiality or discrimination.The majority of survey respondents go to a hospital-basedclinic (34 percent) or a doctor’s office (36 percent) whensick or in need of medical advice, while some (7 percent)visit an emergency room. Thirty percent have not had aroutine exam in the past year.25%36%Several data sources and community interviews indicatedthat there are major concerns in Rush’s service area relatedto access to health services, particularly financial andstructural barriers.19%7%ExcellentVery Good13%FairPoorGoodFigure 8. Rating of Health Care Services Available in Rush’sService AreaSource: PRC, 201214
Financial BarriersStructural barriers include difficulty getting appointmentsand receiving continuity of care.Due to increasing unemployment rates and a high povertylevel, many residents are uninsured and cannot affordhealth care services.According to the community surveys, 44 percent of therespondents indicated at least one barrier in accessinghealth care services in the past year. Inconvenient hours,difficulty getting appointments, and difficulty finding aphysician were noted as reasons that prevented respondentsfrom getting care (figure 9). In addition, Rush’s patientsidentify some challenges to access and schedulingappointments in the Press-Ganey patient satisfaction ficultyGetting Appt.DifficultyFinding PhysicianFigure 9. Percent of Respondents Who Noted the FollowingBarriers for Not Getting Care in Rush’s Service AreaSource: PRC, 2012Access to Health ServicesStructural BarriersAccording to the community surveys, in the past year,21 percent stated that cost prevented them from gettingcare. In addition, 21 percent responded that cost preventedthem from getting prescriptions and 20 percent skippeddoses of their prescriptions to save money (figure 10).Personal/Cultural BarriersAccording to several interviews and demographic datafrom the U.S. Census Bureau, the diversity of Chicago’spopulation highlights the importance of diversity andcultural effectiveness within the public health and healthcare workforce. Rush’s service area includes a large Hispanicpopulation (see figure 2), who report that languageand cultural barriers often prevent them from receivingadequate care.According to Chicago’s Department of Public Health,health education is particularly important for non-whiteracial/ethnic groups. Chicagoans are in need of linguisticallyand culturally effective information to help themunderstand and access the care they need.In addition, inadequate transportation is also a barrier tocare, with 11 percent of community survey respondentsstating that transportation hindered a physician visit inthe past year.25%20%15%21%21%20%Costs Preventedfrom Getting CareCosts Preventedfrom GettingPrescriptionsSkipped DosesDue to Cost10%5%0%Figure 10. Percent of Respondents With Cost Barriers to Care inRush’s Service AreaSource: PRC, 201215
Physical Activity, Nutrition, and Weight ControlOverviewRates in Rush’s Service AreaThe problem of adult and child obesity has reachedepidemic levels, both nationally and in Chicago. Sixty-sevenpercent of Chicago adults are considered either overweightor obese; this shows a 48 percent increase over the pastdecade. The Healthy People 2020 target is 31 percent orless in the population.According to the community surveys, 40 percent ofrespondents were overweight (25 BMI 30) and32 percent of respondents were obese (BMI 30.)The total 72 percent is greater than the already highChicago, Illinois, and U.S. rates (figure 11).It is widely recognized that being overweight or obese canlead to a variety of chronic diseases, including heart disease,diabetes, hypertension, cancer, stroke, and osteoarthritis.It is critical to address this issue not only to enhance healthand well-being within the community but also to reducehealth care costs over the long term.According to the Chicago Department of Public Health,71 percent of high school students and 29 percent of adultsdo not get adequate physical activity, and over 70 percentof students and adults do not eat the recommendednumber of servings of fruits and vegetables. In 2010, anestimated 380,000 Chicagoans lived in food deserts, anarea where there is little to no access to foods needed tomaintain a healthy vice AreaChicagoIllinoisU.S.OverweightObeseFigure 11. Overweight and Obesity RatesSource: PRC, 2012; Chicago Department of Public Health, 2009; CDC, 201116Poor nutrition is a major cause of obesity. Nutritiousfoods are generally more expensive and fresh fruits andvegetables are difficult to access in economically poorercommunities. Twenty-nine percent of community surveyrespondents stated that it is somewhat or very difficultto find fresh produce affordably. Despite 47 percent ofrespondents receiving medical advice on nutrition, obesityrates are still climbing.Inactivity also promotes obesity. According to communitysurveys, 54 percent of community respondents do notmeet physical activity guidelines. According to PRC andinterviews, due to safety concerns, lower income residentsare less likely to spend time outside or in parks and aremore likely to drive instead of walk. Twenty-four percentof community survey respondents said it was somewhat orvery difficult to find safe places to exercise.In addition, children in Rush’s service area are more likely tospend time in front of a television or computer. Fifty-sevenpercent of children from the community surveys have threeor more hours of screen time per day, much higher than theU.S. average of 43 percent.Interview FindingsIn Rush community interviews, participants pointed toissues with lunch offerings in school cafete
Vice President, Clinical Nursing, Chief Nursing Officer Elizabeth M. Cullen Administrative Project Assistant Melanie C. Dreher, PhD, RN, FAAN John L. and Helen Kellogg Dean of College of Nursing of Rush University Gena P. Faas, MPA Manager, Government Affairs Sarah Finnegan Associate Vice President, Donor Engagement Francis Fullam, MA