Transcription
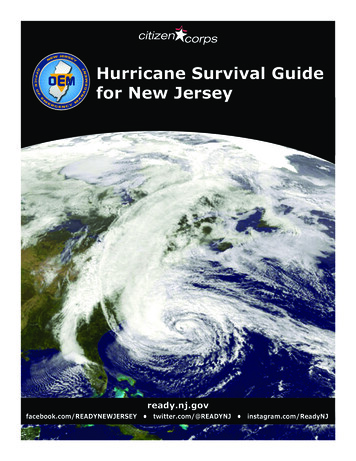
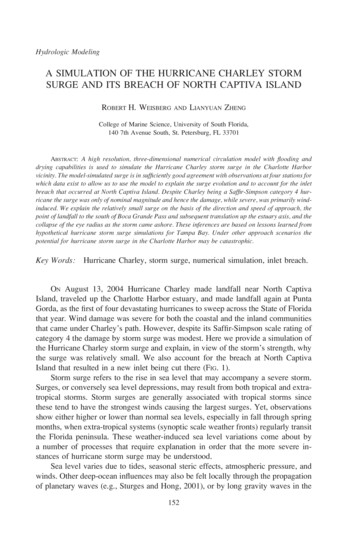
Hydrologic ModelingA SIMULATION OF THE HURRICANE CHARLEY STORMSURGE AND ITS BREACH OF NORTH CAPTIVA ISLANDROBERT H. WEISBERGANDLIANYUAN ZHENGCollege of Marine Science, University of South Florida,140 7th Avenue South, St. Petersburg, FL 33701ABSTRACT: A high resolution, three-dimensional numerical circulation model with flooding anddrying capabilities is used to simulate the Hurricane Charley storm surge in the Charlotte Harborvicinity. The model-simulated surge is in sufficiently good agreement with observations at four stations forwhich data exist to allow us to use the model to explain the surge evolution and to account for the inletbreach that occurred at North Captiva Island. Despite Charley being a Saffir-Simpson category 4 hurricane the surge was only of nominal magnitude and hence the damage, while severe, was primarily windinduced. We explain the relatively small surge on the basis of the direction and speed of approach, thepoint of landfall to the south of Boca Grande Pass and subsequent translation up the estuary axis, and thecollapse of the eye radius as the storm came ashore. These inferences are based on lessons learned fromhypothetical hurricane storm surge simulations for Tampa Bay. Under other approach scenarios thepotential for hurricane storm surge in the Charlotte Harbor may be catastrophic.Key Words:Hurricane Charley, storm surge, numerical simulation, inlet breach.ON August 13, 2004 Hurricane Charley made landfall near North CaptivaIsland, traveled up the Charlotte Harbor estuary, and made landfall again at PuntaGorda, as the first of four devastating hurricanes to sweep across the State of Floridathat year. Wind damage was severe for both the coastal and the inland communitiesthat came under Charley’s path. However, despite its Saffir-Simpson scale rating ofcategory 4 the damage by storm surge was modest. Here we provide a simulation ofthe Hurricane Charley storm surge and explain, in view of the storm’s strength, whythe surge was relatively small. We also account for the breach at North CaptivaIsland that resulted in a new inlet being cut there (FIG. 1).Storm surge refers to the rise in sea level that may accompany a severe storm.Surges, or conversely sea level depressions, may result from both tropical and extratropical storms. Storm surges are generally associated with tropical storms sincethese tend to have the strongest winds causing the largest surges. Yet, observationsshow either higher or lower than normal sea levels, especially in fall through springmonths, when extra-tropical systems (synoptic scale weather fronts) regularly transitthe Florida peninsula. These weather-induced sea level variations come about bya number of processes that require explanation in order that the more severe instances of hurricane storm surge may be understood.Sea level varies due to tides, seasonal steric effects, atmospheric pressure, andwinds. Other deep-ocean influences may also be felt locally through the propagationof planetary waves (e.g., Sturges and Hong, 2001), or by long gravity waves in the152
No. 00S2 2006]WEISBERG AND ZHENG—HURRICANE SURGE SIMULATION153FIG. 1. Coastline of the North Captiva Island on September 21, 2001 (left panel) and on August 16,2004 (right panel) after Hurricane Charley made landfall (A. Sallenger, personal communication).case of a Tsunami. Here we concern ourselves with astronomical tides, seasonalsteric effects, atmospheric pressure, and winds. Tides are well represented for thewest coast of Florida by existing tidal models, e.g., for the full Gulf of Mexico in the¼8 resolution global model of Tierney and co-workers (2000) and for the westFlorida shelf in the higher resolution regional model of He and Weisberg (2002).Steric effects are due to seasonal heating and cooling that alters seawater density andhence the water volume. This amounts to about plus or minus 20 cm for the Gulf ofMexico, with the highest (lowest) elevations occurring in late summer (winter).Atmospheric pressure affects sea level through the ‘‘inverted barometer effect’’by amount equal to 1 cm per mbar of pressure variation. Thus if pressure decreaseslocally sea level will rise, and this adjustment occurs rapidly through long gravitywave propagation at speed (gH)1/2, where g is the acceleration of gravity and H isthe water depth. Typical pressure fluctuations are a few mbar, and even under themost extreme hurricanes the inverted barometer effect is only about 100 cm so thisalone cannot account for observed surges.Wind effects arise by both the along shore and across shore components of windstress, with their relative importance depending on the water depth and the durationover which the wind blows. In deep water, and due to the Earth’s rotation, the nettransport of water by the wind occurs at a 908 angle to the right (in the northernhemisphere) of the wind. If this transport impinges on a coast, water will pile upalong the coast. Thus an along shore component of wind stress will cause a stormsurge (depression) if the coast is to the right (left) of the wind. For instance, inadvance of cold fronts, when the winds are from the south, we see higher thannormal tides on the west coast of Florida, and, conversely, on the trailing side ofcold fronts, when the winds are from the north, we see lower than normal tides.
154FLORIDA SCIENTIST[VOL. 69Since these wind-normal transports are a consequence of the Earth’s rotation (via theCoriolis force) it takes about a pendulum day (2p/f ¼ 12 hr/sin/), or about 1 dayalong the west coast of Florida (since the latitude / is about 308) to set up theresponse. The amount by which sea level may rise depends on the magnitude of thealong shore current produced by the along shore winds. The relevant force balance isbetween the pressure force due to the across shore slope of the sea surface, gx, andthe Coriolis force due to the along shore current, v. Thus fv ¼ qggx, where q is thewater density and f is the Coriolis parameter. Even under very strong winds it is rarefor v to exceed about 100 cm/s because of bottom friction, and, consequently, if theslope begins about 100–200 km offshore the surge by the along shore wind stresscomponent may be about 60–120 cm. Moreover, the winds must blow for abouta day for this to be fully realized. So while the along shore component of wind stressaccounts for the sea level surges of a few feet, as synoptic weather fronts go by, itcan only account for a portion of the surge by tropical storms. Here the onshorecomponent of wind stress is the main culprit.The across shore component of wind stress increases in importance as the waterdepth decreases since this bottom stress diminishes the Coriolis tendency fortransport to be to the right of the wind. Hence winds blowing onshore over shallowwater will pile water up along the coast, and conversely. The force balance isbetween the pressure gradient force due to the across shore slope of the sea surfaceand the vertical stress gradient. Thus qggx ¼ sz, where sz is the vertical stressgradient. Integrating over depth results in qgHgx ¼ sw sb, where the superscripts, wand b, denote wind and bottom stresses, respectively. This shows that the acrossshore sea surface slope is directly proportional to the wind stress and inverselyproportional to the water depth. The shallower the water, the larger the sea surfaceslope, and the farther upslope the larger the surge. Hence broad, shallow continentalshelves, and especially long estuaries, are more prone to large surge than narrow,deep continental shelves. It also takes a certain amount of time to drive water fromone point to another, thereby establishing the surface slope, so winds must blow overa given region for several hours to develop the slope and hence the storm surge.In summary, a storm surge comes about by atmospheric pressure, along shorewind stress, and across shore wind stress. For extra-tropical systems the first two aregenerally the most important, whereas for tropical systems it is the last of these thataccounts for the bulk of the storm surge. Not mentioned yet, nor quantitativelytreated herein, are the wind induced surface gravity waves whose effects add to thestorm surge.With storm surge entailing several contributors that are each geometry and timescale dependent, its simulation cannot be generalized. Required are three elements:1) a physics-based model, 2) a supporting data set on water depths and landelevations, and 3) wind and surface pressure fields to drive the model. Elevationsand water depths alone are insufficient since sea level does not rise and falluniformly. Surge is the highly localized impact of surface slopes by the factorsdiscussed above, and since surge is mostly in response to wind, the winds must besufficiently accurate to drive the model. All three of these elements are available forthe Hurricane Charley simulation. We use the finite volume coastal ocean model
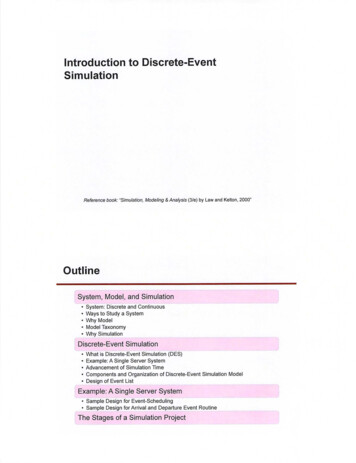
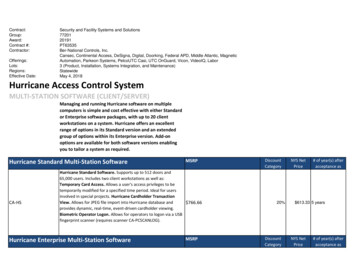
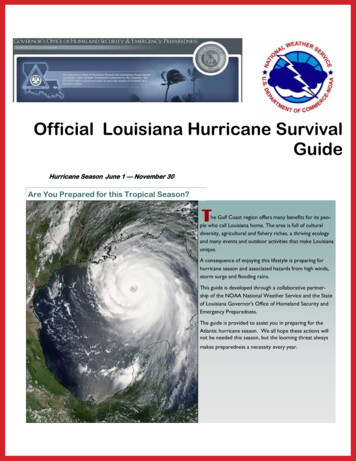
No. 00S2 2006]WEISBERG AND ZHENG—HURRICANE SURGE SIMULATION155(FVCOM) with flooding and drying capabilities developed by Chen and co-workers(2003). The model grid is overlain on a South Florida Water Management District(SFWMD), merged bathymetric/topographic data set provided by T. Liebermann(personal communication, 2004). For winds and pressure we combine available datawith an analytical expression for the structure of a hurricane (Holland, 1980) sincethere are never enough data to fully specify the wind field for any given storm.Section 2 describes the model and its implementation for Hurricane Charley.The evolution of the modeled surge is given in Section 3 along with comparisonsto the existing data. It is here that we also provide the mechanism by which anapproximate 450 m wide breach occurred on North Captiva Island. Section 4 discusses these findings in the light of what we learned from previous Tampa Bayregion simulations and offers a set of conclusions.MODEL DESCRIPTION AND CONFIGURATION—There are basically three types of numerical modelconstructs that may be used for simulating storm surges: finite difference, finite element, and finitevolume, all differing in how they organize their grids and how they solve the governing equations ofmotion. The FVCOM, a finite volume model, combines the attributes of both finite difference and finiteelement models. As in finite element models it uses a non-overlapping unstructured triangular mesh forhigh horizontal resolution where needed, but it solves the hydrodynamic equations by finite-differences,using a flux calculation integrated over each grid control volume. This assures the conservation of mass,energy, salt, and heat in both the individual grid cells and over the entire computational domain, even forlong integrations. An application of the FVCOM to the baroclinic, three-dimensional and time dependentcirculation of the Tampa Bay estuary is given by Weisberg and Zheng (2006a), and Weisberg and Zheng(2006b) used the FVCOM for hypothetical hurricane storm surge simulations of Tampa Bay, results ofwhich will be discussed in section 4.The FVCOM domain used here (FIG. 2) extends from the Mississippi River delta in the north to theFlorida Keys in the south, with an open boundary arching in between. Model resolution increases from thedeep-ocean toward the Charlotte Harbor region. The highest resolution of about 80 m (a zoomed-in viewis also provided in Figure 2) is centered on the barrier islands, where Hurricane Charley initially madelandfall. Within the estuary the resolution is less than 300 m, and the lowest resolution is about 20 kmalong the open boundary. The reason for a large model domain is to allow for running different hurricanescenarios for storms approaching from different directions. For the transition from ocean to land the modeldomain extends landward to the 10 m elevation contour. A total of 63077 triangular cells with 31821nodes comprise the horizontal, and 31 uniformly distributed sigma coordinate layers comprise the vertical.The model grid is superimposed on the 30 m resolution SFWMD, merged bathymetric/topographic dataset (FIG. 3). We use mean sea level as a datum, and we set the sea wall height at 1.2 m elevation. Thereforea minimum 1.2 m surge is required to cause flooding in this model. While the model is capable ofbaroclinic simulations we ran it with constant density for the hurricane storm surge simulations sinceobservations show that high winds and heat flux rapidly lead to vertically well-mixed density. Threedimensionality nevertheless remains important since this determines the bottom stress.Given the model, supported by high-resolution bathymetry and topography, hurricane storm surgesimulation requires sufficiently accurate atmosphere forcing fields (winds and pressure). We used theanalytical expression for the structure of a prototypical hurricane developed by Holland (1980) sinceactual measurements over the evolution of any storm are sparse and error prone. This prototypicalhurricane construct requires information on the eye radius, the central pressure, and the maximum windspeed, and these information, along with the storm track, were obtained at three-hour intervals from theNational Oceanic and Atmospheric Administration (NOAA), National Hurricane Center (NHC) website.We further modified the storm track for consistency with local Doppler radar images. Figure 4 shows thetrack, eye radii, central pressures and maximum wind speeds employed, and Figure 5 gives an example ofthe prototypical hurricane wind and pressure distributions corresponding to the time when the eye passedover Punta Gorda, Florida. Such distributions were calculated for every model time step (at 20 sec
156FLORIDA SCIENTIST[VOL. 69FIG. 2. The non-overlapping, unstructured triangular grid used in this simulation (upper panel) andits zoomed view focusing on Charlotte Harbor vicinity (lower panel).intervals) by linearly interpolating between the three-hourly NOAA NHC data. In this way we were ableto model the Hurricane Charley surge using winds and pressure that systematically varied as the stormapproached and transited across the Charlotte Harbor region. Drawbacks to this approach are that theHolland (1980) prototypical storm is symmetric, whereas asymmetries occur in nature, and the actualwinds contain a background field on which the storm is superimposed. These are of particular note afterthe storm passes since in the wake of a storm there tends to be a continuation of winds feeding it as itprogresses away.
No. 00S2 2006]WEISBERG AND ZHENG—HURRICANE SURGE SIMULATION157FIG. 3. The 30-m resolution bathymetric and topographic image. Triangles denote observed sealevel stations used (Peace River station beyond image range).HURRICANE CHARLEY STORM SURGE SIMULATION—The start time for the modelrun is 0300 UTC on August 13, 2004, when Hurricane Charley was positionedsouth of Cuba, and the end time is 2400 UTC on August 13, 2004, when thehurricane was positioned 140 km northeast of the study region. All future times willbe referenced to UTC (local daylight savings time minus four hours). The model sealevels and currents were initialized as zero since the hurricane started far way fromthe model domain. Hurricane Charley entered the Gulf of Mexico at 1200 with aneye radius, central pressure, and maximum wind speed of 27.5 km, 967 mbar, and48.8 m/s, respectively. At 1500 the hurricane veered right toward Charlotte Harbor
158FLORIDA SCIENTIST[VOL. 69FIG. 4. The Hurricane Charley track along with eye radii, central pressures, and maximum windspeeds provided from NOAA NHC website.
No. 00S2 2006]WEISBERG AND ZHENG—HURRICANE SURGE SIMULATION159FIG. 5. Distributions of pressure (upper panel) and wind speed (lower panel) as a function of radialdistance from the hurricane eye. These distributions are corresponding to the time when hurricane eyepasses over Punta Gorda.and started to intensify to category 4. From 1800 to 2100 the winds remainedabout the same while the eye radius decreased and the central pressure droppedto 10 km and 941 mbar, respectively. During this interval it made landfall nearNorth Captiva Island, proceeded up the axis of the estuary, and passed over PuntaGorda.Hurricane Charley moved very rapidly across the study region, taking aboutthree hours to transit 100 km. Figure 6 shows the model simulated sea level evolutionfrom 1900 to 2130 in half-hourly snapshots. Areas of sea level set up (storm surge)and set down are evident, but nowhere is the storm surge very large. The largest surgeof about 250 cm occurred near Ft. Myers Beach at 2030. Beginning at 1900 when thehurricane eye is some 35 km southwest of North Captiva Island sea level is first setdown on by about 100 cm in advance of the storm since the winds are directedoffshore, and some draining is found around the shallow Pine Island Sound region. Itis only within the hurricane eye where sea level is elevated by about 60 cm due to the
160FLORIDA SCIENTIST[VOL. 69FIG. 6. Model simulated sea level evolution from 1900 to 2130 in half-hourly snapshots. The Cdenotes the hurricane eye location, and the filled square denotes the breach location on North Captiva Island.inverted barometer effect. By 1930 the hurricane eye is within 15 km of landfall,additional draining occurs on both sides of the Captiva Islands and on the sound sideof Sanibel Island. It is at this time when the maximum sea level depression of about200 cm occurs on the gulf side of North Captiva Island, whereas sea level is increasedon the sound side by approximately 50 cm, generating a seaward directed sea levelgradient across the barrier island. Farther south from the hurricane eye we see sea
No. 00S2 2006]WEISBERG AND ZHENG—HURRICANE SURGE SIMULATION161level beginning to rise as winds blow onshore there. For example, the sea level atSan Carlos Pass increases to about 50 cm.Landfall occurred at 2000, at which time Figure 6 shows sea level to be elevatedeverywhere along the coast to the south of the eye, particularly at Sanibel (150 cm)and Ft. Myers Beach. To the north of the eye and within most of the CharlotteHarbor estuary sea level is set down, particularly on the east side with draining there,in Pine Island Sound, and on the gulf side of Cayo Costa Island. Some surge isbeginning on the west side of the estuary, however.By 2030 we see a significant change when the hurricane eye moves about halfway up the axis of the estuary. The entire Captiva/Sanibel barrier island complexnow has about a 100 to 150 cm surge, with the local maximum at North CaptivaIsland (the maximum recall is near Ft Myers Beach). More draining occurs on theeast side of the estuary, and surge, although small, increases on the west side.Landfall at Punta Gorda occurs at 2100, but with a very small eye radius. Withwinds acting over a smaller region the surge offshore diminishes, and by 2130 sealevel in this simulation is returning toward normal.Explanations for why the Hurricane Charley storm surge was relatively smalland also why an inlet was cut at North Captiva Island are both straight forward.Before providing these, however, it is important to lend some credibility to theanalyses by comparing simulated with observed sea level elevations. Recorded datawith sea level measures that are resolved by our model are limited to four stations:Ft Myers, Big Carlos Pass, Peace River, and Boca Grande Pass. The locations areshown in Figure 3. Data from the Ft. Myers gauge, located in the CaloosahatcheeRiver, are provided by NOAA. The Big Carlos Pass data are from a University ofSouth Florida, Coastal Ocean Monitoring and Prediction System station that wascoincidentally deployed a few weeks prior to the event. The Peace River and BocaGrande Pass data are from US Geological Survey gauges. Because we simulatedstorm surge relative to mean sea level, adjustments must be made to correct for tidegauge datum, astronomical tides, and seasonal steric elevations. Datum correctionsare based on tide gauge site surveys relative to the North American Vertical Datumof 1983, or NAVD83. Records of long enough duration were available at the Ft.Myers and Big Carlos Pass stations to perform a tidal harmonic analysis in order tosubtract the astronomical tides from the record. Shorter records from the Peace Riverand Boca Grande Pass stations were not amendable to detiding so we adjusted ourmodel datum to conform with the tidal phase at the time of maximum surge. Tidesare not a major factor for two reasons. First the tidal range in the Charlotte Harborvicinity is generally small and August 13, 2004 corresponded to neap tide. For allgauges we also made adjustment for the seasonal steric sea level obtained from ananalysis of ten years of detided data. For the Hurricane Charley time period thisamounted to 10 cm.Figure 7 shows the resulting comparisons. Three time series are shown for theFt. Myers and Big Carlos Pass stations: observed, datum adjusted sea level; detidedsea level, or surge; and the simulated surge adjusted for the seasonal steric effect.Two time series are shown for the Peace River and Boca Grande Pass stations:observed, datum adjusted sea level, and the simulated surge adjusted for both the
162FLORIDA SCIENTIST[VOL. 69FIG. 7. Time series comparisons for observed and simulated sea levels at Ft. Myers, Big CarlosPass, Peace River, and Boca Grande Pass. The thin-dashed lines are observed, detided sea levels; the solidlines are observed sea levels; and the thick-dashed lines are the simulated sea levels.seasonal steric effect and the astronomical tidal elevation at the time of maximumsurge. At each of these stations the maximum surge and the time of occurrence agreefairly well. Quantitatively, the differences between observed and simulated surgesare 4 cm at Ft. Myers, 23 cm at Big Carlos Pass, 10 cm at the Peace River, and5 cm at Boca Grande Pass, where positive (negative) denotes a model overestimate(underestimate). The time differences between observed and simulated surges are
No. 00S2 2006]WEISBERG AND ZHENG—HURRICANE SURGE SIMULATION163FIG. 8. Model simulated sea level time series sampled on the gulf (grey line) and sound sides (darkline) of the location in North Captiva Island where an inlet breach occurred.less than one hour except at the Ft. Myers station, where the difference is abouttwo hours. At Ft. Myers and Big Carlos Pass sea level remains elevated after thesimulated surge abates. This may be a consequence of two factors. First, as mentioned earlier, hurricane winds tend to be asymmetric, with strong winds remainingin the wake of the storm that are not included in the simulation. Second, thesimulation makes no provision for fresh water drainage. Despite these drawbacks theagreements in the maximum surge magnitudes and times (the two most importantfactors in storm surge prediction) between observed and simulated surges suggeststhat our Hurricane Charley storm surge simulation is sufficiently accurate. Theseresults find additional support in the Florida State Emergency Operations Centerwebsite (http://floridadisaster.org/eoc/Charley04.asp), which states that the highestsurge plus tide (and plus the steric sea level adjustment) was about 10–13 ft fromVanderbilt Beach (north of Naples) to the Lee County line. This agrees with oursimulated estimate there of about 250 cm, or about 8.5 ft. The difference may easilybe accounted for by wind wave run up not included in the model.Given the veracity of the simulation we can now use it to explain the breach ofNorth Captiva Island. Figure 8 shows model simulated sea level time series sampledon the gulf and sound sides of the location that was breached. As the hurricaneapproached and passed over this region we see an initially small depression of sealevel on both sides followed by a large (200 cm) depression on the gulf side. Withinan hour the sea level gradient across the island reversed such that the surge on thegulf side was 125 cm and the depression on the sound side was 90 cm. In total therewas a sea level difference of more than 200 cm across a very narrow low-lying stripof island. This allowed for flow across the barrier island driven by a very largehorizontal pressure gradient force. Once the breach began, sand transport then veryrapidly eroded the barrier island, resulting in the new, 450 m wide inlet (Fig. 1).
164FLORIDA SCIENTIST[VOL. 69DISCUSSION AND CONCLUSIONS—Having simulated the evolution of the HurricaneCharley storm surge and establishing some degree of credibility by comparing thesimulation with observations it remains to explain why the surge was relativelysmall given the category 4 nature of the hurricane. There are five reasons for this thatwe developed based on simulations of hypothetical hurricanes making landfall inthe Tampa Bay vicinity [Weisberg and Zheng (2006b), available at http://ocgweb.marine.usf.edu]. Using the same model strategy we considered the storm surges dueto category 2 and 4 hurricanes, approaching Tampa Bay from different directions, atdifferent speeds of approach, and making landfall at different locations. All of thesefactors are of importance to the evolution and magnitude of the surge. The point oflandfall is important since, with winds blowing counterclockwise around the hurricane eye, the surge by onshore-directed winds occurs to the south of the eye for thewest coast of Florida. North of the eye the winds are directed offshore and sea levelis depressed. The speed of approach is important since it takes a finite amount oftime to transport water from one point to another. Fast moving storms may yieldlesser surge than slow moving storms since there may not be sufficient time to fullyset up the sea surface slope that comprises the surge. The direction of approachenters in two ways. First, if the storm approaches from the south the affect ofoffshore-directed winds in advance of the eye initially sets sea level down. Hencewhen surge occurs it begins from a condition of depressed sea level. To the contrary,if the storm approaches from the north, sea level is set up directly. Hence surgemagnitude increases for the west coast of Florida as the angle of approach rotatesfrom southeast to northwest. Second, should the storm move up the axis of theestuary the tendency is to lower sea level on one side and raise sea level on the otherside, effecting a redistribution of water mass in the estuary, versus a net increase inwater mass. Finally, the physical dimension of the storm is also highly relevant.Large eye radii storms have large winds extending over larger areas than small eyeradii storms.All of these factors tended to mitigate storm surge for Hurricane Charley. Theeye radius collapsed to a very small value (less than 10 km) as it made landfall, thestorm approached from the southerly quadrant and proceeded directly up the axis ofthe Charlotte Harbor estuary, it moved very swiftly (about 18 kts), and it madelandfall to the south of the largest pass, namely Boca Grande Pass. Thus despite itscategory 4 status, the size, approach speed, approach direction and movement up theestuary axis, and point of landfall all led to the relatively small surge.In summary we applied a three-dimensional, high-resolution, finite-volumecoastal ocean model with flooding and drying capabilities (the FVCOM of Chen et al.,2003) to simulate the Hurricane Charley storm surge in the Charlotte Harbor vicinityand to account for the new inlet breach at North Captiva Island. The model wassupported by high-resolution, SFWMD bathymetry and topography data, and it wasdriven with prototypical hurricane wind and pressure distributions (Holland, 1980)using a NOAA NHC supplied storm track along with the eye radii, maximum windspeeds, and central pressures observed along the track. Comparisons with observeddata, after appropriate adjustments for astronomical tides referenced to NAVD83datum and seasonal steric effects, demonstrated the veracity of the simulation.
No. 00S2 2006]WEISBERG AND ZHENG—HURRICANE SURGE SIMULATION165A 450-m wide new inlet that was cut across the narrowest portion of NorthCaptiva Island was attributed to a sufficiently large gulf to sound directed sea levelgradient that set up as the eye transited the island to the north of the breach. The regionof largest storm surge (about 250 cm in our simulation and slightly larger than this inanecdotal emergency management narratives) occurred to the south of the CharlotteHarbor region near Ft. Myers Beach. The surge within the Charlotte Harbor estuarywas relatively small in view of Hurricane Charley’s category 4 status, and we attributedthis finding to the direction and speed of approach, the point of landfall to the south ofBoca Grande Pass, the translation of the hurricane up the estuary axis, and the compact eye radius. Despite this relatively small hurricane storm surge event (HurricaneCharley damage was primarily wind generated), we caution that the Charlotte Harborregion is highly susceptible to severe storm surge under other conditions. HadHurricane Charley approached more slowly, from a more westerly to northwesterlydirection and made landfall to the north of Boca Grande Pass with a larger eye radius,the storm surge would also have been catastrophic. These findings are based on simulations performed for prototypical category 2 and 4 storms conducted for the TampaBay region (Weisberg and Zheng, 2006b). Finally, while not included in these simulations wind waves also add to the storm surge and to the destructive power thereof.ACKNOWLEDGMENTS—Support was provided by the U.S. Geological Survey, requisition #4-20901478 and by the Office of Naval Research, grant #N00014-02-1-0972 and N00014-05-1-0483. A.Sallenger (USGS Center for Coastal Studies, St. Petersburg, FL) provided helpful discussions along withFigure 1. C. Chen (University of Massachusetts, Dartmouth) graciously shared the FVCOM code.T. Liebermann (South Florida Water Management District) provided the bathymetric and topographicdata. J. D
that year. Wind damage was severe for both the coastal and the inland communities that came under Charley's path. However, despite its Saffir-Simpson scale rating of category 4 the damage by storm surge was modest. Here we provide a simulation of the Hurricane Charley storm surge and explain, in view of the storm's strength, why