Transcription
contributed articlesHow to identify, instantiate, and evaluatedomain-specific design principles for creatingmore effective visualizations.by Maneesh Agrawala, Wilmot Li,and Floraine BerthouzozDesignPrinciplesfor VisualCommunicationdiagrams, sketches,charts, photographs, video, and animation isfundamental to the process of exploring conceptsand disseminating information. The most-effectivevisualizations capitalize on the human facility forprocessing visual information, thereby improvingcomprehension, memory, and inference. Suchvisualizations help analysts quickly find patternslurking within large data sets and help audiencesquickly understand complex ideas.Over the past two decades a number of books10,15,18,23have collected examples of effective visual displays.One thing is evident from inspecting them: the bestare carefully crafted by skilled human designers.Yet even with the aid of computers, hand-designingeffective visualizations is time-consuming andVisual commun i c atio n via60communi cations o f th e ac m April 2 0 1 1 vol . 5 4 no. 4requires considerable effort. Moreover, the rate at which people worldwide generate new data is growingexponentially year to year. Gantz et al.5estimated we collectively produced161 exabytes of new information in2006, and the compound growth ratebetween 2007 and 2011 would be 60%annually. We are thus expected to produce 1,800 exabytes of information in2011, 10 times more than the amountwe produced in 2006. Yet acquiringand storing this data is, by itself, oflittle value. We must understand it toproduce real value and use it to makedecisions.The problem is that human designers lack the time to hand-design effective visualizations for this wealth ofdata. Too often, data is either poorly visualized or not visualized at all. Eitherway, the results can be catastrophic;for example, Tufte24 explained howMorton Thiokol engineers failedto visually communicate the risksof launching the Challenger SpaceShuttle to NASA management in 1986,leading to the vehicle’s disasterousfailure. While Robison et al.20 arguedthe engineers must not be blamed forthe Challenger accident, better communication of the risks might haveprevented the disaster.Skilled visual designers manipulate the perception, cognition, andkey insights D esign principles connect the visualdesign of a visualization with theviewer’s perception and cognitionof the underlying information thevisualization is meant to convey. I dentifying and formulating gooddesign principles often requiresanalyzing the best hand-designedvisualizations, examining prior researchon the perception and cognition ofvisualizations, and, when necessary,conducting user studies into howvisual techniques affect perception andcognition. G iven a set of design rules andquantitative evaluation criteria, wecan use procedural techniques and/orenergy optimization to build automatedvisualization-design systems.Illustratio n by M ark S killicorndoi:10.1145/1924421.1924439
612a547142b181739151213811cred it t k16april 2 0 1 1 vol. 5 4 n o. 4 c o m m u n ic at i o n s of t he acm61
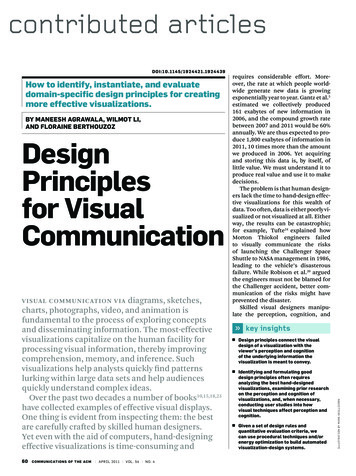
contributed articlescommunicative intent of visualizations by carefully applying principlesof good design. These principles explain how visual techniques can beused to either emphasize importantinformation or de-emphasize irrelevant details; for example, the mostimportant information in a subwaymap is the sequence of stops alongeach line and the transfer stops thatallow riders to change lines. Most subway passengers do not need to knowthe true geographic path of each line.Based on this insight, map designerHarry Beck redesigned the map of theLondon Underground in 1933 usingtwo main principles: straighteningthe subway lines and evenly spacingthe stops to visually emphasize thesequence of stops and transfer points(see Figure 1).Such design principles connect thevisual design of a visualization withthe viewer’s perception and cognitionof the underlying information the visualization is meant to convey. In thefield of design, there is a long-standingdebate regarding the interaction ofaesthetic and functional properties ofdesigned artifacts. We do not seek toengage in this debate here; rather, wefocus on how particular design choices affect the perception and cognitionof the visualization, not the aestheticstyle of the visualization. Accordingly,we use the term “design principle” asFigure 2. Hand-designed cutaway and exploded-view illustrations (left) design the cuts and explosions to emphasize the shape of the missinggeometry and spatial relationships among parts. Our system incorporates such principles to generate interactive cutaway and explodedview illustrations (middle, right).62communications o f th e acm April 2 0 1 1 vol . 5 4 no. 4Figure 1. H a rry Bec k Tfl f ro m t he Lond on T ransp ort M useum collect ionF igure 2. (lef t) St ephen Bi est y D orl ing Ki nd ersley; (righ t) LifeART imagesFigure 1. Harry Beck’s map of the London Underground from 1933. Beck straightened thelines and more evenly spaced the stops to visually emphasize the sequence of stops alongeach line.a shorthand for guidelines that helpimprove viewers’ comprehension ofvisually encoded information.Design principles are usually notstrict rules, but rules of thumb thatmight even oppose and contradictone another. For instance, Beck didnot completely straighten the subway lines; he included a few turns inthem to give viewers a sense of a line’soverall spatial layout. Skilled visualdesigners implicitly apply the relevantdesign principles and balance thetrade-offs between them in an iterative process of creating example designs, critiquing the examples, andimproving the designs based on thecritiques. Designers usually do notdirectly apply an explicitly defined setof design principles. The principlesare a form of tacit knowledge that designers learn by creating and studyingexamples. It is far more common forbooks on visual design to contain visual examples rather than explicit design principles.Many of the analysts and end usersinundated with data and charged withcreating visualizations are not traineddesigners. Thus, our work aims toidentify domain-specific design principles, instantiating them within automated visualization design systemsthat enable non-designers to createeffective visual displays. While otherresearchers have considered specificways to use cognitive design principles to generate visualizations (see theonline appendix) we have been developing a general, three-stage approachfor creating visualization design systems:
contributed articlesFigure 4. David Macaul ay, T he New Way T hings WorkStage 1. Identify design principles.We identify domain-specific designprinciples by analyzing the best handdesigned visualizations within a particular information domain. We connect this analysis with research onperception and cognition of visualizations;Stage 2. Instantiate design principles. We encode the design principlesinto algorithms and interfaces for creating visualizations; andStage 3. Evaluate design principles.We measure improvements in information processing, communication,and decision making that result fromour visualizations. These evaluationsalso serve to validate the design principles.We have used this three-stage approach to build automated visualization design systems in two domains:cartographic visualization and technical illustration. In the domain ofcartographic visualizations we havedeveloped automated algorithms forcreating route maps1,3,12 and touristmaps of cities.8 In the domain of technical illustration we have developedautomated techniques for generatingassembly instructions of furnitureand toys2,9 and for creating interactivecutaway and exploded-view illustrations of complex mechanical, mathematical, and biological objects.11,13,14,19Here, we focus on articulating thetechniques we have used to identifyand evaluate the design principlesfor each domain. These techniquesgeneralize to other domains, and applying our three-stage approach willresult in a better understanding of theFigure 3. Exploded views of complexmathematical surfaces are designedto reveal local geometric features (suchas symmetries, self-intersections, andcritical points).strategies people use to make inferences from visualizations.Stage 1. Identify Design PrinciplesDesign principles are prescriptiverules describing how visual techniques affect the perception and cognition of the information in a display.In some cases, they are explicitly outlined in books; for example, books onphotography techniques explain therules for composing pleasing photographs (such as cropping images ofpeople just below the shoulders ornear the waist, rather than at the neckor the knees). Researchers have directly applied them to build a varietyof automated photo-manipulation algorithms (see the online appendix forexamples).However, our experience is that design principles are rarely stated so explicitly. Thus, we have developed threestrategies for extracting and formulating domain-specific design principles:(1) analyze the best hand-designed visualizations in the domain, (2) examine prior research on the perceptionand cognition of visualizations, and,when necessary, (3) conduct new userstudies that investigate how visualtechniques affect perception and cognition.Hand-designed visualizations. Wehave found that a useful first step inidentifying design principles is toanalyze examples of the best visualizations in the domain. This analysisis designed to find similarities and recurring patterns in the kinds of information the visualizations highlight, aswell as the techniques used to emphasize the information.Consider the problem of depictingthe internal structure of complex mechanical, mathematical, anatomical,and architectural objects. Illustratorsoften use cutaways and exploded viewsto reveal such structure. They carefully choose the size and shape of cuts,as well as the placement of the partsrelative to one another, to expose andhighlight the internal structure andspatial relationships between parts.We have analyzed a large corpus of cutaways and exploded views to identifythe principles and conventions expertillustrators commonly use to generatethese images.11,13,14,19 Our process forFigure 4. Hand-designed “how things work” illustrations (a) use motion arrows and frame sequences to convey the motion and interactionsof the parts within a mechanical assembly. Our system analyzes a geometric model (b) of a mechanical assembly to infer the motion andinteractions of the parts, then generates the motion arrows and frame sequences (c–d) necessary to depict how the assembly works.april 2 0 1 1 vol. 5 4 n o. 4 c o m m u n i c at i o n s of t he acm63
contributed articlesidentifying these principles is basedon three main objectives:Style independence. In order toidentify a general set of principles wecould apply to a variety of complex3D objects, we looked for visual techniques common across different artistic styles and types of objects;Generative rules. To ensure that wecould apply the principles in a generative manner to create cutaways orexploded views, we formed explicit,well-defined rules describing whenand how each principle should be applied. We designed the rules to be asgeneral as possible while remainingconsistent with the evidence from theexample illustrations; andPerceptual/cognitive rationale. Wemotivated each principle by hypoth-esizing a perceptual or cognitive rationale explaining how the conventionhelps viewers better understand thestructure of the 3D object depicted.Through this analysis, we identified a set of general, perceptuallymotivated design principles for creating cutaways and exploded views. Forinstance, the size and shape of cutsin a cutaway illustration are often designed to not only reveal internal partsbut to help viewers mentally reconstruct any occluding geometry thathas been removed. Thus, illustratorscut radially symmetric objects withwedge-shape cutaways that emphasize the object’s cylindrical structure.Similarly, rectangular objects are cutwith object-aligned cutting planes,or box cuts; skin-like covering sur-Figure 6. A general-purpose computer-generated map of San Francisco (left) is notan effective destination map because it is cluttered with extraneous information andneighborhood roads disappear. Our destination map (right) includes only the relevanthighways, arterials, and residential roads required to reach a destination. The layout andrendering style further emphasize the information required to reach it.64communi cations o f th e acm April 2 0 1 1 vol . 5 4 no. 4faces are cut using window cuts; andlong tubular structures are cut usingtransverse tube cuts. Illustrations ofcomplex mathematical surfaces often use exploded views in which eachslice is positioned to reveal local geometric features (such as symmetries,self-intersections, and critical points).We have also examined “how thingswork” illustrations designed to showthe movement and interaction ofparts within a mechanical assembly.The hand-designed illustrations oftenuse diagrammatic motion arrows andsequences of frames to help viewersunderstand the causal chains of motion that transform a driving forceinto mechanical movement. Afteridentifying the design principles, weimplemented them algorithmicallywithin interactive systems for generating cutaways, exploded views, andhow-things-work illustrations (seeFigures 2, 3, and 4).We applied a similar approach toidentify the design principles for depicting route maps that provide directions from one location to another1,3and destination maps that show multiple routes from all around a region toa single location (such as an airport ora popular restaurant).12 We analyzed avariety of such hand-drawn maps andfound they are often far more usefulthan computer-generated driving directions (available at sites like maps.bing.com and maps.google.com) because they emphasize roads, turningpoints, and local landmarks. Thesehand-designed maps significantly distort the distance, angle, and shape ofroads while eliminating many detailsthat would only serve to clutter theFigure 5. M apPoint screensh ot rep rinted wit h p ermissio n of Microsof t Corp.F igure 6. Google M apsFigure 5. A computer-generated route map rendered at a fixed scale does not depict (left) all the turns necessary for navigation. A handdesigned map (middle) emphasizes the turning points by exaggerating the lengths of short roads and simplifying the shape of roads. OurLineDrive system incorporates these design principles (right) into an automated map-design algorithm.
contributed articlesFigure 7. Unique M ediamap. Tufte23 pointed out that triptiksand subway maps similarly distortthe shape of routes and eliminateunnecessary detail. Hand-designeddestination maps include only themajor routes to a location rather thanall possible routes. These maps progressively increase the level of detail,showing only the highways far fromthe destination while including arterial roads and finally the residentialroads near the destination. Both routeand destination maps typically usemulti-perspective rendering in whichthe roads are drawn in top-down planview while important landmark buildings are drawn from a side view sotheir facades are visible.Although analyzing hand-designedvisualizations is often a good initialapproach for identifying design principles, this strategy also involves limitations. In some cases it may be tempting to form generative rules that aretoo specific and do not apply outsidethe range of analyzed examples. Inother cases the rules may be so generalit is unclear how to apply them to specific examples. Such difficulties oftenarise when the perceptual or cognitiverationale behind a particular visualtechnique is not clear. In the contextof route maps, for example, althoughour analysis revealed that mapmakersoften distort road length, angle, andshape, it was not immediately clearhow such distortions improved the perception and cognition of route maps.Similarly, we have found that oneof the challenges in analyzing handdesigned visualizations is to factorout differences due to artistic style.Designers may choose visual attributes (such as font type, color palette,and line width) for aesthetic reasonswhereby one font may simply looknicer than another to the designer. Although such aesthetic design choicesare important considerations, thegoal of our analysis is to determinehow the design choices improve theperception and cognition of the information, rather than how these choicesimprove aesthetics. The difficulty isthat these design choices often affectboth the aesthetics of the display andthe perception and cognition of theinformation; how to separate the twoeffects is not always clear.In light of these limitations andchallenges, we have found it is oftenuseful to connect our observationsand hypotheses from the analysis ofhand-designed examples with relevantwork from perception and cognitivepsychology. These connections serveto clarify the perceptual or cognitiverationale for the design principles.Prior work in perception and cognition. In some cases, prior researchin perception and cognition suggestsor formalizes the appropriate designprinciples; for example, cognitive psychologists have shown that peoplethink of routes as a sequence of turns25and that when following a route theexact length of a road is far less important than properly executing the turns.The topology of the route is more important than its absolute geometry.This insight helps explain why handdrawn maps often distort geometry—distance, angle, and shape of roads—to ensure that all roads and turningpoints are visible, but almost nevermodify the topology of the route.In this case, the prior research confirmed and formalized the perceptual/cognitive rationale for the visual techniques we first noticed when analyzing hand-drawn route maps. Based onthe resulting design principles, we developed LineDrive (http://vis.berkeley.edu/LineDrive), a fully automated system for rendering route maps in thestyle of hand-drawn maps.3 LineDrivehas been publicly accessible since October 2000, and surveys have shownthat for navigation tasks users strongly prefer LineDrive maps to computergenerated maps drawn at a fixed scale(see Figure 5).Researchers have also found thatnavigators familiar with a geographicarea (such as cab drivers) plan routeshierarchically.4 They first select thehighways necessary to get close to thedestination, then the arteries, and finally the residential streets. Such hierarchical planning corresponds tothe progressive increase in road detailwe first identified in hand-designeddestination maps. We recently applied this level-of-detail principle inconjunction with the distortion principles to build an automated systemfor generating destination maps.12 Asin LineDrive, we produced a map thatlooks hand-drawn but that eliminatesclutter while preserving the information necessary for anyone in thesurrounding region to reach the destination. Our destination maps areFigure 7. A hand-designed tourist map of San Francisco emphasizes semantically, visually, and structurally important landmarks, paths,districts, nodes, and edges, using multi-perspective rendering to ensure the facades of buildings are visible (left). Our tourist-map designsystem is based on these principles and similarly emphasizes the information most important for tourists in this map of San Francisco (right).april 2 0 1 1 vol. 5 4 n o. 4 c o m m u n ic at i o n s of t he acm65
contributed articlesavailable through the Bing Maps Website (http://vis.berkeley.edu/DestMap)(see Figure 6).We applied a similar approach toautomatically generating maps fortourists visiting a new city.8 Prior workon mental representations of cities16showed that people consider five mainelements: landmarks, paths, districts,nodes, and edges. However, a mapwith every instance of such elementswould be cluttered with excessive detail. The most-effective tourist mapsinclude only those elements that aresemantically meaningful (such as thehome of a well-known writer), visuallydistinctive (such as an oddly shapedor colored building), or placed in astructurally important location (suchas a building at a prominent intersection).22 After choosing the elements toinclude in the map, mapmakers usually apply a variety of cartographicgeneralization techniques, includingsimplification, displacement, deformation, and selection. Cognitive psychologists and cartographers studying the cognition of maps have shownsuch generalizations improve claritybecause they emphasize the most important map elements while preserving spatial relationships betweenthese elements.17Our tourist-map-design system isbased on these design principles. Input consists of a geometric model of acity, including streets, bodies of water,parks, and buildings (with textures).The system automatically determinesthe importance of map elements us-ing top-down Web-based informationextraction techniques to computesemantic importance and bottom-upvision-based image/geometry analysis to compute visual and structuralimportance. It then generates a mapthat emphasizes the most importantmap elements, using a combinationof multi-perspective rendering andcartographic generalization to highlight the important landmarks, paths,districts, nodes, and edges while deemphasizing less-important elements(see Figure 7).Experiments on perception andcognition. In some domains, new perception and cognition research is required to provide the rationale for thedesign principles. Working with cognitive psychologist Barbara Tversky,we developed a methodology for conducting human-subject experimentsto understand how people think aboutand communicate the informationwithin a domain. We first applied thismethodology to identify the designprinciples for creating assembly instructions for everyday objects (suchas furniture and toys).2,9 The experiments are conducted in three phases:Production. Participants create visualizations for a given domain. Inthe context of assembly instructions,they assembled a TV stand without instructions using only a photograph ofthe assembled stand as a guide. Theythen drew a set of instructions showing how to assemble it;Preference. Participants rate the effectiveness of the visualizations. Inthe assembly-instructions project, anew set of participants assembled theTV stand, without instructions. Theythen rated the quality of the instructions created by the first set of participants, redrawn to control for clarity,legibility, and aesthetics; andComprehension. Participants usethe ranked visualizations, and we testfor improvements in learning, comprehension, and decision making. Inthe assembly-instructions project, yetanother set of participants assembledthe TV stand, this time using the instructions rated in the preferencephase. Tests showed the highly ratedinstructions were easier to use andfollow; participants spent less timeassembling the TV stand and madefewer errors.Following these experiments, welook for commonalities in the highlyrated visualizations to identify thedesign principles. In the context ofassembly instructions, we identifiedthree main principles: (1) use a stepby-step sequence of diagrams showing one primary action in each diagram; (2) use guidelines and arrows todepict the actions required to fit partstogether; and (3) ensure that the partsadded in each step are visible. Our automated assembly-instruction-designsystem is based on these principles(see Figure 8). Tversky and Lee25 havestudied mental representations ofmaps using a similar methodology,where subjects first draw maps to familiar locations, then other subjectsrate the effectiveness of the maps.Figure 8. We asked subjects to assemble a TV stand and then create instructions for a novice explaining how to assemble it (left, middle).Analyzing hand-drawn instructions, we found that diagrammatic, step-by-step instructions using guidelines and arrows to indicate theactions required for assembly and providing good visibility for the attached parts are easiest to use and follow. Our system automaticallygenerates assembly instructions (right) based on these principles.66communi cations o f th e acm April 2 0 1 1 vol . 5 4 no. 4
contributed articlesStage 2. InstantiateDesign PrinciplesDesigning a visualization usually requires choosing visual properties orattributes for each element in thedisplay; for example, to create a routemap, the designer must choose attributes, including position, size, andorientation for each road, landmark,and label that appears in the map.Similarly, to create a cutaway illustration, the designer must choose howand where to cut each structure thatoccludes the target part. Because thereare many possible choices for each attribute, the design space of possiblevisualizations is usually quite large. Tobuild automated visualization designsystems, we treat the relevant designprinciples as guidelines for makingthese design decisions. The principleshelp us navigate through the designspace and obtain an effective design.Most design principles are statedas qualitative guidelines, rather thanas procedures we can directly instantiate in an automated design algorithm. The challenge is to transformsuch high-level principles into implementable algorithms.Design principles generally fallinto two categories: design rules andevaluation criteria. Design rules separate the design space into regions containing effective designs and thosecontaining inviable designs. They areessentially hard constraints in the design space. In creating route maps, forexample, designers commonly adjustthe turn angle to emphasize the orientation of the turn, to the left or tothe right. However, adjusting the turnangle so much that a left turn appearsto be a right turn or vice versa is unacceptable. This design rule puts a hardconstraint on how much designers areable to adjust the turn angle.Evaluation criteria quantify theeffectiveness of some aspect of thevisualization. We can assess the overall effectiveness of a visualization byconsidering a set of evaluation criteria covering all major aspects of thevisual design. In creating an explodedview, for instance, designers must balance two such criteria: part separationand compactness. A good explodedview separates the parts so all of themare visible, yet the visualization mustalso remain compact and maintain aThese principlesexplain howvisual techniquescan be used toeither emphasizeimportantinformation orde-emphasizeirrelevant detailsin the display.roughly square aspect ratio to makethe best use of available screen space.To quantify the overall effectivenessof an exploded view we measure thevisibility of each part, as well as thecompactness of the overall visualization. Similarly, in designing routemaps, designers must ensure that allroads are visible. To quantify this criterion, we compute the length of eachroad in the map and check the lengthis greater than some minimum visibility threshold. The number of roadslonger than the threshold length is aquantitative measure of the effectiveness of the map with respect to thiscriterion.Given a set of design rules andquantitative evaluation criteria, wecan use procedural techniques tobuild an automated visualization design system; for example, our systemfor designing cutaways and explodedviews is driven exclusively by procedural techniques. In this case, we encode the design rules as a decisiontree describing how to cut or explodeaway occluding parts based on theirgeometry. Another approach is to consider visualization design as an energy-minimizing optimization problem.In this case, we treat the design rulesas hard constraints that define theboundaries of the design space andthe evaluation criteria as soft constraints that guide the system to theoptimal visualization. While this optimization-based approach is general,we have found it essential to develop aset of design rules and evaluation criteria that sufficiently limit the designspace so it is feasible to complete theoptimization. Both LineDrive and ourassembly-instruction design systemuse such an energy-minimizing optimization.Stage 3. Evaluate Design PrinciplesThe final stage of our approach is tomeasure the usefulness of the visualizations produced by our automateddesign systems. We consider severalsuch measures, including feedbackfrom users in the form of qualitativeinterviews and quantitative usage statistics. In some cases, we have alsoconducted more-formal user studiesto check how well the visualizationsimprove information processing, communication, and decision making.april 2 0 1 1 vol. 5 4 n o. 4 c o m m u n ic at i o n s of t he acm67
contributed articlesUser feedback. We find it is criticalto involve users early on and conductqualitative interviews and surveys tocheck their overall impressions of thevisualizations produced by our systems. Such feedback is essential foridentifying problems and ensuringour design principles and the visualizations converge on effective designs.The interviews and surveys providehigh-level checks of the effectivenessof our design principles and allow usto tweak the principles when not quiteright; for example, early on buildingLineDrive, we asked users to rate handcrafted prototype route-map designs,finding that 79 out of 90 respondentspreferred the distorted LineDrive prototypes to maps drawn to scale1 andconfirming that users thought the distorted maps were useful. Continualfeedback and evaluation yields moreeffective algorithms and tools.Another approach is to release thevisualization on the Web, then checkusage statistics; for example, at itspeak, LineDrive was serving more than750,000 maps per day and became thedefault route-mapping style for MapBlast, an early Web-based provider ofroute maps. Such public feedback isa strong test of effectiveness, as ineffective solutions are quickly rejected.We also recognize that u
Design Principles for Visual Communication key insights Design principles connect the visual design of a visualization with the viewer’s perception and cognition of the underlying information the visualization is meant to convey. i dentifying and formulating good design p