Transcription
Map Intelligence Client – User Manualiii
Map Intelligence Client – User Manualii
CONTENTSINTRODUCTION . 5Purpose .5Audience.5Conventions .6Prerequisites .6CONCEPTS. 7What is Map Intelligence?.7The Map Intelligence Client for QlikView .7The Map Intelligence Server and Browser Mapping Viewer .7What is a Layer? .8Layer Types .9What is a Mapping Viewer? .11EMBED MAPPING VIEWER TO THE QLIKVIEW DOCUMENT . 12Accessing the MI Client Configuration .22MI CLIENT CONFIGURATION SCREENS . 24Overview .24Configuration Screens .24Configuration Screen Main Menu .24Global Settings .25Map Intelligence Layers .33Overview .33Layer Directory .33Configure Point Layers .33Configure Relationship Layers .54Configure Area Group Layers .91Logging Off and Ending BI Session .125Selection .126ADVANCED TOPICS . 128Auto Pilot Mode .128Independent Maps and Legends .128TROUBLESHOOTING . 132Client Login Issues .132Client Connection Issues.132Global Settings Issues . Error! Bookmark not defined.Layer Issues .133Map Intelligence Client – User Manualiii
Map Rendering Issues .133APPENDICES . 134Appendix A: Client Methods.134Appendix B: Features Rendering Attributes .136Appendix C: Using the Unshaded and Transparent Color Options .140Region Relationship and Area Group Layers .140Radius Relationship Layers .142Appendix D: Module Code .144Appendix E: Client Properties .148GLOSSARY . 152Map Intelligence Client – User Manualiv
INTRODUCTIONPURPOSEThis manual provides information about the Map Intelligence Client for QlikView (MI Client for QlikView). Itexplains the MI Client for QlikView features and options and contains the concepts, processes, procedures andexamples that you need to use this software.AUDIENCEThe effective use of Map Intelligence involves a number of separate processes which can be performed by differentuser groups. The user groups involved are described below.LAYER DESIGNERSLayer designers are responsible for configuring the Map Intelligence Map Intelligence layers that are displayed onthe Mapping Viewer. Layer Designers are also responsible for configuring the settings for the Map IntelligenceServer as well as the properties of the underlying map to be used for the analysis. This user group should have afirm understanding of the spatial analysis required.Layer designers are advised to read all sections of this manual.END USERSEnd Users are users who want to view the configured layers on a map. Their roles include launching the MappingViewer to generate spatial representations of the data.End Users are advised to read the separate Mapping Viewer User Manual.SERVER ADMINISTRATORSAnother type of user exists that is responsible for the installation and management of the Map Intelligence Server.These users should be familiar with the organization’s mapping server (hereinafter referred to as GIS Provider).Server Administrators are advised to read the separate Server Installation Guide and the Server and AdministrationTools.Map Intelligence Client – User Manual5
CONVENTIONSThe following table shows the conventions that are used in this document.ItemMeaningAn arrow indicates the beginning of procedures consisting of sequential steps orone-step procedures. In examples, indicate that the enclosed elements are optional or they areinstances of code to be replaced by the user with applicable information.BoldBold in procedural steps highlights user interface elements on which the user mustperform actions.Example textCourier font indicates that the example test is code or syntax.Courier italicsCourier italic text indicates a variable field in command syntax. Substitute a value inplace of the variable shown in Courier italics.n,xItalic n stands for a variable number; italic x can stand for a variable number or aletter.Mouse OrientationThis document provides examples and procedures using a right-handed mouse. Ifyou use a left-handed mouse, adjust the procedures accordingly.The Note icon indicates additional information relating to the topic.The Tip icon suggests an alternative or shortcut procedure.PREREQUISITESPlease refer to your MI Client for QlikView Installation Guide for a comprehensive list of prerequisitesIn addition to the MI Client for QlikView Prerequisites, the Map Intelligence Server needs to be installed andconfigured in order to make the relevant maps, colors and images available for your analysis. The Map IntelligenceServer requires that a suitable mapping server be installed. The installation of the Map Intelligence Server andmapping server are beyond the scope of this manual.For instructions on how to install and configure the Map Server refer to the Map Intelligence ServerInstallation Guide and the Map Intelligence Server and Administration Tools Guide.Map Intelligence Client – User Manual6
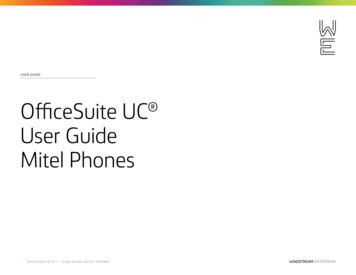
CONCEPTSWHAT IS MAP INTELLIGENCE?Map Intelligence extends the "no programming" paradigm into mapping and merges location and spatial analyticsinto enterprise decision support and Business Intelligence applications.Map Intelligence enables bi-directional analysis between data visualized on maps and other more traditionalrepresentations such as tables of data, charts and reports. In this environment a user can easily discover previouslyhidden information and data relationships.Map Intelligence reduces the time needed to develop the applications from weeks and months to days and hours.In many cases organizations have given up before solving the technical challenges that Map Intelligence solves.Using web services from the vast range of online, statistical and business information, an organization’s in-housedata can be quickly, easily and dynamically augmented and enriched with geographical and satellite imagery.Available services include census, demographic and health data, climatic, hydrological and geological data.Map Intelligence has two principal components:THE MAP INTELLIGENCE CLIENT FOR QLIKVIEWThe Map Intelligence Client for QlikView includes a number of configuration screens that enable you to design yourmapping application. Using the MI Client for QlikView you select the underlying map you want to use, specify the‘look and feel’ and build the different Map Intelligence layers to be used in your analysis (see Layer Types). Oncethis has been done, your application is finished and in operation the MI Client sends a request to the MapIntelligence Server to display your application in a web browser.THE MAP INTELLIGENCE SERVER AND BROWSER MAPPING VIEWERThe Map Intelligence Server is the powerhouse behind the mapping application you designed using the Client. Itprocesses all the information sent from the Client to produce your application which you view and interact with inthe browser Mapping Viewer (see What is a Mapping Viewer?). The Map Intelligence Server is supplied with anumber of administration tools that include license administration, global default settings for the ‘look and feel’and customization of various applications features such as pop-ups.Map Intelligence Client – User Manual7
Figure 1. The Map Intelligence Platform.WHAT IS A LAYER?Maps are built with layers. Each layer holds characteristics that may be of interest to End Users. Layers containfeatures of the map such as streets, parks, postal districts, cities, radio towers, rivers and so on. Each map layer sitson top of another layer, e.g. a country layer may sit all the way at the bottom with street layers sitting right at thetop.Layers can also be created dynamically from data found in external sources. Map Intelligence is capable ofgenerating a variety of layer types to aid analysis.In this manual, layers that reside as part of the mapping environment are referred to as built-in layers. Layerscreated dynamically from external data sources including your report data are known as Map Intelligence layers.Map Intelligence Client – User Manual8
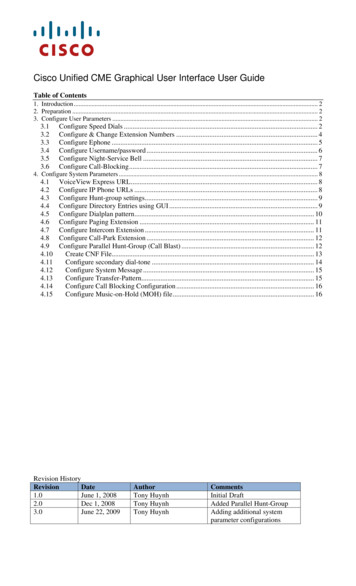
LAYER TYPESThe following layers can be created and configured using Map Intelligence:POINT LAYERSPoint Layers are map layers where data is represented onthe map as discrete point images or symbols. For example:a particular layer might represent the location of stores aspush-pin icons and another layer could represent accidentsas colored dots, where the color (theme) represents theseverity of the accident. Typically, the rows in a table ofdata belong to a business concept such as people oraddress details, where each column is an attribute of thatconcept. Thus each row in your business data can berepresented as an individual point in a point layer. In MapIntelligence, point layers form the foundation forrelationship layers.Figure 2: The Mapping Viewer displaying a Point layer. Thepoints, represented by colored circles, indicate thelocation of fast food outlets in the Sydney area.RELATIONSHIP LAYERSRadius relationship layers are circular regions with themesaround certain points of interest that show informationabout other points which fall within that circular region.These layers are generated by Map Intelligence. They arebased on calculations made by Map Intelligence on thespecified data values as defined by the Layer Designer. Forexample: different colored circles indicate the averagehouse price within half a kilometer of a proposed wasteplant. Another example is where different colored circlesindicate the number of burglaries that have occurred withina five-mile distance of houses belonging to known burglars.In the current version of Map Intelligence, the circle centerpoints (e.g. houses belonging to known burglars) and thedata being analyzed (burglaries), must be point layers.Map Intelligence Client – User ManualFigure 3: The Mapping Viewer displaying a RadiusRelationship layer. The small blue circles representgyms. Around each gym is a 2km radius colored accordingto the number of fast food outlets offering a low fat menu.Yellow Circles indicate there are more than 5 outlets,orange circles between 1 and 5 and red circles indicatethere are no outlets.9
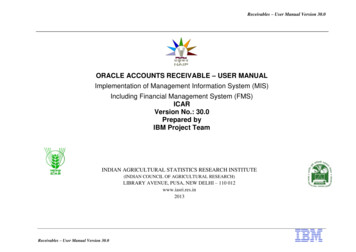
Region Relationship layers corresponds to a map area ofany shape that is solely geographical in its definition, and isnot generated by Map Intelligence. Examples would besuburbs, zip / postal codes, local government areas, orpolice precincts. Region Relationship layers can be giventhemes according to specified data rules associated withthe points that fall within that region. An example of such atheme could be color-coding precincts according to thenumber of crimes that have taken place within theirboundaries, or applying different hatches to suburbs basedon the total value of house sales that have occurred in eachone. Map Intelligence works out in which region a point(e.g. a sale or an accident) physically belongs to by doing aspatial calculation.Figure 4: The Mapping Viewer displaying a RegionRelationship layer. Local Government Areas of Sydney arecolor-coded according to the most common type of fastfood outlets in each area. Yellow areas show chickenoutlets are the most common, red areas burger and blueareas pizza.AREA GROUP LAYERArea Group layers also correspond to existing areas on amap. As for Region Relationship layers, the displayed themeis based on data attribute values, but in this case no spatialcalculation is required. Instead, a column in your businessdata is designated to have values that match a column inthe map data. For example, an existing map layer ofsuburbs may correspond to a data column for suburbswhere the values are the suburb names. Then, fortransaction data that represents customer complaints andthat also contains a suburb column, it is possible to make across-reference between the transaction and the map areausing the suburb name. An example that would use thiscorrelation is displaying a theme on a suburb’s area on themap that reflects the most common complaint typereceived from that suburb.Figure 5: The Mapping Viewer displaying an Area Grouplayer. The Local Government Areas of Sydney have beencolor-coded according to the average household income.The darker the area the higher the income.Like built-in map layers, Map Intelligence layers also have a specific order in which they are placed on the map.Point layers are placed on top of Radius Relationship layers, which in turn sit on top of the built-in map layers.Region Relationship and Area Group layers shade existing built-in layers.Map Intelligence Client – User Manual10
WHAT IS A MAPPING VIEWER?The Mapping Viewer displays the configured Map Intelligence layers overlaid on a specified map. The MappingViewer also provides a number of controls and features that allow you to navigate around the map or to changethe theme displayed on the map. A number of tools are also available from the Mapping Viewer that allow you toperform high-level analysis.Map Intelligence Client – User Manual11
EMBED MAPPING VIEWER TO THE QLIKVIEW DOCUMENTThis section will guide you in embedding a map to the QlikView document using the MI Client Map Viewerextension object.To embed the Mapping Viewer using MI Client Map Viewer1.Check if the MI Client Map Viewer is installed on the QlikView Server (see page 28 of the MI Client for QlikView11 SR2 Installation Guide for the detailed steps).2.Open the QlikView document where you will be embedding the map.3.In the QlikView Desktop, under the menu click View then Turn on/off WebView to activate the Web View.Figure 6. View menu dialog - Turn on/off WebView4.Right click on the document sheet then New Sheet Object. The New Sheet Object dialog displays.Map Intelligence Client – User Manual12
Figure 7. Right click dialog- New Sheet ObjectFigure 8. New Sheet Object dialog- MI Client Map Viewer5.Drag the MI Client Map Viewer the drop it to target Sheet content of the QlikView document.Map Intelligence Client – User Manual13
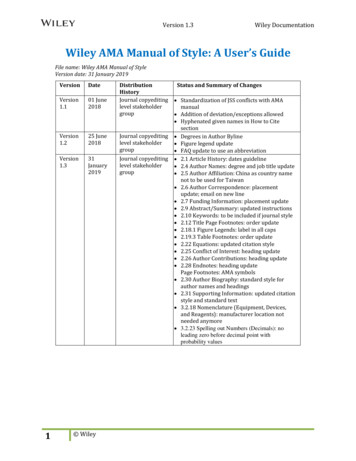
Figure 9. MI Client Map Viewer.6.Right click on the MI Client Map Viewer then Properties. Change the value of Report Server to the QlikViewServer address.Figure 10. MI Client Map Viewer - Properties dialog.7.Turn off the Web View then save the document.8.Configure the get map filter button that allows filtering data while the map is rendered.a.Create a new button.b.On the New Button property box, set the following properties: 9.Text area in the General tab : Get map filter or as preferredActions tab:o Action Type : Externalo Action : Run Macroo Macro Name : qvMapSelectionc.Click OK button to save and close.d.Save the document and proceed to write the code.Write the QlikView Document codea.Go to Tools Edit Module. The Edit Module code editor displays.Map Intelligence Client – User Manual14
Figure 11. Tools menu dialog - Edit Moduleb.Copy and paste the QlikView Client code(see Appendix D) on the editor.Figure 12. Edit Module code editor c.Change the value of gMIClient constant to the location of MI Client for QlikView(i.e. http:// MIClient machine hostname or IP address : port http://miclientserver:9050)Replace the value of the gReportServer to the QlikView Server hostname or IP addressOn the Requested Module Security, select the System Access option.On the Current Local Security, select the Allow System Access option.The QV Client code is also installed as part of the MI Client for QlikView in
Server as well as the properties of the underlying map to be used for the analysis. This user group should have a . Using the MI Client for QlikView you select the underlying map you want to use, specify the . house price within half a