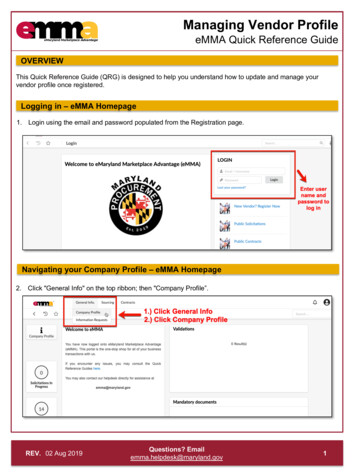
Transcription
Vendor Performance SummaryA summary of the headline results forQlikView
Table of contentsIntroduction .3About BARC .3The Analyst Verdict – QlikView April 2020 .4Product characterization. 4Vendor . 4Strategy . 4Architecture . 5Front-end functionality . 6Overall product scores . 8The Customer Verdict – QlikView.9User and use case demographics . 9Peer groups . 10The KPIs . 10Why organizations buy QlikView . 11Problems encountered by QlikView users . 12KPI results for QlikView in the ‘Dashboarding-focused products’ peer group . 13KPI results for QlikView in the ‘Self-service analytics-focused products’ peer group . 14KPI results for QlikView in the ‘Large international BI vendors’ peer group . 15Customer feedback summary for QlikView . 16Customer quotes for QlikView . 18QlikView in The BI & Analytics Survey 21-2-
IntroductionThis report is split into two main sections – The Analyst Verdict and The Customer Verdict - to give thereader a balanced overview of the product’s capabilities, strengths and weaknesses from both acustomer and analyst point of view.The first section - The Analyst Verdict - is a product evaluation and vendor assessment reflecting theopinion of BARC’s team of experienced BI analysts. It provides detail on the vendor and its strategy, aswell as the technical and functional capabilities of the software.The Customer Verdict is based on the results of The BI & Analytics Survey 21, the world's largest andmost comprehensive survey of business intelligence end users, conducted in the spring and summer of2020. In total, 2,591 people responded to the survey with 2,136 answering a series of detailed questionsabout their use of a named product. Altogether, 33 products (or groups of products) are analyzed indetail.The BI & Analytics Survey 21 offers an unrivalled level of customer feedback on issues ranging from thepurchase cycle right through to deployment. Products are assessed and compared across a broad rangeof 36 criteria (KPIs) - including critical measures such as business value, customer satisfaction,customer experience and competitiveness. The extent of adoption of a variety of trending technologies- including mobile BI, embedded BI and cloud BI – is also measured.About BARCBARC is a leading enterprise software industry analyst and consulting firm delivering information to morethan 1,000 customers each year. Major companies, government agencies and financial institutions relyon BARC’s expertise in software selection, consulting and IT strategy projects.For over twenty years, BARC has specialized in core research areas including Data Management (DM),Business Intelligence (BI), Customer Relationship Management (CRM) and Enterprise ContentManagement (ECM).BARC’s expertise is underpinned by a continuous program of market research, analysis and a series ofproduct comparison studies to maintain a detailed and up-to-date understanding of the most importantsoftware vendors and products, as well as the latest market trends and developments.BARC research focuses on helping companies find the right software solutions to align with theirbusiness goals. It includes evaluations of the leading vendors and products using methodologies thatenable our clients to easily draw comparisons and reach a software selection decision with confidence.BARC also publishes insights into market trends and developments and dispenses proven best practiceadvice.BARC consulting can help you find the most reliable and cost-effective products to meet your specificrequirements, guaranteeing a fast return on your investment. Neutrality and competency are the twocornerstones of BARC’s approach to consulting. BARC also offers technical architecture reviews andcoaching and advice on developing a software strategy for your organization, as well as helping softwarevendors with their product and market strategy.QlikView in The BI & Analytics Survey 21-3-
The Analyst Verdict – QlikView April 2020Product characterizationQlikView is a dashboard and ‘associative’ analysis product based on in-memory technology. Qlik wasan early mover in visual analytics and data discovery with QlikView. It is positioned as a solution forbuilding guided analytic apps targeted at business users, enabling them to analyze data withoutrequiring developer support for a new dashboard or report.Analyst Verdict – QlikView April 2020VendorVendor ployees2,000 Customers48,000Revenues (2019)Not disclosedQlik, originally founded in 1993 in Lund, Sweden, moved its headquarters to the United States in 2005after raising funds from several venture capital firms. QlikView, the company’s only product at the time,was very aggressively marketed after the VC investment. This created attention and traction, and in2010 Qlik went public on NASDAQ. In 2016, Qlik was acquired by a private equity company and delistedfrom the stock exchange.Qlik was a one-product company until the general availability of Qlik Sense in 2014. Today, the vendorprovides a portfolio of data management and analytics offerings. With this stack, Qlik focuses on helpingcustomers manage their data, providing analytics to analyze the data and features to transport insightsto end users. This product review describes QlikView.StrategyThe vendor pursues a platform approach which aims to empower data usage by providing a platform forall visual analytics needs and helping to find innovative ideas by navigating data using an ‘associative’model. Qlik’s front-end products use a common data engine called QIX (Qlik Indexing Engine).Qlik’s platform consists of several components including Qlik Sense, Qlik Core for developers, QlikViewand Qlik NPrinting, for enhanced printing and page-based layout. Qlik DataMarket is a marketplace forsourcing external data for analyses such as weather and currency information. In 2017 Qlik acquiredIdevio, now called Qlik GeoAnalytics, to provide enhanced spatial analysis. The vendor has alsostrengthened its data management offering. Qlik Data Catalyst, formerly Podium Data, was acquired tobroaden its feature set for data preparation and data catalogs. This was followed in 2019 by theacquisition of Attunity, a real-time data integration specialist.The vendor’s main front-end products are Qlik Sense and QlikView. QlikView was the vendor’s firstanalytics product and the tool it became famous with. It is a dashboard and analysis product thatQlikView in The BI & Analytics Survey 21-4-
Analyst Verdict – QlikView April 2020pioneered in-memory technology in BI to deliver exceptional performance for highly responsive analysesand interactive dashboards. It was the first tool marketed under the “data discovery” and “modern BI”terms to differentiate it from traditional BI suites. The solution was positioned as a self-service platformtargeted at business users, enabling them to analyze data without having to consult developers for newreports, dashboards or analyses on new data. Qlik Sense is a visual analysis and dashboarding productproviding immediate analysis results to users. It is powered by QIX and gives flexible access to datasets stored in memory. Based on the in-memory and ease-of-use heritage of QlikView, Qlik Sense ispositioned as the strategic offering for new customers for most use cases. However, at least oneQlikView release per year with product improvements ranging from technical to integration in its ownportfolio will be provided. Qlik NPrinting is a report generation, distribution and scheduling applicationwhich can be used to compile page-oriented reports based on Qlik Sense or QlikView content.The “land & expand” sales strategy and the business-user-oriented messaging are a decisive part ofQlik’s success. Its visual analytics products are clearly designed to appeal to business users, who canachieve results without waiting for assistance from IT. Qlik consistently emphasizes ease of use, rapiddeployment, integration and high performance over more complex technical, architectural andadministrative strengths.Qlik addresses accounts of all sizes: from small business to enterprise standard deployments in largeaccounts. Nevertheless, a clear shift towards larger buying companies can be observed. The vendorhas an extensive partner channel and it addresses mid-market accounts largely through these partners.Qlik has a web-based program for direct sales to small companies and addresses the large enterprisemarket jointly with large consultancy companies.ArchitectureQlikView was originally developed as a desktop solution with a Windows client (QlikView Desktop). Itcan still be used this way, and often is, but Qlik has moved away from the desktop to a web-basedarchitecture (QlikView Server). QlikView applications (“apps”) can be hosted on the web as guided apps(e.g., dashboards or analytical applications) or delivered as complete apps with the data to users whouse the local client to access server-based apps. The QlikView Publisher component is used to handledata reloads and the distribution of QlikView apps to users. Qlik NPrinting provides centralized reportcreation and distribution using data and visualizations from QlikView. The Qlik DataMarket offers dataas-a-service capabilities to facilitate the use of trusted external data.QlikView apps contain both data and interactive visualizations, delivered in a single file. The tool offerstwo main clients: a Windows client and a web client. QlikView Desktop is used for data preparation(extract, transform, load) as well as for building applications. The web client is more restricted in termsof development compared to QlikView Desktop, but there is also some flexibility for business users tomodify the apps and share changes with colleagues. In addition, QlikView provides an HTML5 mobileclient for accessing applications from mobile devices, as well as a native iOS app for iPad that wrapsthe HTML5 mobile client (a so-called hybrid app) and enables users to create views of data to takeoffline.Data extraction, transformation and loading (ETL) processes with QlikView are usually done using aproprietary scripting language. Qlik Sense is more user-friendly in this regard, with profiling and wizardsfor simpler data integration tasks, but complex transformation tasks still require scripting. These tasksare complemented by wizard interfaces and carried out in QlikView Desktop by IT or trained powerusers. Although integration is still ongoing, Attunity can be used for additional data integration andmanagement tasks. Attunity products have been rebranded with new names such as Qlik Replicate,Qlik Compose and Qlik Enterprise Manager.QlikView in The BI & Analytics Survey 21-5-
Analyst Verdict – QlikView April 2020In QlikView, loaded data is automatically de-normalized, removing the complexity that normalizationusually brings with it. The product adds most value when it comes to disjointed data, because it links upthe data logically with reduced manual effort based on common field names and new data profilingfeatures. Data is stored in a set of tables, which are connected by single columns with the same name.It is then compressed for efficiency and loaded into memory. For data sets too large to fit in-memory,QlikView offers a hybrid approach using a capability called Direct Discovery. This allows some dataelements to not be loaded into the QlikView data model, but still be available for query purposes.The data, the associative data model and visualizations are stored in QVW files in QlikView. In addition,the product supports QVD files, which are also used by Qlik Sense. Since QlikView 12, the product hasused the same QIX engine as Qlik Sense. To leverage QlikView data models, these files can be loadeddirectly into Qlik Sense. Note that only the data and data models are reused. Visualizations must berecreated as they rely on different technology, but publishing content to Qlik Sense is constantly beingenhanced to facilitate the migration.Front-end functionalityQlikView Desktop is a single-mode tool without a separate design mode. This makes it a little difficult todistinguish between application design and analysis, although Qlik addressed this shortcoming with QlikSense. Each QlikView application is a set of charts, graphs, maps, list boxes and other objects organizedinto multiple tabs. QlikView keeps all objects in context across all the screens, so that dashboards canprovide a highly aggregated view of the data with the ability to jump to detailed analysis in the sameapplication. External content including other QlikView applications can also be called. The Bookmarkfunction, which stores a data context and can contain user comments, adds additional power.The main data display objects are interactive visualizations, including charts, graphs, tables and listboxes. QlikView offers a good selection of advanced chart types. It also has the ability to connect tothird-party objects as so-called extension objects (any kind of visualization), which behave in the sameway as native objects. Tables and pivot tables are also treated as a type of chart and share manyproperties with them. All in all, charts are highly interactive as the whole tool is optimized for aninteractive user experience allowing business users to dig into details quickly and effortlessly. To supportspatial analysis, Qlik delivers Qlik GeoAnalytics for QlikView (see Figure 1).QlikView offers page formatting and formatted export. There are two main approaches for formattedprinting output offered by QlikView: the built-in QlikView Report Editor or Qlik NPrinting. QlikView ReportEditor allows users to create simple reports by dragging charts and tables into the Report Editor designsheet. This capability does not have the depth and completeness of typical formatted reporting tools.Qlik NPrinting offers Microsoft Office, pixel-perfect and web reports based on data and objects fromQlikView and supports centralized scheduling and distribution of reports with recipient specific data. QlikNPrinting is largely suited to technical users rather than business users.QlikView provides an interactive and intuitive user interface for app consumers. Information is presentedto the user using a “green/white/gray” concept. Selections are highlighted in green, associated data isrepresented in white, and excluded (unassociated) data appears in gray. QlikView also provides a strongsearch feature that not only indexes and finds metadata but also the content in all fields loaded.QlikView in The BI & Analytics Survey 21-6-
Analyst Verdict – QlikView April 2020Figure 1: Qlik GeoAnalytics integrated in QlikView applicationQlikView in The BI & Analytics Survey 21-7-
Overall product scoresFunctional evaluationCriteriaScoreFormatted reporting6Dashboards5Ad hoc reporting2Analysis5Analyst Verdict – QlikView April 2020Advanced analytics1PlanningN/A10-point rating scale: 0 (not supported) to 10 (best)Use case analysisCriteriaScoreSelf-service analyticsData discovery & visualizationData preparationDeployment options5-point rating scale: 0 (not supported) to 5 (best)Tool evaluationCriteriaScoreMaturityPace of developmentIntegration in overall analytics portfolio5-point rating scale: 0 (worst) to 5 (best supported)Strengths and weaknessesStrengthsWeaknesses Easy-to-use navigation in data for end users Data consistency issues between severalthrough ‘associative’ queries and interactivevisualizationsmodels if master data and KPIs are notaligned Responsive in-memory processing for large data Limited separation of data and visualiza-volumestions: QlikView QVW files can contain both Decent formatting and charting features Complex data integration tasks requirescripting Fast implementation and application modification Few new features in QlikView as Qlik Leading geo analysis using Qlik GeoAnalyticsSense is the vendor’s primary analyticsfront endQlikView in The BI & Analytics Survey 21-8-
The Customer Verdict – QlikViewThis year we had 114 responses from QlikView Cloud users. At the time of the survey, 92 percent ofthem were using version 12 and 8 percent version 11.Customer Verdict – QlikViewUser and use case demographicsIn this year’s survey, customers report using QlikView mainly for traditional BI topics such as dashboardsand standard/enterprise reporting. In general, these usage scenarios are similar to those of Qlik’s otheranalytics front end, Qlik Sense. 45 percent of business users create reports and 24 percent performmodel/enrich tasks. Both these figures are below the survey average.QlikView is mostly used in mid-sized and large companies by a relatively high proportion of users. Amedian of 110 users per customer work with QlikView. However, the mean value of 905 users indicatesthat there are currently many much larger deployments in production.QlikView in The BI & Analytics Survey 21-9-
Peer groupsThe BI & Analytics Survey 21 features a range of different types of BI tools so we use peer groups tohelp identify competing products. The groups are essential to allow fair and useful comparisons ofproducts that are likely to compete.The peer groups have been defined by BARC analysts using their experience and judgment, withsegmentation based on two key factors: Usage scenario - functional peer groups are mainly data-driven and based on how customerssay they use the product. Regional focus - is the vendor a large international vendor with a truly global presence or doesit focus on a particular region? We also take into account the location of survey respondents.Customer Verdict – QlikViewQlikView features in the following peer groups: Dashboarding-focused products Self-service analytics-focused products Large international BI vendorsThe KPIsThe BI & Analytics Survey 21 provides the reader with well-designed KPI dashboards packed withconcise information, which can be absorbed at a glance. The KPIs all follow these simple rules: Only measures that have a clear good/bad trend are used as the basis for KPIs. KPIs may be based on one or more measures from The BI & Analytics Survey. Only products with samples of at least 20 - 30 (depending on the KPI) for each of the questionsthat feed into the KPI are included. For quantitative data, KPIs are converted to a scale of 1 to 10 (worst to best). A linear min-max transformation is applied, which preserves the order of, and the relativedistance between, products’ scores.For more details on the KPIs, see the “Sample, KPIs & Methodology” document.QlikView in The BI & Analytics Survey 21- 10 -
Customer Verdict – QlikViewWhy organizations buy QlikViewFigure 2: Reasons why QlikView is purchased vs. average of all products (n 99)QlikView in The BI & Analytics Survey 21- 11 -
Customer Verdict – QlikViewProblems encountered by QlikView usersFigure 3: Problems for QlikView users vs. average of all products (n 104)QlikView in The BI & Analytics Survey 21- 12 -
Customer Verdict – QlikViewKPI results for QlikView in the ‘Dashboarding-focused products’ peer groupFigure 4: KPI results for QlikView in the ‘Dashboarding-focused products’ peer groupQlikView in The BI & Analytics Survey 21- 13 -
Customer Verdict – QlikViewKPI results for QlikView in the ‘Self-service analytics-focused products’ peergroupFigure 5: KPI results for QlikView in the ‘Self-service analytics-focused products’ peer groupQlikView in The BI & Analytics Survey 21- 14 -
Customer Verdict – QlikViewKPI results for QlikView in the ‘Large international BI vendors’ peer groupFigure 6: KPI results for QlikView in the ‘Large international BI vendors’ peer groupQlikView in The BI & Analytics Survey 21- 15 -
Customer feedback summary for QlikViewCustomer Verdict – QlikViewAbove-average customer feedback 52 percent of customers say they buy QlikView because of its fast query performance, and theyare rarely disappointed. As a result, QlikView ranks among the leaders for ‘Query performance’and ‘Performance satisfaction’ in all of its peer groups. This impressive result is made possibleby Qlik’s leading in-memory query engine, for which it became famous in the first place. As well as query performance, customers are also attracted by QlikView’s large data handlingcapacity. This is the number two reason why the product is purchased, and it is cited by QlikViewcustomers more than twice as frequently as the survey average. ‘Large data handling capacity’has consistently been one of the reasons to buy associated with the highest benefits gleanedfrom analytics and BI over the years. With this in mind, it is not surprising that QlikView deliversgreater ‘Business value’ and ‘Business benefits’ than its competitors in the ‘Large internationalBI vendors’ peer group. An above-average percentage of QlikView customers report having ‘No significant problems’with the product, a clear indicator of its maturity and stability in productive deployments of allsizes. Directly software-related problems such as ‘Unreliable software’, ‘Software difficult to use’and ‘Query performance too slow’ are ranked at the very bottom of the issues observed byQlikView users, and all of them are reported less often than average. QlikView achieves good results in the ‘Visual analysis’ KPI. Besides offering interactiveassociative (set-based) analysis, the product supports the creation of tailor-made interactiveapplications, which can be used by end users from business departments. These dashboardscan incorporate drill paths to detailed data or other applications. All this functionality allows theimplementation of users’ individual data analysis needs in a guided fashion. The ‘Considered for purchase’ KPI shows how frequently a product is involved in softwareevaluations. It reflects the product’s brand strength and market presence. QlikView is a solid,mature software and is well known in the analytics and BI space. It helped Qlik to grow into alarge international company, and one that went on to substantially broaden its portfolio. QlikViewis ranked third in all its peer groups in this KPI.Below-average customer feedback The most frequently reported problems experienced by QlikView customers are ‘Poor datagovernance’ and ‘Poor data quality’. QlikView relies on data sets stored in isolated files. Thiswas inherited from its initial desktop-based approach to analytics and BI. While this approachdelivers flexibility for data preparation and is the key to Qlik’s performance, replicating data tomultiple targets clearly poses a threat to consistency if not handled correctly. This shows whyQlik is continually investing in improving its data management capabilities to create a true andgoverned end-to-end platform. While many visual analysis-oriented tools are purchased to support business users throughinteractive analyses, the results often need to be distributed to a large number of users in alldepartments. QlikView customers do not rate the software highly on its capabilities for the‘Distribution of reports’. They expect options to export neatly formatted reports into variousoutput formats and deliver personalized content triggered by alerts or schedules.QlikView in The BI & Analytics Survey 21- 16 -
Poor results in the ‘Self-service’ KPI clearly show that QlikView has fallen behind the leadingtools in a market segment it formed and shaped. Today, customers expect more intuitive andguided interfaces with little or no need for coding when creating analytics content. Datapreparation with QlikView demands technical expertise, as does Qlik NPrinting. Another below-average result for QlikView comes in the ‘Ad hoc query’ KPI. The solution is bestsuited to creating predefined, guided applications which give end users flexible paths to navigatethe data in a predefined environment. Business users expect simple access to a broad range ofconsistent and detailed data coupled with quick visualizations. QlikView leverages performanceoptimized yet isolated data sets based on replicated data that cannot answer many businessquestions. While many buyers still consider purchasing QlikView, its ‘Competitive win rate’ is very low. Thesoftware is not being developed at the same rate as competing products, causing a gap infunctionality, features and usability.Customer Verdict – QlikView QlikView in The BI & Analytics Survey 21- 17 -
Customer quotes for QlikViewCustomer Verdict – QlikViewFavorable user reviews It is the most robust BI tool on the market. Powerful, almost intuitive programming, flexible interface, can dock anywhere. Fast results.* An awesome product that can bring insight into even small enterprises. We have used it since2013 and are happy to continue with it. A very handy tool - Swiss army knife of BI. One of the best-of-class business discovery software tools on the market.Critical user reviews Promises to be much easier than reality shows. But almost everything can be realizedsomehow. Good knowledge of scripting and modeling is indispensable in any demandingproject.* Solid engine under the hood. Lots of customization possibilities, GUI experience could be better(so move to [Qlik] Sense instead, and lose some of the customization possibilities).* Translated by BARCQlikView in The BI & Analytics Survey 21- 18 -
Copyright BARC GmbH 2020. All rights reserved.Business Application Research Center – BARC GmbHGermanyBARC GmbHBerliner Platz 7D-97080 Würzburg 49 931 880651-0www.barc.deAustriaBARC GmbHMeldemannstraße 18/01.14A-1200 Wien 43 660 6366870SwitzerlandBARC Schweiz GmbHTäfernstr. 22aCH-5405 Baden-Dättwil 41 56 470 94 34Rest of the World 44 1536 772-451www.barc-research.comQlikView in The BI & Analytics Survey 2119
QlikView applications ("apps") can be hosted on the web as guided apps (e.g., dashboards or analytical applications) or delivered as complete apps with the data to users who use the local client to access server-based apps. The QlikView Publisher component is used to handle data reloads and the distribution of QlikView apps to users.


![Vendor Managed Inventory Master.pptx [Read-Only]](/img/27/vmi-learning-seminar.jpg)