Transcription
Ardiansyah et al. BMC Complementary and Alternative 2018) 18:304RESEARCH ARTICLEOpen AccessAdenosine and adenosine-5′monophosphate ingestion amelioratesabnormal glucose metabolism in mice feda high-fat dietArdiansyah1,2*† , Yuto Inagawa1†, Takuya Koseki3, Afifah Zahra Agista1, Ikuo Ikeda4, Tomoko Goto1,Michio Komai1 and Hitoshi Shirakawa1,5*AbstractBackground: We have previously reported that ingestion of adenosine (ADN) and adenosine-5′-monophosphate(AMP) improves abnormal glucose metabolism in the stroke-prone spontaneously hypertensive rat model of nonobesity-associated insulin resistance. In this study, we investigated the effect of ADN and AMP ingestion on glucosemetabolism in mice with high-fat diet-induced obesity.Methods: Seven-week-old C57BL/6 J mice were administered distilled water (as a control), 10 mg/L ADN, or 13 mg/LAMP via their drinking water for 14 or 25 weeks, during which they were fed a high-fat diet. Oral glucose tolerance test(OGTT) was conducted on 21-week-old mice fasted for 16 h. Insulin tolerance test (ITT) was performed on 22-week-oldmice fasted for 3 h. Blood and muscle were collected for further analysis of serum parameters, gene and proteinexpression levels, respectively.Results: Glucose metabolism in the ADN and AMP groups was significantly improved compared with the control.OGTT and ITT showed that ADN and AMP groups lower than control group. Furthermore, phosphorylation of AMPactivated protein kinase (AMPK) and mRNA levels of genes involved in lipid oxidation were enhanced in the skeletalmuscle of ADN- and AMP-treated mice.Conclusion: These results indicate that ingestion of ADN or AMP induces activation of AMPK in skeletal muscle andmitigates insulin resistance in mice with high-fat diet-induced diabetes.Keywords: Adenosine, Adenosine-5′-monophosphate, Glucose metabolism, High-fat dietBackgroundThe prevalence of obesity has increased because of changing lifestyles, including dietary habits, in both developedand developing countries [1]. Hypertension, diabetes,dyslipidemia, and cardiovascular diseases associated withobesity have been recognized as diseases of worldwide importance [2, 3]. Excessive energy intake causes increasedpresence of non-esterified fatty acids in the blood and diacylglycerol and palmitoyl-CoA in the liver and skeletal* Correspondence: ardiansyah@bakrie.ac.id; shirakah@tohoku.ac.jp†Ardiansyah and Yuto Inagawa contributed equally to this work.1Laboratory of Nutrition, Graduate School of Agricultural Science, TohokuUniversity, Sendai 980-0845, JapanFull list of author information is available at the end of the articlemuscle, followed by heightened oxidative stress [4, 5],factors that are known to induce insulin resistance.Given that insulin resistance is a major pathogenic eventin the occurrence and progression of lifestyle-associateddiseases, its alleviation is a key strategy for the preventionof such conditions. Adenosine-5′-monophosphate (AMP)activated protein kinase (AMPK) has been reported toattenuate insulin resistance, since it enhances lipid oxidation and glucose uptake in the liver and skeletal muscle, inwhich it regulates the expression of β-oxidation-associatedgenes. Therefore, much attention is being paid to AMPK asa potential therapeutic target in the treatment of insulinresistance [6, 7]. The Author(s). 2018 Open Access This article is distributed under the terms of the Creative Commons Attribution 4.0International License (http://creativecommons.org/licenses/by/4.0/), which permits unrestricted use, distribution, andreproduction in any medium, provided you give appropriate credit to the original author(s) and the source, provide a link tothe Creative Commons license, and indicate if changes were made. The Creative Commons Public Domain Dedication o/1.0/) applies to the data made available in this article, unless otherwise stated.
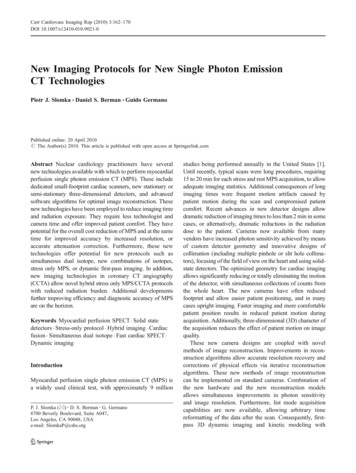
Ardiansyah et al. BMC Complementary and Alternative Medicine(2018) 18:304Adenosine (ADN) is an endogenous purine nucleosidebut also derives from AMP in food via the action of nucleotidase in the small intestine, from which it isabsorbed into the body. Cellular ADN levels are regulated by both efflux and influx transporters [8, 9], andthis molecule participates in diverse cellular functions,including the inflammatory immune response and lipidmetabolism in the liver [10–12].Various studies have provided evidence to support therole of ADN in health. For example, studies in both ratsand humans demonstrated that oral ingestion of ADN insucrose solutions significantly decreased blood glucoseand insulin levels through inhibition of α-glucosidase activity by ADN [13, 14]. ADN has the capacity to attenuate the proliferation of both human and rat glomerularmesangial cells, which are related to hypertension anddiabetes [15]. Furthermore, prior research using Sprague–Dawley rats has shown that ADN attenuateshigh-fat diet-induced increases in blood glucose andinsulin, suppresses elevation of plasma corticosteronelevels, rectifies altered nutrient transporter expressionprofiles, and prevents upregulation of TNF-α in the intestine [16]. On the other hand, AMP is well known as apurine nucleotide and participant in ATP metabolism. Ithas been approved by the FDA as a food additive toblock bitter taste or enhance flavor [17, 18]. In addition,the functional properties of AMP have been implicatedin thermoregulation of men and induction ofhypothermia through ADN receptors [19].Our group has examined the effect of ADN and AMPadministration on the stroke-prone spontaneously hypertensive rat model of non-obesity-induced hypertensionand insulin resistance [20, 21]. We found that ingestion ofADN and AMP activates AMPK in skeletal muscle andameliorates insulin resistance and impaired glucose metabolism. The aim of the present study was to investigatethe influence of ADN and AMP ingestion on glucose metabolism in a mouse model of obesity-associated insulinresistance induced by a high-fat diet.MethodsAnimal experimentsMale C57BL/6 J mice (CLEA Japan Inc., Tokyo, Japan)were housed in polycarbonate cages (three mice percage) under controlled conditions (temperature, 23 3 C; humidity, 50 10%; 12/12 h light/dark cycle). Themice were sorted by body weight before beginning thestudy, and those used in experiments were of the sameweight. The experimental design of the present studywas approved by the Animal Research-Animal CareCommittee of Tohoku University. The mouse model ofdiet-induced obesity has become popular as a tools forunderstanding high-fat in human and the developmentof obesity. C57BL/6 J mice as a good model forPage 2 of 8diet-induced obesity that has correlated closely with human obesity progression [22]. All experiments were conducted in accordance with the guidelines issued by thiscommittee and Japanese legislation (2005). The micewere acclimatized for 7 days with free access to conventional non-purified diet (F-2, Funabashi Farm Co., Ltd.,Chiba, Japan) and distilled water. After this period, the7-week-old mice were administered distilled water (control), ADN, or AMP for 14 or 25 weeks. ADN (WakoPure Chemical Industries, Osaka, Japan) and AMP(kindly provided by Yamasa Co., Chiba, Japan) were usedat 10 and 13 mg/L in distilled water, respectively. Allmice received a high-fat diet (HFD32, CLEA Japan Inc.).HFD32 is super-high-fat diet with 32% of crude fat andcalorie rate 60% from gross energy (fat kcal %). Foodand water intake was recorded every 2 days, and bodyweight was measured every week during the experimental period. At the end of the experiment, mice were euthanized by decapitation after 6 h of fasting. Blood wascollected, and serum was immediately separated by centrifugation and stored at 20 C until analysis. Skeletalmuscle (the quadriceps femoris muscle) was excised andkept at 80 C until needed. The workflow diagram ofthe experiment is shown in Fig. 1.Tolerance testsWe subjected mice in the 25-week experimental groups toboth oral glucose tolerance tests (OGTT) and insulin tolerance tests (ITT). OGTT were conducted on 21-week-oldmice fasted for 16 h. Blood for glucose measurement wascollected from the tail vein before (0 min) and 15, 30, 60,and 120 min after administration of glucose at 2.0 g/kgbody weight via a gastric tube. Blood glucose levels weremeasured using a StatStrip Glucose Xpress Meter (NovaBiomedical Co., Waltham, MA, USA).ITT were performed on 22-week-old mice fasted for3 h. Blood for glucose measurement was collected fromthe tail vein before (0 min) and 15, 30, and 60 min afterintraperitoneal administration of insulin (Humulin R, EliLilly & Co., Indianapolis, IN, USA) at 0.75 U/kg bodyweight. Blood glucose levels were measured with a StatStrip Glucose Xpress Meter.Serum parametersSerum levels of glucose, triglycerides, and non-esterifiedfatty acids were measured by enzymatic colorimetricmethods (Wako Pure Chemical Industries). Serum insulin and adiponectin levels were tested using rat insulin(Morinaga Institute of Biological Science, Inc., Yokohama, Japan) and mouse/rat adiponectin (Otsuka Co.,Tokyo, Japan) ELISA kits, respectively. Blood sampleswere collected, centrifuged at 1870 g for 15 min at 4 Cin a centrifuge (CF7D2; Hitachi Co. Ltd., Tokyo, Japan)and stored at 80 C until required for later analyses.
Ardiansyah et al. BMC Complementary and Alternative MedicineAcclimatizedfor 7 days(2018) 18:3047Page 3 of 81421 22OGTTAnimal groupsC, distilled waterAll micereceived ahigh fat diet1. Sacrificed2. Blood collection forfurther analysesADN, 10 mg/L25WeekITT1. Sacrificed2. Blood and organcollecting forfurther analysesAMP, 13 mg/LFood and water intake was recordedevery 2 days. Body weight was measuredevery week during the experimentalperiod.Fig. 1 Workflow diagram of the experiments. C, control group; ADN, adenosine group; AMP, adenosine-5′-monophosphate group; OGTT, oralglucose tolerance test; ITT, insulin tolerance testsRNA preparation and quantitative RT-PCRTotal RNA was isolated from muscle tissue with the guanidine isothiocyanate-based reagent Isogen (Nippon Gene,Tokyo, Japan), according to the manufacturer’s instructions. The isolated RNA was treated with RNase-freeDNase (Qiagen, Hilden, Germany) for 10 min at roomtemperature before being purified using an RNeasy Minikit (Qiagen). The ratio of absorbance at wavelengths of260 and 280 nm was measured, and agarose gel electrophoresis was performed for quantitative and qualitativeanalysis of the isolated RNA. Four micrograms of totalRNA was used as a template to synthesize cDNA. TheRNA was denatured in the presence of oligo (dT), randomprimers, and 10 mmol/L dNTP (Amersham Biosciences,Tokyo, Japan) at 65 C for 5 min. It was then incubated ina 20-μL volume with 50 mmol/L Tris-HCl (pH 8.3)containing 0.1 mol/L DTT, 50 U SuperScript III reversetranscriptase (Invitrogen, Carlsbad, CA, USA), and 20 URNaseOUT RNase inhibitor (Invitrogen) at 25 C for5 min, 50 C for 60 min, and 70 C for 15 min. Aliquots ofthe resulting cDNA were used as templates in subsequentquantitative PCR using an Applied Biosystems (FosterCity, CA, USA) 7300 Real-Time PCR System and SYBRPremix Ex Taq (Takara Bio Inc., Kusatsu, Japan) accordingto the manufacturers’ instructions. Relative target gene expression levels were normalized to those of eukaryoticelongation factor-1α1 mRNA [23]. The target sequenceswere amplified using primers specific to the corresponding cDNA (Additional file 1: Table S1).Applied Science, Mannheim, Germany) and phosphatase(PhosSTOP Phosphatase Inhibitor Cocktail, RocheApplied Science). The lysate was centrifuged at 15,000 gfor 30 min for collection of the supernatant, the concentration of protein in which was determined using a protein assay kit (Bio-Rad, Hercules, CA, USA). Twentymicrograms of protein was mixed with SDS gel-loadingbuffer and resolved by SDS-polyacrylamide gel electrophoresis on 10–20% gels (Wako Pure Chemical Industries). The proteins were subsequently transferred onto apolyvinylidene fluoride membrane (Millipore, Billerica,MA, USA), which was then blocked for 1 h withTris-buffered saline-Tween 20 (10 mM Tris-HCl atpH 7.4, 150 mM NaCl, and 0.1% Tween 20) containing5% skim milk or 5% bovine serum albumin (Sigma, St.Louis, MO, USA) and incubated with antibodies againstAMPKα2 (Millipore) or phosphorylated AMPKα(Thr172) (Millipore), respectively. The membranes werealso probed with an antibody against α-tubulin (Sigma).Protein bands were visualized with Immobilon WesternDetection Reagent (Millipore) and an LAS-4000 mini luminescent image analyzer (Fujifilm, Tokyo, Japan). Therelative level of each protein was normalized to that ofα-tubulin.Statistical analysisData are presented as means SEM. Statistical analysiscomprised repeated-measures one-way ANOVA followedby the Tukey–Kramer test. A p-value 0.05 was considered to indicate a significant difference among means.Western blot analysisSkeletal muscle lysate was prepared after removal of adipose tissue by homogenizing the muscle in ice-coldphosphate-buffered saline containing inhibitors of proteinase (Complete Proteinase Inhibitor Cocktail, RocheResultsBody weight and daily ADN and AMP intakeBody weight, body weight gain, and the food efficiencyratio (FER) did not differ among the groups after
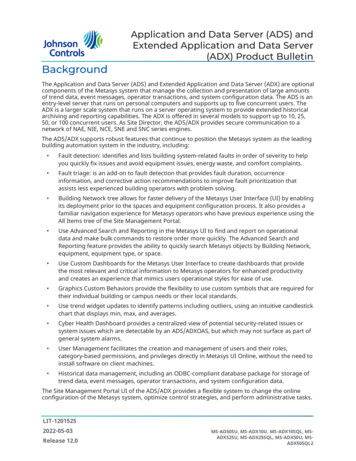
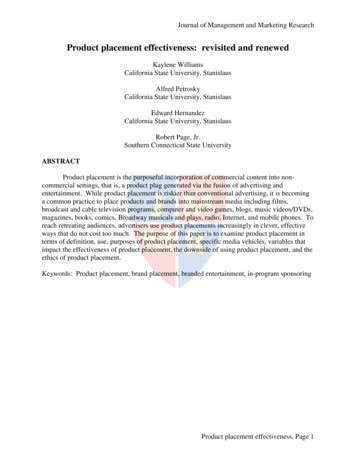
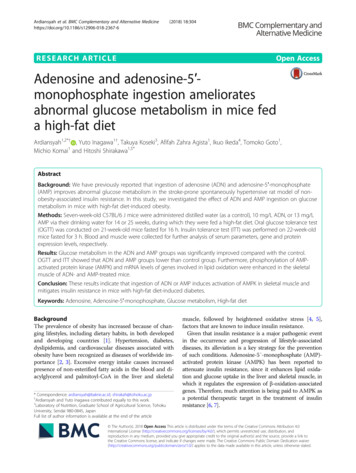
Ardiansyah et al. BMC Complementary and Alternative Medicine(2018) 18:304administration of ADN or AMP for 14 or 25 weeks(Additional file 2: Table S2) when compared with thecontrol group. However, the FER in the ADN group wassignificantly higher compared with that in the AMPgroup at 14 weeks. In addition, no differences betweenthe groups were noted in food and water intake andrelative organ weights (data not shown). ADN and AMPintake, calculated according to the volume of water consumed, was 25 0.1 and 34 0.3 μg·day 1, respectively.Serum parametersAfter 6 h of fasting, serum glucose levels at the 14thweek of treatment were significantly lower in the ADNgroup than in the AMP group but did not significantlydiffer from those in the control group (Fig. 2a). Inaddition, no differences were noted among the control,ADN, and AMP groups in terms of serum levels of insulin, triacylglycerol, non-esterified fatty acids, and adiponectin (Fig. 2b-e).OGTTWe performed OGTT at the 14th week of administration. Plasma glucose levels in both the ADN and AMPgroups were significantly lower than those in the controlgroup 30 and 60 min after glucose administration (Fig. 3a).Page 4 of 8Furthermore, the incremental area under the curve calculated for the ADN and AMP treatments was significantlysmaller than that for the control (Fig. 3b). ITT werecarried out at the 15th week of treatment. Plasmaglucose levels were significantly lower in the ADNgroup than in the control group 60 min after administration of insulin (Fig. 4).AMPK phosphorylation and gene expressionWe measured levels of phosphorylated and total AMPKα-subunit (AMPKα) protein in skeletal muscle by western blotting to evaluate AMPK activation in this tissue(Fig. 5a, b). The relative quantity of total AMPKα(t-AMPKα) at the 14th week of administration was significantly higher in the AMP group than in the controlgroup (Fig. 5c), and phosphorylated AMPKα (p-AMPKα)levels in the ADN and AMP groups were significantlyhigher than those in the control group at both week 14and 25 (Fig. 5d). Moreover, the ratio of p-AMPKα tot-AMPKα was significantly higher in the ADN and AMPgroups than in the control group after 14 and 25 weeks oftreatment (Fig. 5e). These results suggest that administration of ADN or AMP enhanced AMPK activity in skeletalmuscle. mRNA levels of peroxisome proliferator-activatedreceptor α (Pparα) were significantly increased afterFig. 2 Serum biochemical parameters of mice with high-fat diet-induced obesity administered ADN or AMP after fasting 6 h. a Glucose; (b)insulin; (c) triacylglycerol; (d) non-essential fatty acids; (e) adiponectin. Values are means SEM, n 5 or 6. *p 0.05 versus the control group.Different letters in the same panel represent a significant difference (p 0.05). C, control group; ADN, adenosine group; AMP, adenosine-5′-monophosphategroup
Ardiansyah et al. BMC Complementary and Alternative Medicine(2018) 18:304aPage 5 of 8bFig. 3 Oral glucose tolerance tests of mice with high-fat diet-induced obesity administered ADN or AMP. a Blood glucose changes; (b)incremental areas under the curve (iAUC). Values are means SEM, n 5 or 6. *p 0.05, **p 0.01, ***p 0.001 versus the control group. C,control group; ADN, adenosine group; AMP, adenosine-5′-monophosphate group14 weeks of ADN or AMP treatment. In addition, those ofacyl-CoA synthase (Acs), very long chain acyl-CoA dehydrogenase (Vlcad), and PPAR gamma coactivator 1α(Pgc1α) were significantly higher in the AMP group than inthe control group at week 14 (Additional file 3: Table S3).However, no significant differences in the levels ofthese transcripts were observed between the groups atthe 25th week of administration.DiscussionIn our previous work, we investigated the capacity ofADN and AMP to ameliorate metabolic syndrome-relateddiseases using a stroke-prone spontaneously hypertensiverat model of non-obesity-associated insulin resistance andhypertension-related disorders similar to human essentialhypertension [20, 21]. ADN administration reduced bloodglucose and insulin levels measured under fastingADNGlucose (% of baseline)CAMP**0153060Time after administration (min)Fig. 4 Changes in blood glucose during insulin tolerance tests ofmice with high-fat diet-induced obesity administered ADN or AMP.Values are means SEM, n 5 or 6. **p 0.01 versus the controlgroup. C, control group; ADN, adenosine group; AMP,adenosine-5′-monophosphate groupconditions, as well as glucose and insulin tolerance. Inaddition, we showed for the first time that ingestion ofAMP increases plasma adiponectin concentration, upregulates hepatic Prkaa1 mRNA expression, and elevateslevels of p-AMPKα, leading to enhanced expression ofgenes associated with β-oxidation in the liver.In the current study, we examined the effect of ADNand AMP administration on glucose metabolism usingmice fed a high-fat diet as an animal model of obesity.Human and animal studies have demonstrated that adiet high in fat induces increased lipid accumulation intissues including adipose tissue and skeletal muscle,followed by insulin resistance [24]. Increased levels ofnon-esterified fatty acids in the blood and diacylglyceroland palmitoyl-CoA in organs result in activation ofc-Jun N-terminal kinase (JNK) and inhibitor of kappalight polypeptide gene enhancer in B-cells, kinase β(IKKβ). Activation of JUN and IKKβ leads to serinephosphorylation of insulin receptor substrate, interferingwith insulin signaling via the insulin receptor [25, 26].We speculate that the effect of ADN and AMP is morepronounced in the early stage of diabetes. Future studiesare needed to clarify the detailed mechanism, but ADNand AMP are promising candidates for the prevention ofdiabetes in both mice and humans.Even though blood glucose levels in fasted state werenot different among the groups (Fig. 1a), tolerance testsrevealed that ADN and AMP improved the abnormalglucose tolerance (Fig. 3) and insulin sensitivity (Fig. 4)observed in the mouse model of obesity used in thisstudy. These results indicate that administration of ADNor AMP can mitigate insulin resistance in mice fed ahigh-fat diet. ADN and AMP treatment may have theability to reduce blood glucose in postprandial, but notin fasted state.In this study, we found that oral administration ofADN or AMP can activate AMPK in skeletal muscle(Fig. 5). This is the first in vivo demonstration of AMPKactivation by ADN or AMP in the high-fat diet-inducedobese mouse model of insulin resistance. AMPK acts as
Ardiansyah et al. BMC Complementary and Alternative Medicine(2018) 18:304Page 6 of 8Fig. 5 Representative immunoblot images and quantitative analyses of total AMPKα, phosphorylated AMPKα, and α-tubulin. a Western blotimages at 14 weeks; (b) western blot images at 25 weeks; (c) expression of total AMPKα (t-AMPKα); (d) expression of phosphorylated AMPKα(p-AMPKα); and (e) ratio of t-AMPKα to p-AMPKα. Values are means SEM, n 5 or 6. *p 0.05, **p 0.01, ***p 0.001 versus the control group.C, control group; ADN, adenosine group; AMP, adenosine-5′-monophosphate groupa sensor, and when activated, stimulates mitochondrialbiogenesis, energy production, lipid oxidation, and glucose influx, alleviating insulin resistance via activation ofsirtuin 1 and PGC1α [27]. AMPK activation in musclewas enhanced after both 14 and 25 weeks of ADN orAMP administration independently of adiponectin.Thus, ADN and AMP may indeed suppress the progression of high-fat diet-induced insulin resistance relativelyearly in the development of diabetes.mRNA expression of the gene encoding PPARα, anAMPK target in skeletal muscle, was increased in theAMP and ADN groups after 14 weeks of administration.Furthermore, levels of Acs and Vlcad mRNA were alsohigher in the AMP group at this time point (Additionalfile 3: Table S3). However, these differences were nolonger evident after 25 weeks of treatment, despitecontinued AMPK activation in the skeletal muscle ofADN- or AMP-treated mice. Thus, although at 14 weeks(Additional file 3: Table S3), activation of AMPK inskeletal muscle stimulated the expression of PPARαand its target genes; it suggests that an adaption hadoccurred by the 25th week of administration(Additional file 3: Table S3). Skeletal muscle canadapt its metabolic properties in response to a number of physiologic conditions by activation and repression of signaling events that affect the metabolicpathways of several genes related to the oxidationprocess. The first evidence linking AMPK to theregulation of glucose metabolism in skeletal musclewas provided by treatment with AICAR, an activator
Ardiansyah et al. BMC Complementary and Alternative Medicine(2018) 18:304of AMPK that enhances fatty acid oxidation [28]. Ourresults suggest that ADN and AMP contribute to improving the regulation of glucose metabolism throughexpression of PPARα and its target genes.Lipid accumulation in the skeletal muscle of obese animals induces abnormal glucose metabolism accompaniedby dysregulated insulin signaling and skeletal muscle function. Upregulation of lipid oxidation in skeletal muscle isconsidered a therapeutic strategy to combat insulin resistance. Unsaturated fatty acids, such as oleic acid, and agonists of PPARα enhance lipid oxidation and are expectedto have therapeutic effects in diabetes [29–31]. In ourstudy, administration of ADN or AMP increased the expression of transcripts associated with lipid oxidation inskeletal muscle. As muscle is the major site of ATPproduction and consumption, enhanced lipid oxidation inskeletal muscle may be involved in the mitigation of abnormal glucose metabolism by ADN and AMP in micefed a high-fat diet.Although this study was carefully and well prepared,we were still aware of its limitations. We need to measure locomotor activity of mice. Various studies haveshown that in rodent models of obesity locomotor activity is necessary to evaluate. Further studies are neededto evaluate the behavior of mice after administration ofADN and AMP. In addition, further studies are neededto elucidate the complete physiological effect of ADNand AMP to confirm its detailed mechanism of action atthe molecular level.ConclusionsHere, we showed that administration of ADN or AMPto obese mice ameliorates abnormal glucose metabolisminduced by a high-fat diet. ADN or AMP treatment alsoincreases the level of activated AMPK in skeletal muscle.Activation of AMPK may upregulate lipid oxidation andattenuates insulin resistance caused by obesity.Additional filesAdditional file 1: Table S1. Sequences of primers used for quantitativeRT-PCR. (DOCX 18 kb)Additional file 2: Table S2. Effect of ADN and AMP on body weight,weight gain, and food efficiency ratio. (DOCX 13 kb)Additional file 3: Table S3. Quantitative RT-PCR measurements of mRNAlevels (fold changes) after ADN and AMP administration. (DOCX 17 kb)AbbreviationsADN: Adenosine; AMP: Adenosine-5′-monophosphate; AMPK: AMP-activatedprotein kinase; ITT: Insulin tolerance tests; OGTT: Oral glucose tolerance testsAcknowledgmentsWe are thankful to Yamasa Co. (China, Japan), which kindly provided theAMP used in this study.Page 7 of 8FundingThis work was partially supported by the JSPS Core-to-Core Program A (AdvancedResearch Networks) entitled “Establishment of international agricultural immunology research-core for a quantum improvement in food safety.”Availability of data and materialsThe datasets used and/or analyzed during the current study are availablefrom the corresponding author on reasonable request.Authors’ contributionsA and YI performed the experiments and prepared the manuscript. TK, AZA,II, and TG contributed to the design of the experiments and participated inthe discussion of the results. MK and HS supervised the entire design of theexperiments and drafted the manuscript. All authors read and approved thefinal manuscript.Ethics approvalThe experimental design of the present study was approved by the AnimalResearch-Animal Care Committee of Tohoku University. All experiments wereconducted in accordance with the guidelines issued by this committee andJapanese legislation (2005).Consent for publicationNot applicableCompeting interestsThe authors declare that they have no competing interest associated withthis publication.Publisher’s NoteSpringer Nature remains neutral with regard to jurisdictional claims inpublished maps and institutional affiliations.Author details1Laboratory of Nutrition, Graduate School of Agricultural Science, TohokuUniversity, Sendai 980-0845, Japan. 2Department of Food Science andTechnology, Universitas Bakrie, Jakarta 12920, Indonesia. 3Faculty ofAgriculture, Yamagata University, Tsuruoka 997-8555, Japan. 4Laboratory ofFood and Biomolecular Science, Graduate School of Agricultural Science,Tohoku University, Sendai 980-0845, Japan. 5International Education andResearch Center for Food Agricultural Immunology, Graduate School ofAgricultural Science, Tohoku University, Sendai 980-0845, Japan.Received: 25 April 2018 Accepted: 30 October 2018References1. Hardus PM, van Vuuren CL, Crawford D, Worsley A. Public healthperceptions of the causes and prevention of obesity among primary schoolchildren. Int J Obes Relat Metab Disord. 2003;27:1465–71.2. Haffner S, Taegtmeyer H. Epidemic obesity and the metabolic syndrome.Circulation. 2003;108:1541–5.3. Sharma AM. The obese patient with diabetes mellitus: from research targetsto treatment options. Am J Med. 2006;119:S17–23.4. Hotamisligil GS. Inflammation and metabolic disorders. Nature. 2006;444:860–7.5. Erion DM, Shulman GI. Diacylglycerol-mediated insulin resistance. Nat Med.2010;16:400–2.6. Cantó C, Gerhart-Hines Z, Feige JN, Lagouge M, Noriega L, Milne JC, ElliottPJ, Puigserver P, Auwerx J. AMPK regulates energy expenditure bymodulating NAD metabolism and SIRT1 activity. Nature. 2009;458:1056–60.7. Yamauchi T, Kamon J, Minokoshi Y, Ito Y, Waki H, Uchida S, Yamashita S,Noda M, Kita S, Ueki K, Eto K, Akanuma Y, Froguel P, Foufelle F, Ferre P,Carling D, Kimura S, Nagai R, Kahn BB, Kadowaki T. Adiponectin stimulatesglucose utilization and fatty-acid oxidation by activating AMP-activatedprotein kinase. Nat Med. 2002;8:1288–95.8. Zimmermann H. Extracellular metabolism of ATP and other nucleotides.Naunyn Schmiedeberg's Arch Pharmacol. 2000;362:299–309.9. Duflot S, Riera B, Fernández-Veledo S, Casadó V, Norman RI, Casado FJ, LluísC, Franco R, Pastor-Anglada M. ATP-sensitive K channels regulate the
Ardiansyah et al. BMC Complementary and Alternative 24.25.26.27.28.29.(2018) 18:304concentrative adenosine transporter CNT2 following activation by A1adenosine receptors. Mol Cell Biol. 2004;24:2710–9.Hasko G, Linden J, Cronstein B, Pacher P. Adenosine receptors: therapeuticaspects for inflammatory and immune diseases. Nat Rev Drug Discov. 2008;7:759–70.Dhalla AK, Santikul M, Smith M, Wong MY, Shryock JC, Belardinelli L. Antilipolyticof novel partial A1 adenosine receptor agonist devoid of cardiovascular effects:comparison with nicotinic acid. J Pharmacol Exp Ther. 2007;321:327–33.Dhalla AK, Wong MY, Voshol PJ, Belardinelli L, Reaven GM. A1 adenosinereceptor partial agonist lowers plasma FFA and improves insulin resistanceinduced by high-fat diet in rodents. Am J Physiol Endocrinol Metab. 2007;292:E1358–63.Fukumori Y, Maeda N, Takeda H, Onodera S, Shiomi N. Serum glucose andinsulin response in rats administered with sucrose or starch containingadenosine, inosine or cytosine. Biosci Biotechnol Biochem. 2000;64:237–43.Fukumori Y, Takeda H, Fujisawa T, Ushijima K, Onodera S, Shiomi N. Bloodglucose and insulin concentrations are reduced in human administeredsucrose with inosine or adenosine. J Nutr. 2000;130:1946–9.Dubey RK, Gillespie DG, Mi Z, Jackson EK. Adenosine inhibit PDGF-inducedgrowth of human glomerular mesangial cells via A2B receptors.Hypertension. 2005;46:628–34.Lee CY. Adenosine protects Sprague Dawley rats from high-fat diet andrepeated acute restraint stress-induced intestinal inflammation and alteredexpression of nutrient transporters. J Anim Physiol Anim Nutr. 2015;99:317–25.Ding M, Yuzo N, Robert FM. Blocking taste receptor activation of gustducingustatory responses to bitter compounds. Proc Natl Acad Sci U S A. 1999;96:9903–8.Zhang F, Wang S, Luo Y, Ji X, Nemoto EM. When hypothermia meetshypotension and hyperglycemia: the diverse effects of adenosine 50monophosphate on cerebral ischemia in rats. J Cereb Blood Flow Metab.2009;29:1022–34.Swoap SJ, Rathvon M, Gutilla M. AMP does not induce torpor. Am J PhysiolRegul Integr Comp Physiol. 2007;293:R468–73.Ardiansyah, Shir
metabolism in mice with high-fat diet-induced obesity. Methods: Seven-week-old C57BL/6 J mice were administered distilled water (as a control), 10 mg/L ADN, or 13 mg/L AMP via their drinking water for 14 or 25 weeks, during which they were fed a high-fat diet. Oral glucose tolerance test (OGTT) was conducted on 21-week-old mice fasted for 16 h.