Transcription
How are UML Class Diagrams built in practice?A usability study of two UML tools: MagicDraw andPapyrusElena Planasa, , Jordi Cabotb,aa UniversitatOberta de Catalunya (UOC), Barcelona Spainb ICREA, Barcelona, SpainAbstractSoftware modeling is a key activity in software development, especially whenfollowing any kind of Model Driven Software Engineering (MDSE) process. Inthis context, standard modeling languages, like the Unified Modeling Language(UML), and tools for supporting the modeling activities become essential.The aim of this study is to analyze how modelers build UML models andhow good modeling tools are in supporting this task. Our goal is to drawsome useful lessons that help to improve the (UML) modeling process both byrecommending changes on the tools themselves and on how UML is taught sothat theory and practice of UML modeling are better aligned.Our study employs two research approaches. The main one is an empiricalexperiment (which analyzes screen recordings registered by undergraduate students during the construction of a UML class diagram). An analytical analysiscomplements the previous experiment. The study focuses on the most frequenttype of UML diagram, the class diagram, and on two tools widely used by themodeling community: MagicDraw and Papyrus.Keywords: UML, Class Diagram, Papyrus, MagicDraw, ControlledExperiment, GOMS Corresponding author at: Rambla del Poblenou 156, 08018 Barcelona, Spain. Tel.: 3493 326 35 49; fax: 34 93 326 88 22.Email addresses: eplanash@uoc.edu (Elena Planas), jordi.cabot@icrea.cat (JordiCabot)Preprint submitted to Journal of Computer Standards & InterfacesJuly 22, 2019
1. IntroductionSoftware modeling is a key activity in Model Driven Software Engineering(MDSE) [1] to increase efficiency and effectiveness in software development, asdemonstrated by various quantitative and qualitative studies [2]. In this context,standard languages and tools for supporting modeling become essential. On thelanguage side, the Unified Modeling Language (UML)1 is the de facto standardfor modeling software systems. UML [3] provides several diagrams for modelingthe structure of a software system, its architecture and its behavior. A largenumber of commercial and open-source tools are available to support UMLmodeling such as MagicDraw, Papyrus, ArgoUML, Modelio, StarUML, amongmany others2 . While the tool features differ, they all offer a graphical editor tofacilitate the definition of UML models.A large number of studies have been conducted in the literature to analyzehow UML is used and how usable are UML modeling tools [4, 5, 6, 7, 8, 9, 10,11, 12, 13, 14, 15, 16, 17]. Our study adds a new perspective to these previousworks by analyzing screen recordings of modelers3 actually trying to build UMLmodels. We focus on the most frequently used UML diagram, the class diagram[18], and on two tools widely used by the community: MagicDraw4 (version 18.0Personal Edition, from 2017) and Papyrus5 (Neon 2.0.X version, from 2017).We have chosen these tools because they are two of the most popular modelingtools and they cover a representative group of modelers. MagicDraw is one ofthe major commercial modeling tools, recently acquired by Dassault Systemsto strengthen its set of System Engineering tools while Papyrus is the referenceopen source modeling tool in the Eclipse community.In contrast, many of the previous studies relied on surveys to get the raw1 UMLspecification: https://www.omg.org/spec/UML/a curated list of UML tools here: https://modeling-languages.com/uml-tools/3 In this paper we use the word modeler to refer to all the users that use modeling tools,2 Seeincluding students and professional developers.4 www.nomagic.com/products/magicdraw5 www.eclipse.org/papyrus2
data that limits the insights that can be derived for a usability study. We believeour real-time observations of the study participants during the modeling processitself bring new dimensions to be exploited. In particular, we analyze severalperspectives: the strategy followed to build the models, the effort required tobuild them and the obstacles arisen throughout all the modeling process. Notethat our focus is to assess the usability of UML modeling tools and not tostudy the variations in the quality and creativity of the models defined by eachparticipant. To isolate as much as possible the study of this usability aspectfrom other dimensions, participants were asked to draw with the tool a UMLmodel already given in advance. Therefore, in this paper, we use the term“modeling” strictly in the sense of recording a UML class diagram in a givenmodeling tool. This approach allows us to compare the results of our controlledexperiment.The empirical data reported in this paper is supported by more than 12 hoursof screen recordings (interaction with the modeling tools including verbal audiocomments) registered by undergraduate students during the construction of aUML class diagram. To complement our controlled experiment, we conducteda GOMS (Goals, Operators, Methods and Selection Rules) study in order toassess the usability of the studied tools from an analytical view.According to the objectives template of the Goal/Question/Metric method(GQM) [19], the general objective of our study is: Analyze how students model(what strategy they follow, what effort is needed and what obstacles they encounter) and how modeling tools support this task in order to to improve theperformance of UML modeling tools as well as the way of how UML modelingis taught with respect to the construction of UML class diagrams from theperspective of the modeler.The rest of the paper is organized as follows: Section 2 discusses the stateof the art; Sections 3 and 4 describe in more detail the perspectives of ourstudy and its goals; Sections 5 and 6 describe our empirical and analyticalstudies respectively; Section 7 discuses the results of both experiments andproposes several recommendations; and finally Section 8 draws the conclusions3
and outlines the further work.2. State of the ArtIn the last years, an increasing amount of research in software engineeringhas been devoted to analyze and experiment how software engineering methodsand tools are being used by students and practitioners. In this section we reviewthe most relevant related works covering software modeling aspects accordingto several perspectives.The related works may be classified into two categories based on whethertheir focus is on the usability of the language or on the tools supporting it. Manyworks belong to the former [7, 8, 9, 13, 14, 15, 17, 20, 21]. These works aimto examine how UML is adopted, which are the most/less used UML diagrams,what are the main difficulties when modeling, etc. Other works look more closelyto the usability of UML modeling tools themselves [4, 5, 6, 10, 11, 12, 16] mainlyto compare the different tools among them. These are the works closer to ours.Table 1 summarizes the studies of this second category according to its goal,the tool/s under study, the employed research approach, the size of the sample(if applicable) and the data analyzed during the study. The last row shows ourown study for comparison purposes.Table 1: Related works focused on analyze the usability of UML modeling Analyze the use of(2017)toolsinn/amodelingteachingData taughtDatacol-lected fromthe surveymodeling in30 countries[5]Compare the usabilityRational(2007)of two UML tools withRoserespect to their suit-UMLetEmpirical:andCase Studyn/aUsabilitydata (mouseclicks)col-ability for explorativelected fromUML sketching16testingscenariosContinued on next page4
Table 1 – continued from previous pageRefGoalTool/sResearchSampleData ana-Approachlyzed[6]Test empirically lledyearforexperi-dentsofseveralUML modeling itect,Analytical:ScienceJudeGOMScourseCom- on forof approachto68 model-Empirical:ing toolsCase studydata(tool evalu-lectedation)duringdeter-mine the specificationcompliance of UMLcol-thecase studytools[11]Compare several mod-UMLet,Empirical:(2011)eling tools,VisualCase studyshowingn/aUsabilitydatacol-advantages and disad-Paradigm,lectedvantages for each oneRationalduringRose, Mag-case ne criteria to se-Rational(2009)lect the best tool forRose,Empirical:building software sys-goUML,lectedtemsMagicDraw,duringEnterprisecase studyAr-n/aUsabilityCase studydatacol-theArchitect[16]Compare the produc-IBM Ratio-Empirical:30 studentsData(2015)tivitynal SoftwareControlledat Nationallected fromware engineers whileArchitectexperimentUniversityamodeling with iencesmentofexperi-(Islamabad,Pakistan)Continued on next page5
Table 1 – continued from previous pageRefGoalTool/sResearchSampleData rical:45UML modeling rsitatcapturedObertaduringandPa-Papyrus) are usedment stvideosthetools usageSpain)From Table 1 we can observe that most works employ empirical researchapproaches, relying on case studies [5, 10, 11, 12], controlled experiments [6, 16]and web-based surveys [4] to conduct the study. To a lesser extent, some worksemploy also analytical research approaches [6].To the best of our knowledge, our study is the first one in this contextanalyzing video recordings as part of an empirical study.Finally, although they are out of the scope of this work, we would like tobriefly mention two works which have inspired our work. Aiko et al. [22]and Murphy et al. [23] analyze how Java programming tools (in particular,the IDE Eclipse) are used by practitioners through analyzing video recordingsand interaction traces. As our work, these procedures allow to extract highlyrelevant information, through the observation in real time of all intermediatestates during the programming process, instead of analyzing only the final stateonce the program has been constructed.3. Perspectives of our studyAs introduced before, the overall goal of this study is to analyze how UMLclass diagrams are built using two modeling tools (MagicDraw and Papyrus)and how well modeling tools support this task. To this end, we pay attention tothree perspectives: the modeling strategy (see Section 3.1), the modeling effort(see Section 3.2), and the modeling obstacles (see Section 3.3).This section introduces and motivates each one of these perspectives.6
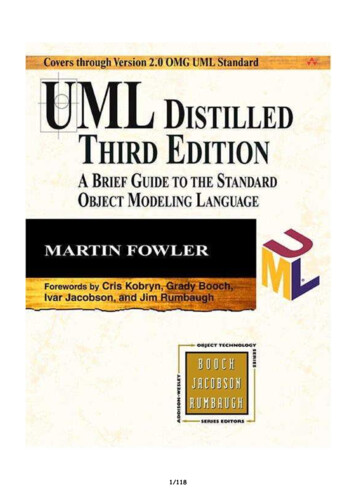
3.1. Modeling StrategyWe define the modeling strategy as the approach employed to model the classdiagram, i.e. the sequence of actions that are executed by the modeler to drawit. According to the focus and the granularity of the analysis, the modelingstrategy can be decomposed into two sub-perspectives: (1) the global modelingstrategy, i.e. the general approach followed to create the whole class diagram;and (2) the specific modeling strategy, i.e. the particular approach followed tocreate specific parts of the class diagram such as the attributes and associations.Regarding the global modeling strategy, we define in this paper two globalmodeling strategies inspired in two graph theory algorithms [24]: Breadth Modeling (see Figure 1 - left), inspired in the Breadth First Searchgraph algorithm, BFS. We consider that a class diagram is modeled following a breadth strategy when their elements are created in an orderly wayby its typology, being the most usual order: first create the classes, thenthe attributes and, finally, the associations and the rest of the elements(associative classes, data types, etc). Depth Modeling (see Figure 1 - right), inspired in the Depth First Searchgraph algorithm, DFS. We consider that a class diagram is modeled following a depth strategy when, the designer starts from an element (usually a class) and expands as far as possible every related element beforebacktracking, being the most usual order: on the basis of a class, firstincorporate their attributes, then its relations with other classes, and soon.3.2. Modeling EffortWe define the modeling effort as the “physical or mental activity needed toachieve something” 6 , in this case, modeling a class diagram. In our study, themodeling effort is evaluated in terms of time and number of clicks needed to6 h/effort7
Depth Modeling strategyBreadth ModelingStep 1:Step 1:ABAaStep 2:Step 2:ABAabaBStep 3:Step 3:ABABababFigure 1: Breadth Modeling (left) and Depth Modeling (right) strategies where the newelements on each step are highlighted.model the class diagram. According to the focus of the analysis, the modelingeffort can be studied from two points of view: (1) the effort devoted to initialization tasks, i.e. the work devoted to initialize the modeling tool and create anempty class diagram; and (2) the total modeling effort, i.e. the complete effortdevoted to modeling the whole class diagram, including the effort devoted toinitialization tasks.3.3. Modeling ObstaclesFinally, we consider the modeling obstacles as “something that blocks youso that movement, going forward, or action is prevented or made more difficult” 7 during the modeling process. In this study, we consider as obstaclesthe difficulties participants encountered with the use of modeling tools and themistakes made by the modelers while using these tools. In both cases, obstacles have been analyzed and classified under the CRUD (Create, Read, Updateand Delete) perspective, that is, the obstacles are contextualized according towhether they have arisen when the elements of the diagram are Created (C),Read (R), Updated (U) or Deleted (D).7 h/obstacle8
4. Research QuestionsAs introduced before, the overall goal of this study is to analyze how UMLclass diagrams are built and how well modeling tools support modelers on thistask. In order to study this general goal, we define three research questions:1. RQ1 : What modeling strategy do the modelers follow to specifyUML class diagrams?This RQ is centered on the first perspective of our study, the modelingstrategy (see Section 3.1). In other words, it focuses on the method tobuilt UML class diagrams, i.e. the procedure or process for attaining it.2. RQ2 : How much modeling effort (time and number of clicks) isneeded to model UML class diagrams?This RQ is centered on the second perspective of our study, the modelingeffort (see Section 3.2). In other words, it focuses on evaluating the degreeto which modeling tools support and facilitate the construction of UMLclass diagrams through its graphical interface.3. RQ3 : What are the most common obstacles (difficulties and errors) encountered by modelers when modeling UML class diagrams?This last RQ is centered on the third perspective of our study, the modeling obstacles (see Section 3.3).To answer these research questions, we carried out two studies employingdifferent research approaches. First, an empirical study based on a controlledexperiment was performed to investigate all the three above research questions.Then, an analytical study based on GOMS (Goals, Operators, Methods andSelection Rules) was performed to analyze RQ2 from another viewpoint. Thedesign and the results of both studies are detailed in Sections 5 and 6 respectively.Table 2 summarizes the outlined research questions, the perspective eachone is focused and the research approaches employed in the rest of this paperto address them.9
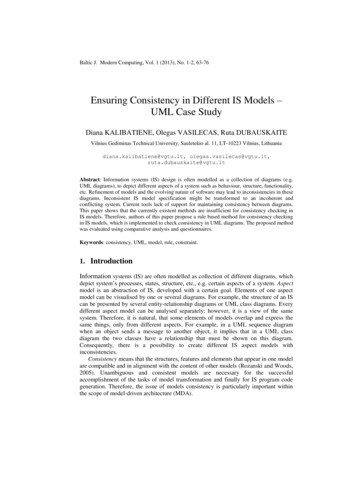
Table 2: Research questions, their perspectives and research approaches used to address them.ResearchPerspective ofquestionstudyEmpiricalEmployed Research ApproachRQ1Modeling process3RQ2Modeling effort3RQ3Modeling obstacles3Analytical3Par cipants- SE students at UOC- Voluntary parEcipaEonIndependent:- Modeling tools: MagicDraw, Papyrus- UML Diagram: Class DiagramDependent:- Strategy- Effort- Obstacles (difficulEes, mistakes) analyza bse involvesVariablesesndoExperiment goal:Analyze how UML ClassDiagrams are built usingtwo modelling toolsObjects- UML Class Diagram- Screen capture soIware- Online campus- Experiment statementes us scheduledExperiment DesignData Collec on ProcedureIndependent Measures- Group 1: MagicDraw- Group 2: PapyrusPhase 1. TrainingPhase 2. Experiment execuEonPhase 3. Data collecEon and analysisFigure 2: Experimental design.5. Controlled ExperimentThe aim of this experiment is to empirically evaluate the three perspectivesof our study described in Section 3.In the following subsections we give an overview of the experiment (seesubsection 5.1) and detail the experiment design (see subsection 5.2), the datacollection procedure (see subsection 5.3) and the results of the experiment (seesubsection 5.4). The interpretation of these results is provided in Section 7.5.1. Overview of the overall Experimental Design and ExecutionFigure 2 summarizes the experimental design in a conceptual map.5.1.1. VariablesTwo types of variables (independent and dependent) are involved in ourexperiment.10
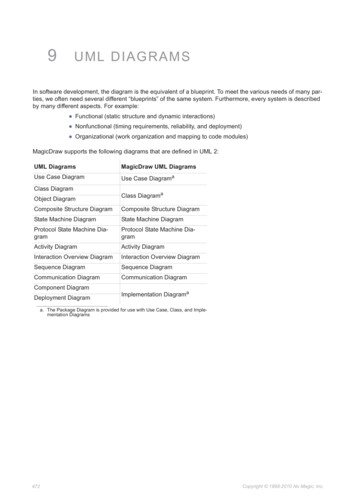
Table 3: Effort sub-variables.Initialization tasksComplete modeling processTimeTime devoted to initialization tasksTotal time for modelingClicksNumber of clicks devoted to initialization tasksTotal number of clicks for modelingThe independent variables (aka. factors or predictor variables) of ourstudy are:1. Modeling tools: We focus on two of the most popular modeling tools:MagicDraw (version 18.0 Personal Edition, from 2017) and Papyrus (Neon2.0.X version, from 2017).2. UML diagram: We select the most widely used UML diagram [18], thatis, the UML class diagram.The dependent variables (aka. response variables) of our study are:1. Strategy: As introduced before (see Section 3.1) it refers to the approachused to model the class diagram.2. Effort: As introduced before (see Section 3.2) it refers to the work devotedto model the class diagram. This variable is specialized in the sub-variablesdetailed in Table 3.3. Obstacles: As introduced before (see Section 3.3) obstacles are the difficulties with the use of modeling tools and the mistakes made by theparticipants during the modeling process.5.1.2. ObjectsThe objects used during the experiment are: UML Class Diagram: A UML class diagram (see Figure 3) was providedas an object for the experiment. It consists of three classes, an associativeclass, a data type, two associations, a generalization, and eight attributes.The given class diagram was modeled using both MagicDraw and Papyrus. Screen capture software: Students were encouraged to use one of the following available screen capture software to record their videos: Screencast11
O-Matic8 (free, online, available for windows/mac), Recordmydesktop9(open source, linux), Camstudio10 (free, available for windows) or Camtasia11 (trial license, available for windows/mac), although they could chooseany other software. Online campus of the university: The UOC online campus12 , where allthe courses are taught, was the platform used to send the individual participation invitations. Experiment statement: The experiment statement provided the instructions to participate in the experiment. These instructions included threeactions: (1) to model the provided UML class diagram using the assignedtool (MagicDraw/Papyrus); (2) in parallel, to record the entire modeling process using the screen capture software; and (3) finally, to send therecorded video through the online campus of the university. Besides, atthe beginning of the video, students were asked to provide informationabout their previous experience with modeling and modeling tools. Also,they were encouraged to verbalize their impressions, doubts and difficultiesduring all the modeling process. The experiment statement was exactlythe same for both groups.5.1.3. ParticipantsThe target participants of our experiment are undergraduate students enrolled in a Software Engineering course at the Universitat Oberta de Catalunya(UOC), an online university. This course is a mandatory subject within theComputer Science degree, where modeling is introduced for the first time. Atthe beginning of the course, students receive a list of suggested modeling toolsthey can use, although students can freely choose the tool they will use.8 www.screencast-o-matic.com9 www.recordmydesktop.sourceforge.net10 http://camstudio.org/11 op12 www.uoc.edu12
Task-name : StringPeriodicTaskWorker0.1*0.1-periodicity : String-name : String*relatedTo dataType DateAgreement-day : Integer-month : Integer-year : Integer-from : Date-to : DateFigure 3: UML Class Diagram of our experiment.The participation of the students in the experiment was voluntary, that is,although all the students enrolled in the course were invited to participate,only a subset of them chose to participate. To motivate their participation, allparticipants were rewarded with an extra score at the final grade of the course.5.1.4. SampleThe experiment was conducted under the context of the TeSLA project13 , aproject funded by the European Commission and coordinated by the Open University of Catalonia (UOC). Roughly, the TeSLA project provides to educationalinstitutions, an adaptive trust e-assessment system for assuring e-assessmentprocesses in online and blended environments. It aims to support both continuous and final assessment to improve the trust level across students, teachersand institutions. In 2017, the Software Engineering course participated in a pilot of the TeSLA project, where all the enrolled students could chose voluntary13 www.tesla-project.eu/partner/uoc13
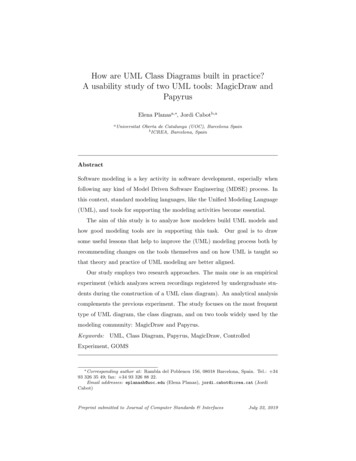
0%20%40%60%80%100%Figure 4: Expertise level of the participants with MagicDraw and Papyrus.to participate. All participants signed an informed consent to agree the datacollected during the pilot and their uses.A total of 202 students were enrolled in the course. Although a total of 65students (32% of the enrolled students) were initially interested to participatein our experiment, the participation in the study was finally comprised for atotal of 45 students (i.e. 20 students drop out) - 4 women (9%) and 41 men(91%) -, representing the 22% of the total students enrolled in the course. Theexpertise level of the participants with the tools before executing the experimentwas captured. As shown in Figure 4, the experience of the participants usingboth modeling tools, according to her own point of view, was low, althoughthe students which used MagicDraw reported a little more expertise wrt thestudents which used Papyrus.5.2. Experiment DesignThe experimental design applied to conduct this study is independent measures. An independent measures design assigns participants to separate groups.Each of the groups is then designated to a single research condition.In our experiment, the participants were allocated into two experimentalgroups, according to the group to which they were enrolled. This explains thedifferent size of both groups (the first group had 27 participants, while thesecond group had 18 participants). A different modeling tool was assigned to14
each group to conduct the experiment: the first group used MagicDraw and thesecond group used Papyrus. The participants did not know their assigned toolin advance.The experiment was conducted at the end of the semester, so the studentswere trained about modeling UML class diagrams before participating at theexperiment.The experiment was limited to 15 minutes, so if the students had not beenable to model the diagram at that time, they had to abort the process. In orderto process the data, we fix a total time of 15 minutes to those students whodid not complete the task. We do not omit these observations since they areinteresting regarding the modeling strategy and specially the modeling obstacles.5.3. Data Collection ProcedureThe experiment was planned in a term with the following schedule: Weeks 1 to 11: Training. Before conducting the experiment, the participants, together with the rest of their classmates, were trained aboutmodeling with UML. This phase includes training on the construction ofUML class diagrams with the tool chosen by the students (which was notnecessarily the tool used during the experiment). Weeks 11 to 14: Experiment execution. The experiment was releasedat the 11st week of the semester and the students had exactly three weeksto run the experiment, i.e. to download the instructions from the onlinecampus, to learn the assigned tool, to record their videos and deliver themthrough the online campus again. After week 14: Data Collection and Analysis. Finally, all the videoswere downloaded and manually analyzed by the researchers. For eachvideo, we manually collected data from the three variables of the study:– Strategy: After the visualization of the each video, the strategy usedto model the whole class diagram was classified into Breadth Modeling, Depth Modeling or alternating strategy. In a similar line, other15
behaviours observed during the modeling of other specific elements(like classes or attributes) were manually collected.– Effort: The time as well as the number of clicks devoted to model thewhole class diagram was manually computed during the visualizationof each video.– Obstacles: The obstacles (difficulties and errors) encountered bymodelers during the experiment were manually collected during thevisualization of each video.To analyze each video, it was (re)reproduced and paused repeatedly tocarefully collect all the relevant information. The videos were analyzedprimarily by one of the researchers. Anyway, in order to validate ourstudy, 18% of them were also analyzed by both researchers.5.4. ResultsThis section summarizes the results of the collected data from our experimentregarding the three study perspectives: the modeling strategy (Section 5.4.1),the modeling effort (Section 5.4.2) and the modeling obstacles (Section 5.4.3).These results are analyzed and interpreted in Section 7 together with the resultsof the analytical experiment.A total of 45 observations, more than 12 hours of screen recordings, wereanalyzed, 27 (60%) of which used MagicDraw and 18 (40%) of which usedPapyrus.5.4.1. StrategyAs introduced before, the strategy variable refers to the approach used tomodel the class diagram.Global modeling strategyFigure 5 reports the global modeling strategy during the construction of thewhole class diagram. The chart on the left (blue) shows the data of the first16
ure 5: Modeling strategies followed by the participants during the construction of thewhole class diagram.group (MagicDraw), the chart on the middle (yellow) shows the data of thesecond group (Papyrus) and the chart on the right (grey) shows the averagebetween both tools. As can be seen in Figure 5, the participants followed thetwo previously introduced strategies (breadth and depth modeling) in a balancedway in both groups: an average of 51% of the participants (52% in the 1st group(MagicDraw) and 50% in the 2nd group (Papyrus)) used the breadth modelingstrategy, in front of an average of 42% of the participants (41% in the 1st group(MagicDraw) and 44% in the 2nd group (Papyrus)) that used a depth modelingstrategy. To a lesser extent, an average of 7% of the participants (7% in the 1stgroup (MagicDraw) and 6% in the 2nd group (Papyrus)) modeled the diagramfollowing an alternating strategy. As can be seen, in average, there is no relevantdifference in terms of global modeling strategy depending on the modeling tool.On the other hand, we want to highlight that in 93% of the cases the firstelement modeled was a class, whereas in only 7% of the cases the first was thedata type Date.Specific modeling strategyRegarding the specific modeling strategy involving the creation of attributesand associations, we analyze the specific order in which their properties (name,multiplicity, visibility, etc.) were updated.During the creation of the attributes, in most of the cases in both groups,the first specified property was its name, followed by its type and, only in some17
%40%60%80%100%Figure 6: Initialized properties during attribute’s modeling.cases, its visibility and multiplicity in random order. As can be seen in Figure6, 98% of the participants (96% in MagicDraw and 100% in Papyrus) indicatedthe name of the attributes and 80% (85% in MagicDraw and 72% in Papyrus)also indicated its type. On the other hand, only 22% of the participants (7% inMagicDraw and 44% in Papyrus) indicated the visibility of the attributes and20% (11% in MagicDraw and 33% in Papyrus) indicated its multiplicity. In allthe cases, the most usual order to modify the properties of the attributes was:name, type and visibility/multiplicity (these last two alternately).During the creation of the associations, in most of the cases in both groups,the first specified property was its multiplicity, followed by its name and, only ina few cases, its navigability and the role names in random order. As can be seenin Figure 7, 87% of the participants (100% in MagicDraw and 67% in Papyrus)indicated the name of one or more associations an
dents during the construction of a UML class diagram). An analytical analysis complements the previous experiment. The study focuses on the most frequent type of UML diagram, the class diagram, and on two tools widely used by the modeling community: MagicDraw and Papyrus. Keywords: UML, Class Diagram, Papyrus, MagicDraw, Controlled Experiment, GOMS