Transcription
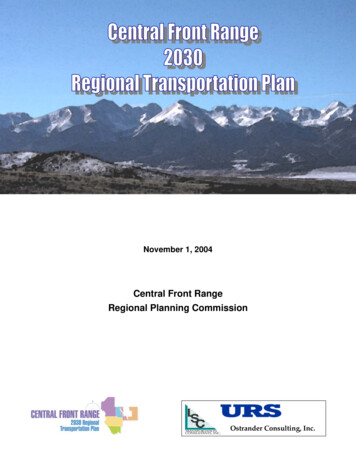
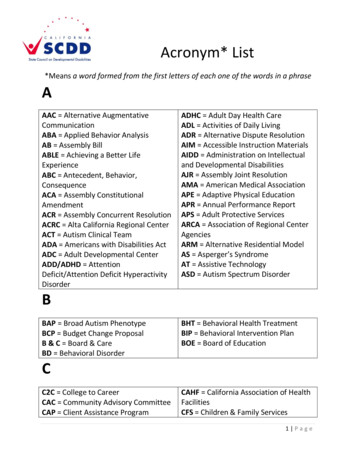
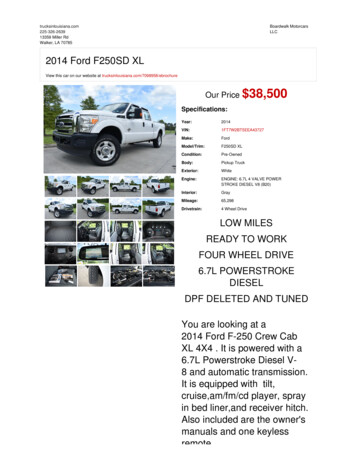
LARIMERCOUNTY28711425The North Front Range2030 RegionalTransportation PlanWELD COUNTYLARIMER COUNTYNorth Front Range2030 Regional Transportation 25392WindsorLoveland37257342633485 BypassGreeley3434 287Berthoud256258560Envisioning Transportation Solutions forColorado’s North Front RangePrepared by:North Front Range Metropolitan Planning OrganizationWith Assistance From:Felsburg Holt & UllevigOctober 2004
THE NORTH FRONT RANGE2030 REGIONAL TRANSPORTATION PLANPrepared by:North Front RangeMetropolitan Planning Organization235 Mathews StreetFort Collins, CO 80524With Assistance From:Felsburg Holt & UllevigOctober 2004
TABLE OF ------------------------- iI.INTRODUCTION ------------------------------------------ 1A.Values, Vision, Goals And Strategies ------ 1B.Project Background ----------------------------- 3C.Planning --------------------------------------- 5D.Other -------------------------------------------- 7E.Summary of Public Participation Process - 9II.EXISTING TRANSPORTATION SYSTEM --------12A.Regionally Significant Corridors ------------12B.Roadway -------------------------------------15C.Freight -----------------------------------------32D.Rail System --------------------------------------34E.Bicycle And Pedestrian System ------------36F.Transportation Demand Management Program tion Facilities -------------------------------37H.Intelligent Transportation System --------39I.Transit System OMIC/ENVIRONMENTAL PROFILE Socio-Economic Data -------------------------80B.Population Characteristics -------------------91C.Environmental ---------------------------------97IV.TRAVEL DEMAND ANALYSIS --------------------- --- 103B.Travel Demand Growth --------------------- 103V.VISION PLAN ------------------------------------------- 110A.Corridor -------------------------------------- 110B.Project Prioritization --------------------- 114C.Project Lists and Priorities ----------------- 116VI.2030 FISCALLY CONSTRAINED PLAN --------- 157A.Funding Estimates --------------------------- 157B.Restricted and Committed Funding ---- 159C.Resource Allocation ------------------------- 161D.Fiscally Constrained Plan ------------------ 162E.Cross Category Prioritization -------------- 168F.CDOT -------------------------------------- 179
TABLE OF CONTENTS (Continued)PageVII.CONGESTION MANAGEMENT SYSTEM ------ 181A.Introduction ------------------------------------ 181B.Background Information -------------------- 181C.Framework ------------------------------------- 182D.Next Steps ------------------------------------- 185VIII.FUTURE PLANNING PROCESS ------------------ 186A.Regional Transportation Plan ------------- 186B.Plan Amendment Process ----------------- 186C.Transportation Improvement --------- 187APPENDIX AAPPENDIX BAPPENDIX C.APPENDIX DSTRATEGIC ACTION PLANPUBLIC INVOLVEMENTAIR QUALITY CONFORMITYCORRIDOR VISIONS
LIST OF FIGURESPageFigure I-1Figure I-2North Front Range Planning --------------- 4Plan Development Process ------------------- 6Figure II-1Figure II-2Figure II-3Figure II-4Figure II-5Figure II-6Figure II-7Figure II-8Figure II-9Figure II-10Figure II-11Figure II-12Figure II-13Figure II-14Figure II-15Figure II-16Figure II-17Figure II-18Figure II-19Figure II-20Figure II-21Figure II-22Figure II-23Figure II-24Figure II-25Figure II-26Regionally Significant Corridors - ----13Regionally Significant Corridors – Bike Paths and Rail Lines-------------------------142000 Average Daily Traffic Volumes in the North Front Range ----------------------18Roadway Surface Conditions ---------------20National Highway System --------------------22Hazardous and Nuclear Materials Routes 3Bridges with ---------------------------------26Property Damage Only Accident -------30Injury and Fatality Accident Locations ----31Truck Traffic -------------------------------------33Rail System --------------------------------------35Airports --------------------------------------------38ITS Study --------------------------------------40CDOT ITS Inventory ---------------------------43City of Fort Collins ITS Inventory -----------44City of Greeley ITS -------------------------45City of Loveland ITS Inventory --------------46Town of Windsor ITS Inventory -------------47Transfort Transit ----------------------------49FoxTrot Regional Bus Route ----------------51COLT Service Area ----------------------------54COLT Transit --------------------------------55The Bus Transit Service Area ---------------59The Bus Transit -----------------------------60Rocky Mountain National Park Service ---64Rural Transit Service --------------------------66Figure III-1Figure III-2Figure III-3Figure III-4Figure III-5Figure III-6Figure III-7Figure III-8Figure III-9Figure III-10Figure III-11Figure III-12North Front Range Modeling -----------81Future Land -----------------------------------832000 Employment ------------------------------842030 Employment Forecasts ----------------852000 -----------------------------------------862030 Household Forecasts ------------------872000 Major Employers ------------------------90Larimer County Age ------------------------91Weld County Age Distribution ---------------92Minority Populations ---------------------------94Low Income Households ---------------------968-Hour Ozone Non-attainment -----------98
LIST OF FIGURES (Continued)PageFigure IV-1Figure IV-2Figure IV-3Figure IV-4Figure IV-5Figure IV-62000 Roadway System LOS -------------- 1042030 No Build Roadway System LOS -- 1052030 Build Roadway System LOS ------- 1052000 Base Level of ----------------------- 1062030 No Build Level of Service ----------- 1072030 Build Level of ----------------------- 108Figure V-1Figure V-2Figure V-3East-West Corridors ------------------------- 111North-South -------------------------------- 112Bike and Rail Line ------------------------ 113Figure VI-1Figure VI-2Figure VI-3Figure VI-4Figure VI-5Figure VI-6Figure VI-7Flexible Funding Allocation ---------------- 162Restricted & Committed Funds ----------- 163Total Funds ------------------------------------ 163Fiscally Constrained Plan in Fort Collins Area ------------------------------------------ 164Fiscally Constrained Plan in the Greeley Area------------------------------------------ 165Fiscally Constrained Plan in Loveland Area --------------------------------------------- 166Fiscally Constrained Plan Outside of the City Areas ---------------------------------- 167
LIST OF TABLESPageTable II-1Table II-2Table II-3Table II-4Table II-5Table II-6Table II-7Table II-8Table II-9Table II-10Table II-11Table II-12Table II-13Table II-14Table II-15Table II-16Table II-17Table II-18Table II-19Table II-20Table II-21Table II-22Table II-23Table II-24Table II-25Table II-26Table II-27Table II-28Table II-29Lane Miles by Functional Classification in the North Front Range Region --------17Lane Miles by Functional Classification for Regionally Significant Corridors -----17Roadway Surface Conditions of State Highways ----------------------------------------19Bridges with ---------------------------------24Accidents on State Highways in the North Front Range -------------------------------27Accident Rates on State Highway Segments in the North Front Range -----------28Total Accidents on State Highway Segments in the North Front Range -----------29Existing Commodity Flows (1998) ---------32ITS Element Inventory ------------------------412003 Transfort Route Information ----------50Transfort Fixed-Route Operating Statistics - 1999-2003 -------------------------------52Transfort Dial-A-Ride Operating Statistics - 1999-2003 --------------------------------52Transfort Performance Measures ----------52COLT 2003 Ridership by Route ------------56COLT Fixed-Route Operating Statistics - 1999-2003 -----------------------------------56COLT Mini Bus Operating Statistics - 1999-2003 ----------------------------------------57COLT Performance Measures --------------57The Bus Ridership by ----------------------61The Bus Fixed-Route Operating Statistics - 1999-2003 --------------------------------62The Bus Paratransit Operating Statistics - 1999-2003----------------------------------62The Bus Performance Measures -----------62RMNP Performance Measures -------------65BATS Operating Statistics (Demand Response) 1999-2003--------------------------67BATS Performance Measures --------------68Ridership and Level of Service in Estes Park ed-Route Performance --------------73Demand Response Performance Measures nGo Service Levels and --------------74Greyhound/TNM&O Schedule --------------76Table III-1Table III-2Table III-3Table III-4Table III-5Table III-6Table III-7Table III-8Table III-9Household Size and Income Data – Year 2000 old Size and Income Data – Year 2030 fication of --------------------------89Percent of Vehicles Available by Household mmute to Work by ----------------------93Low Income Thresholds ----------------------95State and National Historic Sites -----------99Agricultural Production Statistics --------- 101Listing of Federal and State Threatened and Endangered Species(obtained from USFWS and CNHP) ----- 102Table IV-1Table IV-2Growth in Vehicle Miles of Travel -------- 103Existing and Forecasted Commodity Flows --------------------------------------------- 109
LIST OF TABLES (Continued)PageTable V-1Table V-2Table V-3Table V-4Table V-5Table V-6Table V-7Transit Projects ------------------------------- 119Bike/Pedestrian ------------------------------- 125Highway/HOV --------------------------------- 128Transportation System -------------- 149Transportation Demand Management -- 152Passenger and Freight -------------------- 153North Front Range 2030 Aviation ----- 155Table VI-1Table VI-2Table VI-3Table VI-4Available Funding Sources (in millions) -------------------------------------------------- 157Funding Restrictions and Commitments (in millions)---------------------------------- 160Resource Allocation (in millions) --------- 161Cross Category Prioritization -------------- 169
PREFACEThe North Front Range Metropolitan Planning Organization (NFRMPO) is a federallydesignated transportation planning organization and state-designated air quality planningagency. Federal transportation funding to a region’s governments requires the organization ofan MPO whenever an urbanizing area reaches a population of 50,000 or more There are twourbanized areas in the North Front Range – Fort Collins / Loveland / Berthoud and Greeley /Evans / Garden City / LaSalle.The NFRMPO is comprised of 13 member governments (Larimer County, Weld County, FortCollins, Greeley, Loveland, Windsor, Berthoud, Evans, Johnstown, Milliken, La Salle, GardenCity and Timnath), covering 1600 square miles and working on behalf of almost 350,000northern Colorado residents. Membership is also held by the Colorado TransportationCommission and the Colorado Air Quality Control Commission.The MPO’s objective is to provide the information, tools and public input needed for improvingthe regional transportation system’s performance in the North Front Range. The MPO engagesin cooperative decision-making through working relationships and financial partnerships amongthe member governments, the Colorado Transportation Commission, the Colorado Departmentof Transportation, the Federal Highway Administration, the Federal Transit Administration andthe Colorado Air Quality Control Commission.BackgroundEight out of ten people in the United States reside in 385 federally-defined metropolitan areas.These metropolitan areas produce more than 85 percent of the nation’s economic output. Theyalso generate 84 percent of America’s jobs. Unfortunately, these crucial economic engines ofthe nation also have some of the worst urban problems: Growing congestion as regional economies expand in low-density growth patterns. Increasing dependency on the car in order to accommodate sprawl. Growing regional mismatch between the location of jobs and residences of workers asemployment continues to decentralize. Americans are now spending more on transportation than ever before; sprawlingmetropolitan communities require families to drive longer and more often to satisfy their dailyneeds.- Brookings Institution Report “TEA-21 Reauthorization: GettingTransportation Right for Metropolitan AmericaPage i
The growing mismatch between the location of jobs and worker residences is also reflected inthe 2001 North Front Range Household Survey. This research indicates that 17% of FortCollins’ workforce is employed outside the city, while 30% of Greeley’s workforce leaves foremployment outside the city and 45% of Loveland’s workforce leaves Loveland every workday.That figure climbs to over 90% for many of the smaller communities in the North Front Range.The “regionalization” of the housing market has begun in earnest as many families “drive toqualify” by purchasing homes in communities such as Evans, Berthoud, Eaton, Ault, Johnstown,Windsor, etc.These new residents then take to the highways each workday, driving an average of 18 mileseach way for employment. Only about 6% of these workers drive to Denver. Another 6% driveto the Longmont-Boulder area. So the majority of North Front Range residents crisscross theregion each workday for their jobs, and many do so for shopping and medical services as well.A metropolitan planning organization is the most appropriate type of institution for dealing withthese kinds of issues since it is truly regional in scope and formation.Strategic Action PlanThe MPO Planning Council has adopted a Long-Range Strategic Action Plan to guide thefunctions and activities of the NFRMPO. This process was initiated so that the locally-electedofficials of this region, sitting as members of the MPO Planning Council, have a clear frame ofreference for the direction they want their organization to take in the future.The cities and towns of the North Front Range are all growing together; the resulting growthpatterns increase this region’s dependency on the private automobile. Regional perspectiveshave become more necessary in the provision of transportation improvements and services.The 2001 Household Travel Survey showed the interconnection of this region’s cities andtowns. North Front Range residents travel back and forth across the North Front Range to getto jobs, medical appointments, shopping and recreation. This region has come to fully realizehow “connected” individual jurisdictions are to one another.Envision the North Front RangeAs part of the Long-Range Strategic Action Plan, a new initiative entitled “Envision the NorthFront Range” has been advanced. MPOs have historically ignored, or perhaps misunderstood,the fundamental connections between land use, housing and transportation (Brookings InstitutionReport “TEA-21 Reauthorization: Getting Transportation Right for Metropolitan America). Transportationproviders have usually been placed in a position where they merely react to facility demandscreated by land use decision-making. This has been particularly true for state departments oftransportation (DOTs) as they “react” to incremental local land use decisions by increasingcapacities of highways and major arterials through purchases of residential front yards orthrough the process of buying out adjacent homeowners and businesses altogether.Page ii
States and local governments that cooperate and collaborate on such issues can avoid theseincredibly expensive “fixes.” This is where MPOs can be most effective – in buildingcollaborative “bridges” between localities and DOTs. It is very difficult to create collaborativerelationships on a one-by-one basis, but on a regional basis it has been shown to work quitewell – where governmental entities are willing.Nationwide, transportation advocates have begun to realize that it is impossible to “build ourway out of congestion” through road and highway improvements alone. A combination ofsolutions is necessary. MPOs are multi-modal planning organizations working at the local leveland are, therefore, in the best position to use transportation planning in tandem with land use,housing, workforce, and economic development policies.This is where the MPO Planning Council can truly make a difference – by “envisioning” afuture state of the region and then expanding its role by becoming ambassadors to the rest ofthe elected and appointed officials of the North Front Range regarding facts, trends andunderstandings gained from the “Envision the North Front Range” process.Designation as Transportation Management Agency (TMA)As of October 1, 2002, the North Front Range MPO became a Transportation ManagementAgency (TMA) by way of the U.S. Census creating one huge "urbanized area” out of FortCollins, Loveland, Berthoud and parts of Larimer County, putting that urbanized area’spopulation over the 200,000 mark – an important population threshold for MPOs.The federal requirements for a TMA-type of MPO are the same as they are for a small MPO, butwith some additional responsibilities. The most important change that occurs when a small MPObecomes a “big” MPO – like the Denver Regional Council of Governments (DRCOG) and thePikes Peak Area Council of Governments (PPACG) – is that the North Front Range MPO is nowevaluated in a Certification Review every three years. This MPO will now be judged on itsperformance as an MPO as per federal regulations by the Federal Highway Administration, theFederal Transit Administration and the Environmental Protection Agency.The North Front Range MPO’s Certification Review will be in July of 2005. The Federal HighwayAdministration performed a “mock” certification review during the summer of 2004 to helpprepare the staff for the following year.Congestion Management System (CMS)The Federal Highway Administration (FHWA) requires a congestion management system for allTMAs. FHWA defines a CMS as:“ a systematic process for managing congestion that providesinformation on transportation system performance and on alternativestrategies for alleviating congestion and enhancing mobility.”Page iii
The purpose of the CMS is to define congested corridors in the region, develop strategies tomitigate the congestion, and provide a way to monitor the effectiveness of the strategies. FHWArequires that consideration be given to strategies that reduce single occupancy vehicle (SOV)travel and that improve the efficiency of the existing system. All reasonable strategies must beanalyzed before a capacity increase is proposed as a mitigation technique.North Front Range Transportation FundingThe Colorado Transportation Commission needs 2.3 billion a year to keep up with the costs ofmaintenance and congestion. This year they have 790 million, which is expected to decreaseannually. Most of the state’s future federal funds have already been mortgaged for TRANSfunded projects. The fuel user fee, or so-called “gas tax,” has not been raised in Colorado forover a decade. Since 1957, the gas tax has lost over 800% of its purchasing power. It hasbeen estimated that state legislatures across the country would have to immediately raise thegas tax 11 cents per gallon to re-capture the purchasing power of 1957. The Coloradolegislature has shown no inclination to do this.Therefore, Rural Transportation Authorities, local and municipal improvement districts, andother locally-created revenue generators will be necessary to make needed transportationimprovements in the North Front Range, as well as in the rest of the state. This region will haveto have incredibly sound transportation data to develop the necessary consensus amongcooperating groups with competing needs trying to decide on what to do, how to do it, and whopays what part.OutlookThere have been many changes at the North Front Range Metropolitan Planning Organization(MPO) since the last RTP was completed three years ago. In July 2001, the Planning Councilhired its first, full time Executive Director, who was given a clear mandate to make the MPO amore independent organization. In July 2002, the MPO was designated a TransportationManagement Agency (TMA) by the United States Department of Transportation as a result ofthe 2000 Census. With that designation came new responsibilities for the MPO along withsome limited, new funding from the Federal government.There are many changes to come at the North Front Range MPO as the move towardindependence and progress toward certification as a TMA continue. At the same time,transportation funding from the State has dwindled, yet the needs of local governments fortransportation solutions have grown. Challenges and opportunities abound, and the MPO is in astrong position to respond to both.Page iv
I.INTRODUCTIONA.Values, Vision, Goals And StrategiesVALUE STATEMENTRecognizing the unique character of the region, we will provide anenvironmentally, socially and economically sensitive multi-modaltransportation system, for all users, that protects and enhances theregion’s quality of life.Vision Assure that residents have adequate access to the process of transportation and air qualityplanning and project selection. Foster a transportation system that will effectively address the current and future needs ofthe region within fiscal constraints. Encourage local governments to work together as a council to develop a balanced approachto providing: System capacity Alternative transportation choices Interconnectivity with other regions Integration of transportation, land use and air quality planningGoals To provide a safe, balanced, multi-modal transportation system that can move people,goods and information quickly and efficiently. To foster regional coordination and transportation system continuity. To connect modal systems. To minimize congestion on the transportation system. To address the needs of the transportation disadvantaged. To ensure adequate maintenance of the transportation system. To minimize negative environmental impacts and improve air quality.Page 1
To support land use consistent with comprehensive plans. To provide a positive economic impact. To identify funding needs and to explore and support all potential approaches to fulfill thoseneeds.Strategies Land Use/Transportation Connection - Land use and transportation planning need to beintegrated. Counties, cities, and towns in the MPO should have land use policies andpatterns that support and are supported by efficient and cost-effective local and regionaltransportation systems. All local governments should have transportation impact fees or asimilar program, and should have adopted an adequate public facilities regulation. Multi-Modal Options - Residents should be able to choose from a number of regional andinter-regional transportation options, including passenger rail and air transportation. Allmodes of transportation should be inter-connected, and travel and transfers should beaccomplished without inconvenient delays. Regionally Significant Corridors - A network of Regionally Significant Corridors should beestablished based upon travel demand and connections between major North Front Rangeand surrounding communities and activity centers. Regional planning and transportationinvestments should focus on maintaining efficient, multi-modal mobility along these strategiccorridors. All corridors should be multi-mo
The North Front Range 2030 Regional Transportation Plan Envisioning Transportation Solutions for Colorado's North Front Range North Front Range 2030 Regional Transportation Plan Prepared by: North Front Range Metropolitan Planning Organization With Assistance From: Felsburg Holt & Ullevig October 2004 ARMER COUNT WE COUNT ARMER COUNT