Transcription
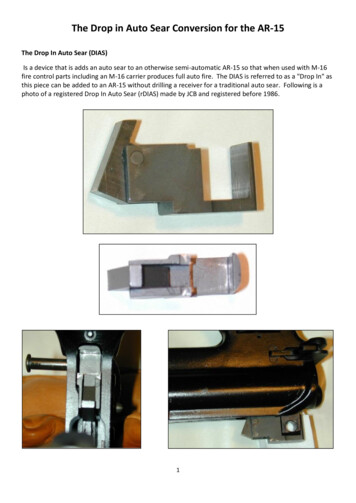
UltrasoundWhite paper3D Auto RV —right ventricular quantificationAnke Sedlmeier, Senior Product Manager, TOMTECDavid Prater, MS, Clinical Scientist, PhilipsOverviewThere are several measurements for right ventricular (RV) function in 2Dechocardiography, for example Fractional Area Change (FAC), Tricuspid AnnularPlane Systolic Excursion (TAPSE) and Right Ventricular Index of MyocardialPerformance (RIMP). The limitations of 2D measurements for RV assessmentare well-known. Foreshortening and geometric assumptions make 2D not wellsuited for quantification.The importance of RV function has been underestimatedThese limitations can be overcome by using 3D.due to enormous attention given to the evaluation of theWith the growing availability of 3D techniquesleft heart, lack of familiarity with ultrasound techniquessuch as magnetic resonance (MR) imaging and 3Dthat can be used in imaging the right heart, and theechocardiography, assessment of shape and functionalcomplexity of the RV shape and anatomy (Figure 1).changes in the right ventricle becomes feasible.Three-dimensional modalities offer exceptionalFigure 1Compared tothe left ventricle(left), the rightventricle shape(right) is muchmore complex.accuracy and reproducibility in the assessmentof RV shape and function.
RV auto-segmentationAlthough MR has excellent intra- and inter-observerAuto-segmentation technology is based on a deformablevariability, it is expensive, not widely available, and cannotmodel which consists of a boundary detector and multiplebe performed in patients with special conditions such asshape models of the RV. The boundary detector usesmetallic implanted devices, claustrophobia and irregularinformation from both image gradients and the distributionheart rhythm.of the image grayscale values. The shape models consistof a mean shape and shape modes, with the shape modesThree-dimensional echocardiography is available and wellaccounting for the shape variations due to differences invalidated against the gold standard MR. The latest guidelineanatomy and pathology. The auto-segmentation processrecommends 3D echocardiography measurements of RVbegins with an initial boundary estimate used to selectwhen knowledge of RV volumes may be clinically important.the best-fitting shape model. The final boundary is abalance between the initial boundary and the selectedTOMTEC has extensive experience in 3D RV measurements.shape model. Both the boundary detection and the4D RV-FUNCTION has been part of the TOMTEC portfolioshape models utilize artificial intelligence and are trainedsince 2006. Evolving from 4D RV FUNCTION, the 3D Autousing a large number of clinical images annotated byRV enhanced workflow and performance is powered byechocardiographic experts.machine learning artificial intelligence, making it feasiblefor routine clinical use. This on-cart availability and its3D Auto RV maintains all the manual functionality of theautomated workflow within the application accelerateTOMTEC 4D RV-FUNCTION software, including Viewthe process of measuring RV values.Adjustment and Tracking Revision. Auto-segmentationdoes these two steps automatically but the user may stilldo them manually. This functionality provides the speed3D echo quantificationon right ventricleThe 3D Auto RV application combines proven TOMTECexperience in RV analysis software with Philips machinelearning artificial intelligence similar to HeartModel A.I.Auto-segmentation provides the initial image alignmentand contour positioning. These operations significantlyreduce, and in many cases eliminate, the manual imageadjustments needed for RV analysis. The result is bothfaster analysis and improved reproducibility.2and robustness of automatic operation with the flexibilityof manual adjustment.
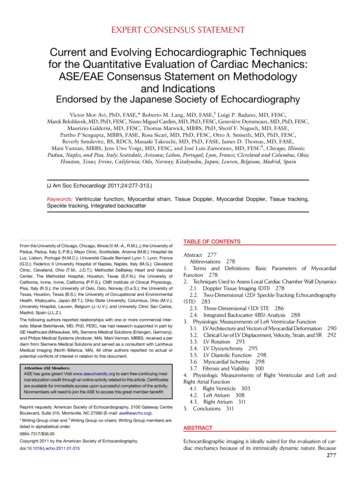
3D Auto RV operationThe 3D Auto RV application is initiated via a touchpanelThe model is tracked over the entire cardiac cycle usingbutton labelled 3D Auto RV. The auto-segmentation processspeckle tracking technology. The resulting dynamicis executed and the user is shown the Tracking Revisionsurface model can optionally be adjusted by the user inworkflow step (Figure 2). If the user is satisfied with theend-diastole (ED) or end-systolic (ES). To edit, the user justtracking, they can proceed directly to the Analysis workflowdrags the contour line in ED or ES. There are different penstep where the dynamic 3D volume (Beutel) is shown alongsizes depending on the area the user wants to change.with the volume waveform and numerical results. For easyIf more editing is needed, it is highly recommended to startnavigation, the work-step list is shown on the side of theediting in ED and re-track. If initial model fails completely,View Adjustment and Tracking Revision workflow steps.landmarks in the view adjustment state should be checkedA minimum of 10 volumes per second are required to ensureand adjusted.the quality of volume analysis.When leaving the application out of Tracking Revision andThe entry point for the standard TTE acquisition inactivating the “Accept Measurements” checkbox, all globalautomatic mode is the Tracking Revision workflow step.values are saved.This screen shows the RV model and corresponding2D contours over the complete heart cycle.Figure 2 Tracking revision workflow step.3
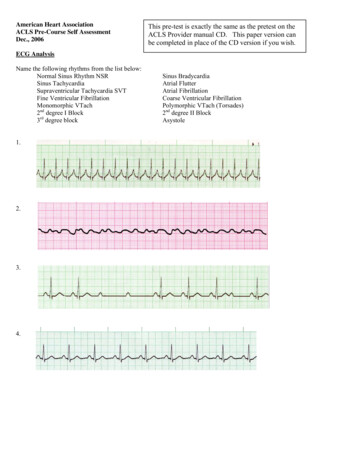
View adjustmentIn the View Adjustment workflow step, the user canFigure 4 Modelwith global results.manually adjust the image landmarks (Figure 3).At end-diastole, the left and right ventricular long axesare set to define a basic coordinate system. Based on that,a RV-focused four-chamber view and a short-axis vieware derived by the system. Also, the heart cycle to beanalyzed can be changed in this state.In the View Adjustment workflow step, the followinggeneral settings can be adjusted: Default acquisition window (TTE, subcostal)Analysis Automatic start in tracking revision3D volumes over time are computed numerically(only available for TTE)from the dynamic surface model and used to calculate Change default heart cycleend-diastoic volume (EDV), EDVi*, end-systolic volume Change default pause time (pause time in view(ESV), ESVi*, ejection fraction (EF) and systolic volumeadjustment to set landmarks)(SV) (Figure 4). Additionally, the surface model is View orientation (apex up/down)intersected with the RV-focused four-chamber view Change default layout (in tracking revision)to derive standard 2D measurements (RVLS, TAPSE, Result display sizeFAC and distances) from the same geometry. ES and EDare identified as the frames with the lowest and largestventricular volumes. The volume over time is alsodisplayed in a volume-versus-time curve.When leaving the application out of Analysis andactivating the “Accept Measurements” checkbox,all global and 2D measurement results are saved.Figure 3 View Adjustment.*Indexed values are calculated if patient weight and height is available.4
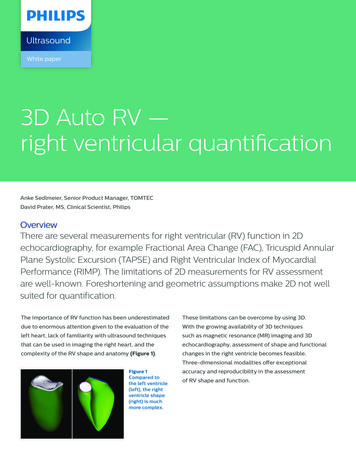
Validation4D RV-FUNCTION is well validated with many papers.4,5,6EDV results from the auto-segmentation were comparedto expert manual adjustment of the image alignment andcontour position for 73 data sets. Shown in Figure 5 is thecorrelation plot of the EDV for the auto-segmentationversus the manual adjustments for the 73 data sets.The R-value is 0.79.For 65% of the data sets, the EDV from the auto-segmentationwere within 15% of the manual adjustments, and for 49%of the data sets the automatic results were within 10%of the manual results.3D Auto RVAutomatic data250y 1.0352xR2 0.633820015010050050100150200250Clinical dataFigure 5 Correlation plot of EDV for auto-segmentation versus manual adjustments.5
Frequently asked questionsAre the results the same on-cart as off-cart?How does the software define ED and ES time points;Yes, the application on- and off-cart is identical.can they be edited?ED and ES are defined as time points of largest (ED)How is the RV longitudinal strain (LS) measured?and smallest (ES) volume. The time points are definedThe RV LS is calculated from the four-chamber view whichafter tracking in the Tracking Revision workflow step.is derived from the 3D data set. The frame rate may not beThe blue flags of the electrocardiogram (ECG) areoptimal for strain calculation.positioned accordingly.Is there a minimum volume rate required?They cannot be edited.To ensure the quality of the results, we require a minimumvolume rate of 10 volumes per second and a minimum ofHow does 3D Auto RV detect the borders? Does it use10 volumes per heart cycle.speckle tracking?The boundary detection utilizes information from bothThe ASE Recommendations for Cardiac Chamberimage gradient and the distribution of the image grayscaleQuantification by Echocardiography recommendsvalues. The shape models consist of a mean shape anda temporal resolution of more than 20–25 volumesshape modes, with the shape modes accounting for shapeper second.variations due to differences in anatomy and pathology.The model is tracked over the entire cardiac cycle usingWhat is the meaning of the color difference?speckle tracking technology. To ensure a consistent shape, user interaction is confinedWhat landmarks does it use for tracking?to parts of the RV surface model. The user can identify editable regions by the light greenintersection contours.No individual landmarks are used for tracking, but rathersections of the 3D model contour. Additionally, valve annulus geometry can be modified(purple: pulmonary valve, blue: tricuspid valve) (Figure 6).What is 3D Auto RV validated against?Refer to validation section.Figure 6 SAX viewwith pulmonary valveside-cutting.Are we including trabeculae or excluding them?Trabeculae are included in the model volume of RV.How does it work on dilated hearts?Dilated hearts are validated in publications. The challengewith dilated hearts is to acquire images such that the freewall is in the field of view.How does 3D Auto RV work on contrast images?Due to the small amount of available data sets, thereis no validation for contrast data available.What does the ‘x’ marker in the view adjustment indicate?The cross in the SAX view shows where the Apex-MV andAre there any issues with lower EF’s? Hypercontractility?Apex-TV axes intersect the SAX. This view can be helpfulThere are no known issues.in orienting the views.6
What’s the recommendation if it doesn’t track?If the results of 3D Auto RV vary when scanningIf the tracking fails but the orientation of the data set isthe same patient, how can I explain that?correct, then in the tracking revision stage the contour inThe algorithm is searching for contours in the acquiredthe ED frame should be edited and the “re-track” buttonimage. If the quality differs, the contours are different,used. ED will be re-tracked.e.g., the free wall can be seen completely on one dataset but parts are missing on the second data set.If the complete model orientation failed, e.g., Apex andThe algorithm needs to follow its trained knowledgeMV are interchanged, go to the View Adjustment workflowwhere the contour of the free wall might be – this canstep. Correct the landmark position of the Apex (LV), MV,result in different volume values.Apex (RV) and TV and proceed with tracking revision.Can I do a multi-beat acquisition and which beatWill it reject a volume? If so, what are the parameterswill 3D Auto RV use?in which it will reject?3D Auto RV is always analyzing one heartbeat at a time.A minimum of 10 volumes per heart cycle and 10 volumesThe heartbeat can be selected in View Adjustmentper second is required.workflow step. It is possible to pre-select any heartbeat(can be changed in the user setting).References1 Leary PJ, et al. Three-dimensional analysis of right ventricular shape and function in pulmonary hypertension. Pulm Circ. 2012 Jan-Mar;2(1):34–40.doi: 10.4103/2045-8932.94828.2 Lang RM, Badano LP, et al. Recommendations for Cardiac Chamber Quantification by Echocardiography in Adults: An Update from the American Societyof Echocardiography and the European Association of Cardiovascular Imaging. J Am Soc Echocardiogr. 2015 Jan;28(1):1-39. doi: 10.1016/j.echo.2014.10.003 .3 Messner AM, Taylor GQ. Algorithm 550, Solid Polyhedron Measures. ACM Transactions on Mathematical Software. 1980 Mar;6(1):121-130.4 Muraru D, et al. New speckle-tracking algorithm for right ventricular volume analysis from three-dimensional echocardiographic data sets: validationwith cardiac magnetic resonance and comparison with the previous analysis tool. Eur Heart J Cardiovasc Imaging. 2016 Nov;17(11):1279-1289.5 Laser KT, Karabiyik A, Korperich H, Horst JP, Barth P, Kececioglu D, Burchert W, Dalla Pozza R, Herberg, U. Validation and Reference Values forThree-Dimensional Echocardiographic Right Ventricular Volumetry in Children: A Multicenter Study. J Am Soc Echocardiogr. 2018 Sep;31(9):1050-1063.doi: 10.1016/j.echo.2018.03 .010.6 Medvedofsky D, et al. Novel Approach to Three-Dimensional Echocardiographic Quantification of Right Ventricular Volumes and Functionfrom Focused Views. J Am Soc Echocardiogr. 2015 Oct;28(10):1222-31. doi: 10.1016/j.echo.2015.06. 013.7
2019 Koninklijke Philips N.V. All rights are reserved.Philips reserves the right to make changes in specifications and/or to discontinue any productat any time without notice or obligation and will not be liable for any consequences resultingfrom the use of this publication. Trademarks are the property of Koninklijke Philips N.V. or theirrespective owners.philips.comPrinted in The Netherlands.4522 991 48031 * APR 2019
RV auto-segmentation Auto-segmentation technology is based on a deformable model which consists of a boundary detector and multiple shape models of the RV. The boundary detector uses information from both image gradients and the distribution of the image grayscale values. The shape models consist of a mean shape and shape modes, with the shape .