Transcription
Marketplaces for Data: An Initial SurveyFabian Schomm11Florian Stahl1Gottfried Vossen1,2European Research Center for Information Systems (ERCIS)University of Muenster, Germanyfirstname.lastname@uni-muenster.deWaikato Management SchoolThe University of Waikato, New Zealand2ABSTRACTData is becoming more and more of a commodity, sothat it is not surprising that data has reached the status oftradable goods. An increasing number of data providersis recognizing this and is consequently setting up platforms for selling, buying, or trading data. We identifyseveral categories and dimensions of data marketplacesand data vendors and provide a snapshot of the situationas of Summer 2012.1.INTRODUCTIONToday information is one of the crucial drivingfactors for most businesses. Only if high qualityinformation is available, correct decisions (i. e., decisions in the interest of company revenues) canbe made on a rational and well-founded basis. Despite the sheer quantities of data available on theWeb, such information is not always easy to find,and data marketplaces, surveyed in this paper, areone of several recent developments to remedy thissituation.Shortly after the arrival of the Web in the early1990s a new category of professionals emerged whotook on the function of information intermediaries.To these intermediaries search task could be given,who would then search the Web correspondingly(for a fee) and return the results found. In 1998 theterm data marketplace was probably first used byArmstrong and Durfee [1], who modeled trading of information between digital libraries, focusingon the motivation and behavior of participants andidentifying factors that affect cooperations in a network.Thanks to advances in technology, but also tothe vast amount of data available nowadays, numerous new forms of marketplaces for data haveemerged. A modern information intermediary orinformation marketplace in our understanding is aplatform through which data can be purchased orSIGMOD Record, March 2013 (Vol. 42, No. 1)sold. Commonly, they process, sell, and re-sell dataavailable on the Web. By doing that, these platforms can provide added value in numerous ways.First, some data may be hard to find and scatteredacross numerous websites. A data vendor that aggregates these single datasets into a bigger and morerefined one performs a service that makes it easier forcustomers or end-users to access relevant data. Secondly, datasets from different providers often havedifferent access mechanisms and formats. Therefore, offering one single mechanism to access datain a consistent format can save time and money forcustomers.This has also been realized by information providers who seek commercialization of their data. Inaccordance with that, it can be observed that evermore suppliers of data emerge. Aggregating andcurating this data into accessible and understandable datasets is a business opportunity with highpotential, driven by the over-supply of data.While there have been small, not primarily scientific surveys of data marketplaces ([7, 10, 11]) andresearch on specific data marketplaces such as theWindows Azure Marketplace [9] and others (e. g.,[12]), there is—to our knowledge—to date no comprehensive survey and comparison of multiple datamarketplaces and data vendors. Therefore, we haveconducted such a survey, including a total of 46 suppliers of data. The study was conducted from Aprilto July 20121 with the aim of identifying categoriesand dimensions of data marketplaces as well as vendors of data in order to build a taxonomy for datamarketplaces.1The list of companies surveyed can be foundat ds/SurveyList.pdf, and we are happy to provide the full data of the survey upon request. However,because data marketplaces are a very vivid field andchange fast, it has to be pointed out that Kasabi wentout of business since the survey was taken.15
Surveying the current state of affairs in this fieldcan be seen as the first step in analyzing and understanding this emerging market. We plan on repeating this study annually in order to gain furtherinsight about what has changed, which competitorshave been successful or not and why, which modelsand practices have proven themselves, etc. Researching the market and its developments can not onlyhelp understanding the market dynamics but alsocan give valuable insights into the emergence or application of new technologies and, thus, present newresearch opportunities.The remainder of this paper is organized as follows: First, the survey approach will be described inSection 2. Then we present our findings, i. e., groupings and categorizations in Section 3. Section 4 givesan overview of related work that has been conductedin this area. The paper is concluded by summarizingour findings in Section 5.2.METHODOLOGY AND APPROACHIn this section, we first elaborate on what weconsider to be a data market or data vendor. Thenwe explain how the survey was conducted, using aniterative approach for both collecting data suppliersand deriving categories in Section 2.2. Section 2.3discusses limitations of the method applied.2.1 Data Marketplaces and Data VendorsIn the context of this work we have analyzed datavendors and data marketplaces. In order to restrictthe potentially vast amount of companies, we havefocused on companies offering either a platform fortrading data (e. g., datamarket.com), raw data inany form (e. g., www.data.gov), or data enrichmenttools (e. g., attensity.com). In order to gain a comparable set of data vendors, we have chosen to focuson vendors that offer online Web services. This implies that we have excluded offline products for datacleansing or data fusion and similar tasks.We define a data marketplace as a platform onwhich anybody (or at least a great number of potentially registered clients) can upload and maintaindata sets. Access to and use of the data is regulatedthrough varying licensing models.A data vendor has data and offers it to others,either for a given fee or free of charge. However,it is not important how vendors obtain this data,and many ways are common, e. g., aggregation fromfreely available sources, generation using proprietarymethods, or buying from other vendors. It is important to note that a data vendor can offer its dataeither on its own or through a data marketplaceas described above. Conversely, it is also possible16that a data marketplace operator sells data and thustakes on the role of a vendor.In our understanding, data marketplaces and datavendors have evolved from traditional Web crawlersand search engines as they all provide users withdata. That is why we chose to also include crawlersand search engines that were comparable. Additionally, we also looked at data enrichment services thattake input from the user and enhance it in someway, e. g., by analyzing or tagging it. Seeing howthese services face the same data curation challengesas data marketplaces do, we allowed them into thissurvey.2.2Data Acquisition and ApproachThe initial set of vendors consisted of well-knownsuppliers we found in previous research [14]. Fromthis starting point, keywords were derived that werethen used for a broader online search, which in turnrevealed a more comprehensive set of different products and services.We came up with a set of twelve dimensions alongwhich the vendors considered can be categorized.As not all dimensions are measureable, and the dimensions are grouped into objective and subjectivedimensions to clarify where our own opinion hasinfluenced the results. Table 1 shows the dimensions that we used, the categories that constitutethis dimension as well as the questions we asked toconduct this survey.The values in our approach are strictly Boolean.An offering either fulfills the criteria for a certaindimension category or it does not. However, categories are not mutually exclusive in most cases. Thismeans that, e. g., one offering can fall into multiplecategories, have multiple pricing models, or providemultiple ways for data access. Some dimensions(e. g., maturity), however, are mutually exclusive.Where this is the case, it will be stated explicitly inthe dimension description in Section 3.The facts about the data vendors were gatheredby means of a Web search. As every vendor ormarketplace has a website, this publicly availableinformation was used to determine how to categorizeeach vendor. After having done that with the initialset of vendors, it was checked how many entries acategory had to justify its existence. When a category had only few entries, a new Web search formore data suppliers falling into that category wasstarted in order to make sure no important vendorswere omitted. If more companies were found, thelist was extended iteratively, and the new companieswere analyzed regarding the other dimensions. HowSIGMOD Record, March 2013 (Vol. 42, No. 1)
Table 1: Set of dimensions.DimensionTypeobjectiveTime FrameDomainData OriginPricing ModelData AccesssubjectiveData OutputLanguageCategoriesQuestion to be answeredWeb Crawler, Customizable Crawler, SearchEngine, Pure Data Vendor, Complex Data Vendor,Matching Vendor, Enrichment Tagging,Enrichment Sentiment, Enrichment Analysis, DataMarket PlaceStatic/Factual, Up To DateAll, Finance/Economy, Bio Medicine, Social Media,Geo Data, Address DataInternet, Self-Generated, User, Community,Government, AuthorityFree, Freemium, Pay-Per-Use, Flat RateAPI, Download, Specialized Software, WebInterfaceXML, CSV/XLS, JSON, RDF, ReportEnglish, German, MoreWhat is the type of the core offering?Target AudienceBusiness, CustomerTrustworthinessLow, Medium, HighSize of VendorMaturityStartup, Medium, Big, Global PlayerResearch Project, Beta, Medium, Highever, if no more companies were found, the categorydefinitions were reconsidered and updated.2.3 LimitationsThe information we used was taken directly fromthe website of each vendor. This may limit theaccuracy of our findings in some cases, where thedescription of a product exceeds the actual functionality. Verifying that every product fulfills its owndescription is a task that goes beyond the purposeof this survey. Random samples, however, indicatethat the descriptions commonly match the servicesprovided. Nevertheless, there are also cases wherethe information provided on a vendor’s website wasnot sufficient to categorize all dimensions. This wasparticularly the case for B2B vendors, which only reveal their pricing models upon request. We chose toleave these dimensions out than to speculate abouttheir value. As a result, however, the numbers ofthese dimensions are minimally skewed.The market of data vendors and data marketplaces is highly active, i. e., new actors emerge andothers disappear, and the market as such is growingrapidly. Therefore, it cannot be guaranteed that thisstudy is fully exhaustive with regard to the numberof vendors in the market. That said, we are confidentthat during our observation period from April toJuly 2012 we have obtained a representative samplethat allows for a meaningful analysis. Furthermore,it has to be stated that data trading channels arenot necessarily made public. This means that weare aware of the fact that a certain amount of datais traded directly between (large) corporations orSIGMOD Record, March 2013 (Vol. 42, No. 1)Is the data static or real-time?What is the data about?Where does the data come from? Who is the author?Is the offer free, pay-per-use or usable with a flat rate?What technical means are offered to access the data?In what way is the data formatted for the user?What is the language of the website? Does it differfrom the language of the data?Towards whom is the product geared?How trustworthy is the vendor? Can the original datasource be tracked or verified?How big is the vendor?Is the product still in beta or already established?within a certain ecosystem (such as social networks)without the use of intermediaries. It is obvious thatit is impossible to investigate those forms of datatrading using our Web survey approach.3.FINDINGSAs stated in the previous section, the followingtwelve dimensions have been examined: Type, TimeFrame, Domain, Data Origin, Pricing Model, DataAccess, Data Output, Language, Target Audience,Trustworthiness, Size of Vendor, and Maturity. Tostructure these dimension we have categorized theminto objective and subjective measures, i. e., whetherthe classification within each dimension can be easilyverified or whether the classification is down to theresearcher’s judgement.3.1Objective Dimensions3.1.1 TypeThe first dimension type is used to classify vendorsbased on what their core product is. In order to forma common understanding of the different categoriesthese are explained below: (Focused) Web Crawler: Services that are specifically designed to crawl a particular websiteor set of websites. These are always bound toone domain, e. g., spinn3r is a service that isspecialized on indexing the blogosphere. Customizable Crawler: General purpose crawlers that can be set up by the customer to crawl17
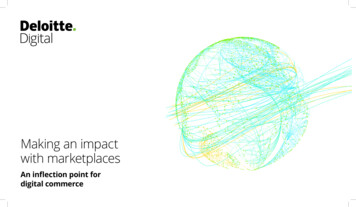
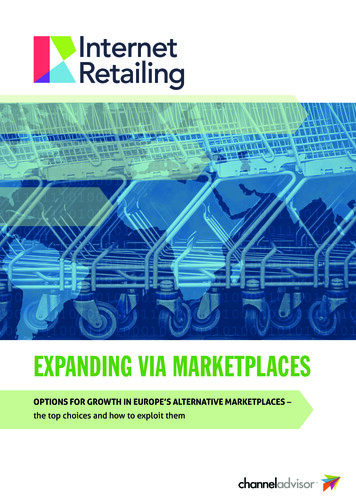
20151050Figure 1: Number of vendors for each Type.any website and search for arbitrary content.For example, 80legs offers such a service, inwhich customers can define regular expressionsto crawl a set of sites. Search Engine: Services that offer their content via an interface similar to a search engine.Customers specify combinations of keywordsas input and the search engine produces output relevant to that input. FactForge is sucha search engine that represents an interface tothe Linking Open Data cloud. Raw Data Vendor: This category comprisesvendors that offer raw data, most often in theform of tables or lists. For example, Factualoffers lists of restaurants, hotels, and otherpoints of interest. Complex Data Vendor: These vendors offerdata that is the result of some kind of analysisprocess. For example, The Stock Sonar provides information about current stock pricesas well as indicators on how individual sharesmight develop in the near future. Matching Data Vendor: Vendors that offer thematching of input data against some other database. These vendors most often operate indomains where a customer does not want acomplete dataset, but rather needs the datathey already have corrected or verified, e. g.,address data. Companies like AddressDoctorare specialized in this area. Enrichment – Tagging: This category describesservices that enrich a given input (mostly text,but other forms are also possible) throughmeans of tags. This enables customers to make18more use of their data. Calais for examplecreates metadata for content submitted usingnatural language processing. Enrichment – Sentiment: With the proliferation of social media websites on the internet,a multitude of vendors has emerged that specialized on what is commonly referred to assentiment analysis [15]. Given the name ofa brand or a product, these services try tocapture and analyze the sentiment of peopletowards that subject. This kind of service is,for example, offered by Salesforce under thename Radian6. Enrichment – Analysis: The data offered isenriched with analysis results obtained throughvarious means, like comparisons with historicaldata or forecasts. Attensity Analyze is oneof such services, offering customer analyticsacross multiple channels. Data Market Place: These services allow customers to both buy and sell data by providingthe infrastructure needed for such transactions.A prime example for this type of vendor isMicrosoft’s Windows Azure Marketplace.Figure 1 shows how many vendors fall into whichcategory. It has to be kept in mind, though, thatthese categories are not mutually exclusive and onevendor can fulfill the criteria of multiple categories.Also, it should be noted that this histogram onlyshows a distribution over our sample and does notrepresent the entire market. This is owing to the factthat (as stated in the Section 2) we have intentionallyexcluded offline providers and tools.SIGMOD Record, March 2013 (Vol. 42, No. 1)
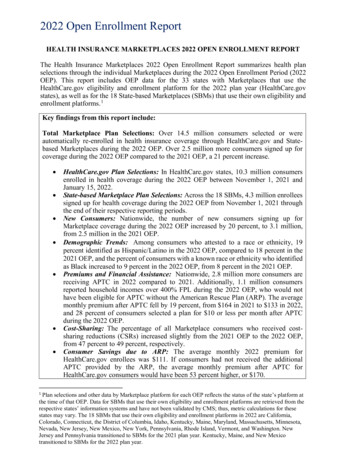
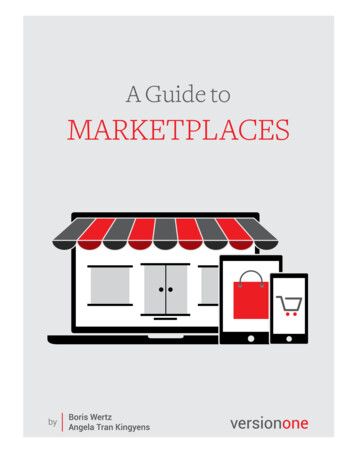
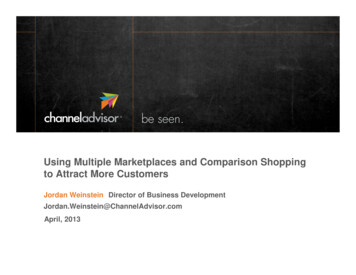
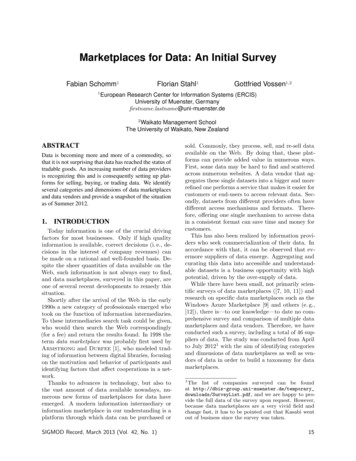
3.1.2Time FrameThe time frame dimension captures the temporalcontext of the data. We distinguish two categoriesin this dimension: Static/Factual: Data is valid and relevant fora long period of time and does not changeabruptly, i. e., population numbers, geographical coordinates, etc. Up To Date: Data is important shortly afterits creation and loses its relevance quickly, i. e.,current stock prices, weather data, or socialmedia entries.As evident from Figure 2, we found that staticdata (32 offerings) was offered more often than upto-date data (23 offerings). Some vendors offer datafrom both these categories. For example, Data.govoffers real-time data about worldwide earthquakesfor the past 7 days as well as a dataset containinginformation on the total calories of commonly eatenfoods. However, we found that only less than 20%(9 offerings) of the surveyed vendors offer both staticand up to date information. This suggests thatgenerally data vendors tend to specialize in eitherof the two options.The origin of data describes where it comes from.We have identified six different categories in thisdimension: Self-Generated: Vendors have means of generating data on their own, i. e., manual curationof a specific dataset or calculating forecastsbased on patented methods.Static/Factual3.1.33.1.4 Data Origin Internet: The data is pulled directly from apublicly and freely available online resource.35302520151050Figure 2:Frame.towards explicit domains. The results are shown inFigure 3.It is obvious that the any domain is by far thebiggest group. An explanation for this is that datamarket places, search engines, and customizablecrawlers do indeed serve any domain, dependingon what customers choose to upload or search for.Given that they account for more than a fourthof all companies under investigation, the peak inany is not surprising. The other domains have alower number of vendors, because they are morespecialized. Furthermore, we have observed thatthe geo data (7) and address data (8) domains havea significant overlap (6), which can be explainedby their obviously close relationship. Companieslike AggData specialize in providing high-qualitydata about customers and their locations, so theyfit into both categories. Address and geo data are,however, not the same, as evidenced for exampleby CustomLists.net, who offer only address data formarketing purposes.Up ToDateNumber of vendors for TimeDomainThe dimension domain describes what the actualdata is about. While most domain names are selfexplanatory, domain any deserves clarification. Thisdomain was used to classify vendors whose offersare not restricted and could incorporate arbitrarydomains. For example, the Windows Azure Marketplace is not focused on a specific domain, whichmeans that all different kinds of data can be foundthere. Whilst other domains were not mutually exclusive (i. e., a vendor could supply more than onedomain), vendors serving any domain did not countSIGMOD Record, March 2013 (Vol. 42, No. 1) User: Users have to provide an input beforethey can obtain any data, i. e., address dataofferings that return the address for a givenname. Community: Based on a wiki-like principle,these vendors obtain and maintain their datain a very open fashion. The restrictions as towho can participate and contribute are usuallyrather low. Government: Governments capture and process huge amounts of data and have recentlybegun to make this data publicly available. Authority: Authorities in a domain are entities which are the main provider of data, i. e.,the stock market for stock prices or the postaloffices for address data.In our survey the most popular origin categorywas the Internet. Almost 50% of all vendors receivetheir data from an online source. Another category19
302520151050AnyFinance/BioEconomy MedicineSocialMediaGeo Data AddressDataFigure 3: Number of vendors for each Domain.50%45%40%35%30%25%20%15%10%5%0%Figure 4: Data origin distribution.with a large number of vendors was authority: 32%obtain their data from authoritative sources. Forexample, Intelligent Search Technology claims thattheir address verification service is certified by theU.S. Postal Service. The main advantage of theseoffers is that the data is usually of high correctness,completeness, and credibility. This also holds forthe government category, into which fell 15% of vendors. The categories self-generated and communityare matched by 15% and 19%, respectively. Theproblem with self-generated data is that there is notransparency in the data sourcing process. For example, CustomLists.net does not reveal where theyget their data from, which might raise concerns regarding credibility or correctness. Lastly, categoryuser with 15% is a special case because it cannotstand on its own, i. e., every vendor classified intothis category also gathered data from another source.This is inherent to the definition of this category,according to which users submit their data and receive it back with additional annotations for whicha vendor needs additional data sources. These factsare illustrated in Figure 4.203.1.5 Pricing ModelPricing models are very important to understanding how exactly the different vendors set up theirbusiness models. Four main pricing models couldbe found; the number of vendors for each model isillustrated in Figure 5. A verbal explanation of thepricing models is provided by the following list: Free: These services can be used at no charge.Reasons for offering a service for free are, amongothers, that it is only a beta test or researchproject, the vendor is a public authority fundedby tax money, or simply interested in attracting more customers. For example, Data.gov isfree as it is a website of the U.S. government.Vendors in this category do not count towardsone of the following categories. Freemium: As a portmanteau combining freeand premium, this pricing model offers a limited access at no cost with the possibility of anupdate to a fee-based premium access. Freemium models are always combined with at leastone of the following two payment models.SIGMOD Record, March 2013 (Vol. 42, No. 1)
Pay-Per-Use: Customers are billed based onhow much they use the respective service. Thismanifests mostly in the form of x per thousandAPI calls. Flat Rate: After paying a fixed amount ofmoney, customers can make unlimited use ofthe service for a limited time, mostly a monthor a year.1614121086420Figure 5: Number of vendors for each Pricing Model.An example for the combination of the Freemiumand Pay-Per-Use model is Factual.com. Their APImay be called up 10,000 times per day for free. Anyadditional calls have to be paid for. The CloudMadeData Market Place, on the other hand, combinesFreemium with Flat Rates by offering free trials fortheir datasets and unlimited access for an annualfee.3.1.6Data AccessThe data access dimension describes through whichmeans end-users receive their data from vendors.The main categories identified and presented in Figure 6 are: API: An API (application programming interface) is used to provide a language- andplatform-independent programmatic access todata over the Internet. Download: Traditional download of files is theeasiest way to access a data set, because anyonecan use such a service with only a Web browser. Specialized Software: Some vendors have implemented a specialized software client to connect with their Web service. While this approach does have downsides (implementationand maintenance expense, dependency issues,etc.), there are some scenarios in which the concept is worthwhile, for example, providing thecustomer with an easy-to-use graphical user interface as an out-of-the-box solution that needsSIGMOD Record, March 2013 (Vol. 42, No. 1)no further customization, or granting access toreal-time streams of data. Web Interface: In a Web interface, the data isdisplayed to the customer directly on a website.The flexibility and modularity of APIs have madethese the most popular of all access methods. Morethan 70% of all vendors offer an API. However, lessthan 30% of all vendors have an API as their onlyway to access data. Most vendors offer an APInext to other methods. For example, Web interfacesor file downloads are used to give previews of thedataset, to make it easier and more accessible for thecustomer to see what the actual data looks like, e. g.,Factual.com has an extensive Web frontend that renders tables or geodata. The concept of specializedsoftware does not seem to stand very well on itsown. Out of all investigated vendors, only three usespecialized software as the only way of data access.For example, MeaningMine provides the user witha dashboard-like interface that shows graphs andimportant numbers. However, this approach lacksflexibility, because customers are restricted in theway they can use the data by the functionality ofthe provided software. Nevertheless, most customerswho want data do not want any restrictions on howthey can access and process the data. From a theoretical point of view, it seems to be the best approachfor a vendor to offer all the aforementioned meansof access to his data, because that allows customersto choose their preferred way of access. However, wehave not found a single vendor that does so, whichis probably due to the high cost associated withcreating such a broad offering.3.1.7 Data OutputThis dimension shows the format in which datacan be obtained. To us, the most reasonable set ofcategories in this dimension is the following: XML: Being both human- and machine-readable, the Extensible Markup Language is awidely established standard for data transferand representation. CSV/XLS: Most structured data is laid outin a tabular way, so it makes sense to wrap itinto a table file format. We do not distinguishbetween CSV and XLS and other table fileformats, because the main differences betweenthem, like formatting and embedding, do notapply when you are showing raw data JSON: The JavaScript Object Notation is similar to XML and is also used as a data transfer21
ftwareWeb InterfaceFigure 6: Data Access distribution.2520151050XMLCSV/ XLSJSONRDFReportFigure 7: Number of vendors per Data Output category.format. Data is represented as text in keyvalues pairs. RDF: The Resource Description Framework isa method to describe and model information. Ituses subject-predicate-object triplets to makestatements about resources. Due to its graphdata model, it is a good choice for data that isinherently graph-shaped. Report: When data is preprocessed, aggregatedand “prettified” in some way, we declared theoutput as a report. The main difference in thiscategory is that the customer does not have insight into the underlying raw data. Also visualreports in the form of MS Excel spreadsheetclassified for this category.The most popular category in the output dimension shown in Figure 7 is CSV/XLS. With 22 vendors, almost half of all vendors considered offer thepossibility to receive their data as a raw table. However, only six of those vendors have CSV/XLS astheir only output format. Most vendors also offer either an XML (10) or a JSON (6) interface,some even both (3). This is consistent with the22observation from the previous dimension, that anAPI is the most popular way of data access. AnAPI usually produces XML or JSON output. Offering many ways to access data is a key feature of adata marketplace, because it broadens the range ofpossible users. DataMarket.com therefore supportsall aforementioned output categories except RDF.Other competitors, however, do not provide all thesedifferent access mechanisms. The Infochimps DataMarketplace favors JSON over XML for their API.It remains to be seen what further implications thistechnical limitation may have.3.1.8 LanguageWe have focused on the English and German languages because of personal language skills. Thus,further differentiations in this dimension were notpossible. Therefore, any additional languages weencountered were aggregated into a third categorycalled more. Although English is a dominant language on the Internet, we would be happy to cooperate with other researchers with other language skillsin a future edition of the survey.The analysis of language distinguishes betweenthe language of the website and the language of theSIGMOD Record, March 2013 (Vol. 42, No. 1)
reFigure 8: Language of websites (left) and data (right).data offered. A visual representation of the resultsis shown in Figure 8. Nearly all investigated vendors(98%) run an English-language website. For themajority, English is also the only language available(89%). Only some companies run a multilingual website (9% German; 7% More). These tend to be thebigger player with a global strategy, like Microsoftor LexisNexis. This picture changes when lookingat the language of the data itself. We observed thatagain 98% offered English Language Data, but about30% offered German data and almost 20% of thevendors also offered data in other languages.We have seen that English is the dominant language for both websites and data. This is not surprising because the market for data has a globalscope and English seems to be the best suited language for that. However, there is also a demand forlocal data in the corresponding language, which issuggested by the amount of vendors that offer suchdata.3.1.9Target AudienceThe last objective dimension is concerned withthe target audience. Here, we have investigated towards whom offerings are tailored. As is evidentfrom Figure 9, there are only two categories in thisdimension, business and customer. Providing datafor another company in a B2B fashion is the mostlogical application area of data vending. Specializedvendors focus on their respective domain, e. g., CustomLists.net targets business users while WolframAlpha is aimed more at private users. The moregeneral vendors, especially those operating in theany domain like
2.1 Data Marketplaces and Data Vendors In the context of this work we have analyzed data vendors and data marketplaces. In order to restrict the potentially vast amount of companies, we have focused on companies o!ering either a platform for trading data ( e.g ., datamarket.com), raw data in any form ( e.g ., www.data.gov), or data enrichment