Transcription
Electrocardiograms Made Easy! Part III. Interpreting Ventricular DysrhythmiasNYSNA Continuing EducationThe New York State Nurses Association is accredited as a provider of continuing nursingeducation by the American Nurses Credentialing Center’s Commission on Accreditation.This course has been awarded 1.5 contact hours.All American Nurses Credentialing Center (ANCC) accredited organizations' contact hours arerecognized by all other ANCC accredited organizations. Most states with mandatory continuingeducation requirements recognize the ANCC accreditation/approval system. Questions about theacceptance of ANCC contact hours to meet mandatory regulations should be directed to theProfessional licensing board within that state.NYSNA has been granted provider status by the Florida State Board of Nursing as a provider ofcontinuing education in nursing (Provider number 50-1437).Electrocardiograms Made Easy! Part III. Interpreting Ventricular Dysrhythmias1 2007 NYSNA, all rights reserved. Material may not be reproduced without written permission.
How to Take This CoursePlease take a look at the steps below; these will help you to progress through the coursematerial, complete the course examination and receive your certificate of completion.1. REVIEW THE OBJECTIVESThe objectives provide an overview of the entire course and identify what information willbe focused on. Objectives are stated in terms of what you, the learner, will know or beable to do upon successful completion of the course. They let you know what you shouldexpect to learn by taking a particular course and can help focus your study.2. STUDY EACH SECTION IN ORDERKeep your learning "programmed" by reviewing the materials in order. This will help youunderstand the sections that follow.3. COMPLETE THE COURSE EXAMAfter studying the course, click on the "Course Exam" option located on the coursenavigation toolbar. Answer each question by clicking on the button corresponding to thecorrect answer. All questions must be answered before the test can be graded; there isonly one correct answer per question. You may refer back to the course material byminimizing the course exam window.4. GRADE THE TESTNext, click on "Submit Test." You will know immediately whether you passed or failed. Ifyou do not successfully complete the exam on the first attempt, you may take the examagain. If you do not pass the exam on your second attempt, you will need to purchase thecourse again.5. FILL OUT THE EVALUATION FORMUpon passing the course exam you will be prompted to complete a course evaluation.You will have access to the certificate of completion after you complete the evaluation.At this point, you should print the certificate and keep it for your records.Electrocardiograms Made Easy! Part III. Interpreting Ventricular Dysrhythmias2 2007 NYSNA, all rights reserved. Material may not be reproduced without written permission.
IntroductionElectrocardiograms Made Easy! is a series of three courses comprised of: Basic ECGInterpretations, Interpreting Abnormal Atrial Rhythms, and Interpreting VentricularDysrhythmias.This final course of the series will discuss ventricular dysrhythmias, many of which needimmediate intervention or are not supportive of life. It builds from the previous concepts learnedfrom Basic ECG Interpretations and Interpreting Abnormal Atrial Rhythms. In learning aboutventricular dysrhythmias, we will advance the concepts related to electrical physiology and theelectrocardiogram, focusing on different rhythm presentations, and the mechanical and electricalprocess involved. To achieve this, the pathophysiology behind differing dysrhythmias will bepresented, allowing conceptualization of the mechanical/electrical processes occurring in thedysfunctional cardiac cycle. This assumes that the learner is competent in the basicelectrocardiogram principles. If needed please refer to the first two courses in this series.Cardiovascular disease composes of heart disease and cerebro-vascular accidents (strokes).Respectively they are the leading and third leading cause of death in the United States. Togetherthey account for the death of 950,000 Americans each year (CDC, 2005). More broadly, 61million Americans (almost 1 in 4) suffer from some form of cardiovascular disease (CDC, 2005).With tightening purse strings, cardiovascular diseases impact on healthcare resources isastounding. The Center for Disease Control estimates that in 2003 the cost of cardiovasculardisease to the economy was 351 billion (CDC, 2005). So what does this mean to you?As active participants in healthcare you will undoubtedly come in contact with the 1 in 4Americans who have cardiovascular disease. This contact may be in any setting, from anemergency department, surgical ward, rehabilitation or your own family home. So it is importantto be familiar with and understand the basics of one of the easiest, most cost-effective, noninvasive tests performed to assess cardiac function: the electrocardiogram. It is important to beable to interpret electrocardiograms in order for the skilled Registered Nurse to initiate timelyinterventions.Content Outline Ventricular dysrhythmia etiologyVentricular dysrhythmias1. Premature ventricular contraction (PVC)2. Idioventricular rhythm3. Accelerated idioventricular rhythm4. Ventricular tachycardia5. Ventricular fibrillation6. AsystolePacemaker rhythmsAtrioventricular blocks (AV blocks)1. First-degree block2. Second-degree block type I3. Second-degree block type II4. Third-degree block (complete heart block)Electrocardiograms Made Easy! Part III. Interpreting Ventricular Dysrhythmias3 2007 NYSNA, all rights reserved. Material may not be reproduced without written permission.
Course Objectives1. Identify dysrhythmias not supportive to life2. Identify which rhythm indicates a block and requires immediate intervention3. Explain why a P wave may not be visibleElectrocardiograms Made Easy! Part III. Interpreting Ventricular Dysrhythmias4 2007 NYSNA, all rights reserved. Material may not be reproduced without written permission.
About the AuthorDavid Pickham, MN, RN, began his nursing education at the University of Newcastle in NewSouth Wales, Australia. He has since worked as a registered nurse focusing on emergencymedicine in Australia, Canada, and the United States. He has a master’s of nursing in advancedpractice and currently is a doctoral candidate at the University of California. His interests liespecifically in the field of electrocardiography (also known as ECG or EKG) which led him tocreate courses on Electrocardiograms Made Easy!Electrocardiograms Made Easy! Part III. Interpreting Ventricular Dysrhythmias5 2007 NYSNA, all rights reserved. Material may not be reproduced without written permission.
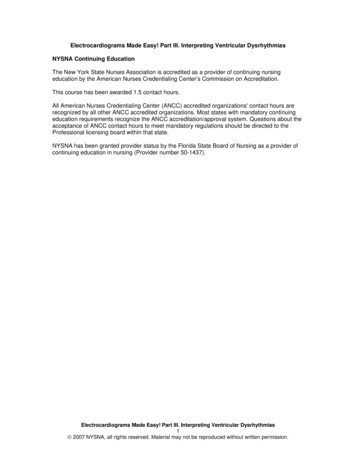
Ventricular Dysrhythmia EtiologyUnlike atrial dysrhythmias, ventricular dysrhythmias originate below the level of the atria withinthe Purkinje fibers (see Figure 1). Work through this with me if you will. If the impulse doesn’toriginate in the atria, then we cannot expect to see a P wave. Remember the P wave representsatrial contraction and should be followed by a QRS complex in a normal cardiac rhythm.Figure 1. “Conduction System Pathway” Courtesy of: University of OtagoIn a ventricular dysrhythmia, the impulse originates somewhere in the Purkinje fibers, spreadingacross the left and right ventricle wall before conducting through to the atria. This will result in awide QRS complex (due to the time it takes the impulse to conduct through the non-specificpathways in the ventricles).If we think of the wave morphology, the impulse generated in the QRS complex will result in the Pwave being absent or cause the P wave to be flipped upside down. This flipping is a result of theimpulse traveling in the opposite direction, than a normal conducted stimulus. As the stimulus istraveling in the opposite direction the P wave is represented on an ECG as a negative wave(flipped).Do you remember the intrinsic rate of the Purkinje fibers? If so you will be able to estimate whatthe expected rate of a ventricular rhythm will be (see Figure 2).Electrocardiograms Made Easy! Part III. Interpreting Ventricular Dysrhythmias6 2007 NYSNA, all rights reserved. Material may not be reproduced without written permission.
Figure 2.Electrocardiograms Made Easy! Part III. Interpreting Ventricular Dysrhythmias7 2007 NYSNA, all rights reserved. Material may not be reproduced without written permission.
Ventricular DysrhythmiasPremature Ventricular Contraction (PVC)Like all rhythms we have interpreted so far the rhythm name describes the processes occurring.This rhythm is no different. PVC simply means that there is an early contraction of the ventricles.This is illustrated in Figure 3.Figure 3. Premature Ventricular ContractionsLook at Figure 3, now this isn’t really a dysrhythmia like other rhythms we have seen. This is anormal rhythm with episodes of electrical conduction malfunction. Let’s work through thequestions (ignore the PVCs while doing these).What is the rate? 60-75 bpmIs the rhythm regular or irregular? RegularIs there a P wave present? YesIs the PR interval fixed or varied? FixedIs the QRS wide or narrow? NarrowDo you think that this is normal sinus rhythm? Great job. So we know we have normal sinusrhythm. Now let’s describe what is occurring. Look at these abnormal QRS complexes. Are theynarrow or wide? Good, so you can see they are wide. We know that a narrow QRS complexmeans that the impulse originated in the atria. A wide QRS complex must therefore represent animpulse that generated in the ventricles. Because the QRS complexes originate out of sync withnormal cardiac function we say that we have normal sinus rhythm with premature ventricularcontractions.Great! Now let’s advance this concept. In Figure 3 you can see that the PVCs look similar intheir directions (both pointing down). We state that they are unifocal PVCs. This simply meansthat there is one point of impulse origin. But what happens when they point in differentdirections? See Figure 4.Figure 4. Multifocal PVCsElectrocardiograms Made Easy! Part III. Interpreting Ventricular Dysrhythmias8 2007 NYSNA, all rights reserved. Material may not be reproduced without written permission.
As you can see in Figure 4, we have two wide QRS complexes with an underlying normal sinusrhythm. As they are represented as one upward and one downward, we can figure out that thestimulus must be from more than one. Knowing this, we can then label Figure 4 as normal sinusrhythm with multifocal PVCs (having more than one point of impulse origin).Okay, so we know what a premature ventricular contraction is and now we can distinguishwhether they are unifocal or multifocal in origin. Now we need to describe their rate ofoccurrence. We have four common types.If the PVC occurs every other beat, as in Figure 5, we label this Bigemeny.Figure 5. BigemenyIf it occurs every third beat, as in Figure 6, we label this Trigemeny.Figure 6. TrigemenyIf we have two PVCs in a row, as in Figure 7, we label this a Couplet.Figure 7. Couplet’sLastly, if we have 3 PVCs in a row, as in Figure 8, we label this a Triplet.Electrocardiograms Made Easy! Part III. Interpreting Ventricular Dysrhythmias9 2007 NYSNA, all rights reserved. Material may not be reproduced without written permission.
Figure 8. Triplet’sSeems pretty straight forward, right? Well let’s move on to another rhythm.Idioventricular RhythmWe have seen plenty of rhythms where the pacemaker is situated in the SA node or AV node.This will be the first rhythm where the heart’s pacemaker is originating within the ventricles. SeeFigure 9.Figure 9. Courtesy of: Newberry (2003)Note how there is one stimulus area in the ventricles acting as the heart’s primary pacemaker.Start thinking about what this will do to the rhythm strip. What is the ventricle’s intrinsic rate?Review Figure 10 and answer the five questions.Figure 10. Idioventricular rhythmWhat is the rate? 33-38 bpmIs the rhythm regular or irregular? RegularIs there a P wave present? NoneIs the PR interval fixed or varied? NoneIs the QRS wide or narrow? WideElectrocardiograms Made Easy! Part III. Interpreting Ventricular Dysrhythmias10 2007 NYSNA, all rights reserved. Material may not be reproduced without written permission.
We know that the intrinsic rate for a ventricular paced rhythm (Purkinje fibers) is between 20-40bpm. From the questions we can see that we have a regular paced rhythm, rating between 33-38bpm (intrinsic rate for Purkinje fibers), with a wide QRS. From these results we can assume thatthis is a ventricular paced rhythm.SummaryRemember, a rhythm rating between 20-40 bpm, with a consistently wide QRS complex andabsent P waves Idioventricular rhythm.Accelerated Idioventricular RhythmWe saw in junctional rhythm how the addition of the word “accelerated” simply refers to the samerhythm at a faster rate. Accelerated idioventricular rhythm is no different. Let’s look at Figure 11and answer the five questions.Figure 11. Accelerated idioventricular rhythmWhat is the rate? 50 bpmIs the rhythm regular or irregular? RegularIs there a P wave present? NoneIs the PR interval fixed or varied? NoneIs the QRS wide or narrow? WideSo we can tell that this is an idioventricular rhythm, but at what rate do we label it as beingaccelerated? An idioventricular rhythm will have a rate between 20-40 bpm. If the rate isbetween 40-60 bpm then we can label this rhythm as an accelerated idioventricular rhythm.Make sense?How are you doing so far? Ready for a little more? Come on, not too many more to get throughbefore we can test some skills!Ventricular Tachycardia (V-tech)Ventricular tachycardia isn’t supportive of adequate cardiac output or life. It is one of the mostserious dysrhythmias. Review Figure 13 and complete the five questions.Electrocardiograms Made Easy! Part III. Interpreting Ventricular Dysrhythmias11 2007 NYSNA, all rights reserved. Material may not be reproduced without written permission.
Figure 12. Courtesy of: Newberry (2003)Note how there is one single focus in the ventricles that is generating a rapid rhythmic impulse.This is responsible for the rhythm you see in Figure 13.Figure 13.What is the rate? 150-300 bpmIs the rhythm regular or irregular? RegularIs there a P wave present? NoneIs the PR interval fixed or varied? NoneIs the QRS wide or narrow? WideAs you can see the ventricles of the heart are working extremely hard. Due to this action theventricles can never completely fill, resulting in greatly diminished cardiac output. This is a lifethreatening situation. Don’t panic though when you see this rhythm, look at the patient and seehow they tolerate this. Some people may be able to tolerate this rhythm for a very short period,while other patients may be without a pulse, so be sure to assess the patient before you go andshow the colleagues how weird this rhythm looks!SummaryRemember, a rapid rhythm with wide rapid QRS complexes with no P waves ventriculartachycardia.Ventricular Fibrillation (V-fib)Unlike atrial fibrillation, ventricular fibrillation cannot sustain life. The ventricles are depolarizingwithout coordination, resulting in total chaos within the ventricles. See Figure 14.Electrocardiograms Made Easy! Part III. Interpreting Ventricular Dysrhythmias12 2007 NYSNA, all rights reserved. Material may not be reproduced without written permission.
Figure 14. Courtesy of: Newberry (2003)Note the numerous sites that are generating electrical impulses. These electrical impulses causethe ventricles to quiver instead of depolarize uniformly. What’s next you say? Well let’s answerthe five questions.Figure 15. Ventricular Fibrillation.What is the rate? UnknownIs the rhythm regular or irregular? ChaoticIs there a P wave present? NoneIs the PR interval fixed or varied? NoneIs the QRS wide or narrow? NoneSo from the five questions we get a picture of what is occurring with the ventricles. There ischaos in the ventricles with no clear electrical impulse being conducted. There is no sustainablecardiac output and therefore the patient would not have a pulse. If you identify this rhythm, makesure it is not due to artifact. Look at the patient and check for a pulse; it is not distinguishable.Always treat the patient, not the rhythm.ArtifactIs a variance in recording that does not originate from the heart’s normal electrical activity. Thereare two main causes. First, any action by the patient may produce artifact. Therefore you mustconsider such things as talking, shivering and even pain as possible impediments to the ECG.Electrodes must be placed correctly, with a firm bond to the patient’s skin. It may be necessary toremove patient’s hair to ensure connection. Second, environmental factors will cause artifact toappear on the ECG tracing. Therefore be aware of automated blood pressure cuffs, monitors andeven infusion pumps as possible produces of artifact. Colleague’s bumping a bed or performingother tasks will also cause artifact, so always be aware of the patient and the surroundingenvironment.Electrocardiograms Made Easy! Part III. Interpreting Ventricular Dysrhythmias13 2007 NYSNA, all rights reserved. Material may not be reproduced without written permission.
SummaryRemember, a rhythm where you cannot identify any real wave morphology ventricularfibrillation.AsystoleThis is the easiest rhythm to identify. “A” meaning without and “systole” meaning ventricularcontraction (heart beat). Worded simply this means the patient is without a heartbeat. Thispatient has no pulse.Figure 16. Courtesy of: Newberry (2003)Note how there is no electrical activity being initiated or conducted throughout the heart. Allpacemakers fail to initiate any activity. For consistency let’s go through the five questions. SeeFigure 17.Figure 17. AsystoleWhat is the rate? NoneIs the rhythm regular or irregular? NoneIs there a P wave present? NoneIs the PR interval fixed or varied? NoneIs the QRS wide or narrow? NoneMakes sense doesn’t it? With an asystole rhythm there is one important thing to remember. Besure to check that all the electrodes are secure and that the patient is actually pulse-less. Like Vfib, it is embarrassing calling the “code team” on a patient who is in normal sinus rhythm with anelectrode that has fallen off. The code team will never see the humor in it, especially at 4 a.m.Electrocardiograms Made Easy! Part III. Interpreting Ventricular Dysrhythmias14 2007 NYSNA, all rights reserved. Material may not be reproduced without written permission.
Pacemaker RhythmsWhen a patient’s natural pacemaker has trouble initiating and sustaining rhythms consistent withsufficient cardiac function, he or she is implanted with an artificial pacemaker. Put simply, thesedevices are artificial impulse generators used to substitute for the part of the cardiac cycle that isdysfunctional. There are three types of artificial pacing, each represented differently on a rhythmstrip. See Figures 18-20.In the first example (Figure 18) you can see how there are lines in front of the P wave. These areknown as “spikes” and are generated by an artificial electrical impulse. As the position of thespike is before the P wave, we can see that the impulse has depolarized the atria (P wave), thenpassed through the AV node and conducted normally through the ventricles.Figure 18. Atrial pacingCan you see the spike is before the ventricles in Figure 19? Like the example above, this artificialimpulse has depolarized the ventricles. Evidently, this results in the widening of the QRScomplex, as the impulse origin is within the ventricles.Figure 19. Ventricular pacingWhen we put these two artificial pacing systems together, it is known as dual pacing. Simplystated there is an impulse directly connected to stimulate the atrium, while another is connectedto stimulate the ventricles. See Figure 20. This dual system will ensure that both the atria andventricles perform in unison. Note the presence of normal P waves proceeded by a wide QRScomplex.Figure 20. Dual pacingYou may see pacing spikes that continue for each heart beat, or it may only be present every nowand then. If this is occurring don’t worry. The pacemaker may be set to fire all the time or onlywhen the heart’s natural pacemaker fails to initiate an impulse. Look at Figure 20. Note how thefirst three beats utilize atrial pacing, while the other beats are dependant on dual pacing.Electrocardiograms Made Easy! Part III. Interpreting Ventricular Dysrhythmias15 2007 NYSNA, all rights reserved. Material may not be reproduced without written permission.
There is a lot of information to learn initially, but stay patient. At this time be sure that you arefollowing each new rhythm and the changes that they represent.Okay, let’s move on to the final section.Electrocardiograms Made Easy! Part III. Interpreting Ventricular Dysrhythmias16 2007 NYSNA, all rights reserved. Material may not be reproduced without written permission.
Atrioventricular Blocks (AV Blocks)The thought of discussing heart blocks causes anxiety to most nurses who lack the basicunderstanding of rhythm strips. Lucky for us, after reading through these sections we have agreat understanding of basic rhythm interpretation, so we can expect this section to flow easily.Ready to roll? Let’s go.First some background. What is an AV block?In normal conduction an impulse is generated in the SA node and conducted through to the AVconduction system (AV node, and Bundle of His). Disease processes can affect the ability of theAV node to conduct impulses to the ventricles. When conduction is impaired, we term these“blocks.” There are three types of AV blocks each representing a differing degree of disease andconduction impairment. Let’s go through these one by one.The key to interpreting blocks is to pay attention to the PR interval. Continue on to see.First-Degree Heart BlockThe first type of AV block is termed first degree AV block. Remember back to the basicelectrophysiology section in the first course of this series (Basic ECG Interpretation)? A normalimpulse is generated from the SA node and conducted through to the AV node where it “pauses”for a slight period of time before it is conducted through to the ventricles. In a first degree AVblock this “pause” is a little longer than expected. See Figure 21. Do you remember what thenormal PR interval is?If you rattled off 0.12-0.20 seconds or 3-5 small boxes, then I am so proud! Well done.Figure 21. Courtesy of: Newberry (2002)Note how there is a normal impulse stimulus at the SA node. This will, as you know, give us anormal P wave and narrow QRS complex. So how do we tell if it is a first-degree block? Let’slook at Figure 22 and work through the five questions.Figure 22. First degree blockElectrocardiograms Made Easy! Part III. Interpreting Ventricular Dysrhythmias17 2007 NYSNA, all rights reserved. Material may not be reproduced without written permission.
What is the rate? 60-75 bpmIs the rhythm regular or irregular? RegularIs there a P wave present? YesIs the PR interval fixed or varied? Fixed, lengthened (0.28 seconds or 7 boxes)Is the QRS wide or narrow? NarrowRecap. Here we essentially have normal sinus rhythm with a fixed lengthened PR interval. Thisrepresents a longer delay than usual at the site of the AV node. This is a first-degree block.Don’t worry if your patient has this block. It can present in normal healthy individuals.SummaryRemember, a PR interval that is lengthened but constant with normal wave morphology firstdegree block.Let’s progress to the next type of block.Second-Degree Heart Block. Type I. (Mobitz I or Wenchebach)In this rhythm there is a blockage in the conduction at the AV node that is gradually lengthened.This gradual lengthening sets it apart from first-degree block. This blockage gradually lengthensthe time an impulse is paused at the AV node until one impulse isn’t conducted through to theventricles, whereby the cycle starts again. This can be seen in Figure 23. Work through thequestions.Figure 23. Second-degree heart block type IWhat is the rate? 60-75 bpmIs the rhythm regular or irregular? Regularly irregular (Predictable)Is there a P wave present? YesIs the PR interval fixed or varied? VariedIs the QRS wide or narrow? NarrowIn this rhythm we have a gradually increasing PR interval until we have a situation where a QRScomplex doesn’t follow a P wave (dropped beat) and then it starts again. This is a predictablecycle that we can say is regularly irregular.SummaryRemember, a PR interval that is varied with a dropped beat second-degree type I.Second-Degree Heart Block. Type II. (Mobitz II)Progressing through the blocks, this rhythm is a result of one or more impulses being blocked atthe AV node and not conducted through to the ventricles. See Figure 24. Work through thequestions.Electrocardiograms Made Easy! Part III. Interpreting Ventricular Dysrhythmias18 2007 NYSNA, all rights reserved. Material may not be reproduced without written permission.
Figure 24. Second-degree heart block type IIWhat is the rate? 43 bpmIs the rhythm regular or irregular? Regularly irregularIs there a P wave present? YesIs the PR interval fixed or varied? FixedIs the QRS wide or narrow? NarrowRecap. Here we can see that the atria are generating an impulse (presence of P waves).However, the AV node is only allowing every third beat to conduct through to the ventricles (QRScomplex). Remember second-degree type I has a gradually lengthening PR interval then adropped beat. This rhythm has a fixed PR interval, with consistent blocked beats.SummaryRemember fixed PR interval with dropped beats second-degree type II.Third-Degree Block (Complete Heart Block)This is without doubt the most dangerous block a patient can have. So far we have progressedthrough three different blocks, from a longer pause at the AV node as seen in first-degree block,gradual pause causing a dropped beat in second-degree type I block and constantly droppedbeats in second-degree type II. In complete heart block (third-degree block) we have the atriaworking independently to the ventricles. There is a complete block at the level of the AV node,where impulses are unable to pass through. What do you think this would look like on a rhythmstrip?Figure 25. Courtesy of: Newberry (2003)Electrocardiograms Made Easy! Part III. Interpreting Ventricular Dysrhythmias19 2007 NYSNA, all rights reserved. Material may not be reproduced without written permission.
Note how the SA node initiates an impulse that depolarizes the atria. The AV node for somereason is not able to pass this impulse to the ventricles. The ventricle then operates by itself withits own pacemaker. Therefore we have two pacemakers in the heart operating independently.To conceptualize this, consider the two areas of the heart, the atria and ventricles, as separateentities. The atria are conducting business on its own and the ventricles are conducting businesson its own. Each carries on business as usual, depolarizing at their own intrinsic rates. Now putthe two on top of each other and you have a heart, where the top is not communicating with thebottom. See Figure 26. Let’s work through the questions and gather the clues.Figure 26. Third-degree heart blockWhat is the rate? 33-38 bpmIs the rhythm regular or irregular? Regular (But P waves are regular and R waves are regular)Is there a P wave present? YesIs the PR interval fixed or varied? VariedIs the QRS wide or narrow? WideRecap. As you have worked out, this rhythm has P waves and a wide QRS complex. Thereforewe know that there is an impulse originating in the atria (P wave) and another in the ventricles(wide QRS complex). Notice how there is no reason to this rhythm. The P waves are constantbut in no relation to the QRS complexes, which are also constant. This is termed completedissociation between the atria and ventricles.SummaryRemember, a rhythm with constant P waves, a varying PR interval, with no association to awidened QRS complex, with regular dropped beats third-degree block. This block requiresimmediate intervention, as often the patient will need a permanent pacemaker.Here is a table to help separate the individual blocks. Be sure to understand this table well, as itwill help you identify the blocks much easier.Fixed PR interval1st degree block2nd degree type IIVaried PR interval2nd degree type I3rd degreeNote how the table is divided between fixed and varied PR intervals. This is key. If you recall ina fixed PR interval, first-degree won’t drop a beat, only second-degree type II does. Therefore, ifyou have a fixed PR interval and there are dropped beats, it must be second-degree type II. Ifthere is a lengthened but fixed PR interval without a dropped beat then it can only be a firstdegree block. If there is a varied PR interval, only one rhythm will have constant dropped beats,third-degree block. If it is a varied PR interval with a single dropped beat it must be seconddegree type II. Remembering this table will help you easily identify the block you are trying toidentify.Electrocardiograms Made Easy! Part III. Interpreting Ventricular Dysrhythmias20 2007 NYSNA, all rights reserved. Material may not be reproduced without written permission.
Wrap up and Rhythm ExamplesWell that’s it; you have completed part III. Congratulations, take a walk or have a rest, but don’tgo too far. Be sure to follow on to the practice questions and master the skills of rhythminterpretation. Remember the interval sizes, proper wave morphology and always ask yourselfthe five questions. These will help you establish the rhythm at which you are looking. If you areuncertain of a rhythm break it down into the questions and revisit the different rhythms in Part III,choosing the most appropriate. Good luck! With continued practice you will be able to identifythese rhythms quickly and accura
Electrocardiograms Made Easy! is a series of three courses comprised of: Basic ECG Interpretations, Interpreting Abnormal Atrial Rhythms, and Interpreting Ventricular Dysrhythmias. This final course of the series will discuss ventricular dysrhythmias, many of which need


![[SURVEY PREVIEW MODE] DLIS SURVEY - fao](/img/19/dlis-questionnaire.jpg)