Transcription
EXPERT CONSENSUS STATEMENTCurrent and Evolving Echocardiographic Techniquesfor the Quantitative Evaluation of Cardiac Mechanics:ASE/EAE Consensus Statement on Methodologyand IndicationsEndorsed by the Japanese Society of EchocardiographyVictor Mor-Avi, PhD, FASE,* Roberto M. Lang, MD, FASE,† Luigi P. Badano, MD, FESC,Marek Belohlavek, MD, PhD, FESC, Nuno Miguel Cardim, MD, PhD, FESC, Genevi eve Derumeaux, MD, PhD, FESC,Maurizio Galderisi, MD, FESC, Thomas Marwick, MBBS, PhD, Sherif F. Nagueh, MD, FASE,Partho P Sengupta, MBBS, FASE, Rosa Sicari, MD, PhD, FESC, Otto A. Smiseth, MD, PhD, FESC,Beverly Smulevitz, BS, RDCS, Masaaki Takeuchi, MD, PhD, FASE, James D. Thomas, MD, FASE,Mani Vannan, MBBS, Jens-Uwe Voigt, MD, FESC, and Jos e Luis Zamorano, MD, FESC†, Chicago, Illinois;Padua, Naples, and Pisa, Italy; Scottsdale, Arizona; Lisbon, Portugal; Lyon, France; Cleveland and Columbus, Ohio;Houston, Texas; Irvine, California; Oslo, Norway; Kitakyushu, Japan; Leuven, Belgium; Madrid, Spain(J Am Soc Echocardiogr 2011;24:277-313.)Keywords: Ventricular function, Myocardial strain, Tissue Doppler, Myocardial Doppler, Tissue tracking,Speckle tracking, Integrated backscatterFrom the University of Chicago, Chicago, Illinois (V.M.-A., R.M.L.); the University ofPadua, Padua, Italy (L.P.B.); Mayo Clinic, Scottsdale, Arizona (M.B.); Hospital da Claude Bernard Lyon 1, Lyon, FranceLuz, Lisbon, Portugal (N.M.C.); Universite(G.D.); Federico II University Hospital of Naples, Naples, Italy (M.G.); ClevelandClinic, Cleveland, Ohio (T.M., J.D.T.); Methodist DeBakey Heart and VascularCenter, The Methodist Hospital, Houston, Texas (S.F.N.); the University ofCalifornia, Irvine, Irvine, California (P.P.S.); CNR Institute of Clinical Physiology,Pisa, Italy (R.S.); the University of Oslo, Oslo, Norway (O.a.S.); the University ofTexas, Houston, Texas (B.S.); the University of Occupational and EnvironmentalHealth, Kitakyushu, Japan (M.T.); Ohio State University, Columbus, Ohio (M.V.);University Hospital, Leuven, Belgium (J.-U.V.); and University Clinic San Carlos,Madrid, Spain (J.L.Z.).The following authors reported relationships with one or more commercial interests: Marek Belohlavek, MD, PhD, FESC, has had research supported in part byGE Healthcare (Milwaukee, WI), Siemens Medical Solutions (Erlangen, Germany),and Philips Medical Systems (Andover, MA). Mani Vannan, MBBS, received a perdiem from Siemens Medical Solutions and served as a consultant with LantheusMedical Imaging (North Billerica, MA). All other authors reported no actual orpotential conflicts of interest in relation to this document.Attention ASE Members:ASE has gone green! Visit www.aseuniversity.org to earn free continuing medical education credit through an online activity related to this article. Certificatesare available for immediate access upon successful completion of the activity.Nonmembers will need to join the ASE to access this great member benefit!Reprint requests: American Society of Echocardiography, 2100 Gateway CentreBoulevard, Suite 310, Morrisville, NC 27560 (E-mail: ase@asecho.org).* Writing Group chair and † Writing Group co-chairs; Writing Group members arelisted in alphabetical order.TABLE OF CONTENTSAbstract 277Abbreviations 2781. Terms and Definitions: Basic Parameters of MyocardialFunction 2782. Techniques Used to Assess Local Cardiac Chamber Wall Dynamics2.1. Doppler Tissue Imaging (DTI) 2782.2. Two-Dimensional (2D) Speckle-Tracking Echocardiography(STE) 2832.3. Three-Dimensional (3D) STE 2862.4. Integrated Backscatter (IBS) Analysis 2883. Physiologic Measurements of Left Ventricular Function3.1. LVArchitecture and Vectors of Myocardial Deformation 2903.2. Clinical Use of LV Displacement, Velocity, Strain, and SR 2923.3. LV Rotation 2933.4. LV Dyssynchrony 2953.5. LV Diastolic Function 2983.6. Myocardial Ischemia 2983.7. Fibrosis and Viability 3004. Physiologic Measurements of Right Ventricular and Left andRight Atrial Function4.1. Right Ventricle 3034.2. Left Atrium 3084.3. Right Atrium 3115. Conclusions 311ABSTRACT0894-7317/ 36.00Copyright 2011 by the American Society of ocardiographic imaging is ideally suited for the evaluation of cardiac mechanics because of its intrinsically dynamic nature. Because277
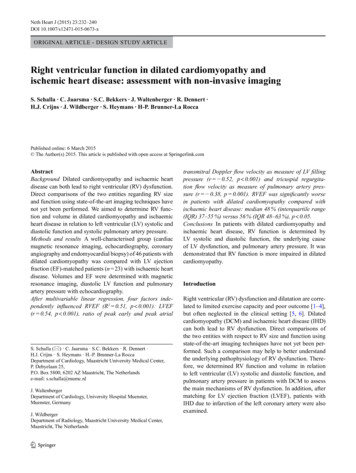
278 Mor-Avi et alfor decades, echocardiographyhas been the only imaging moASE American Society ofdality that allows dynamic imagEchocardiographying of the heart, it is onlynatural that new, increasingly auCRT Cardiactomated techniques for sophistiresynchronization therapycated analysis of cardiacDTI Doppler tissue imagingmechanics have been driven byresearchers and manufacturersEAE European Associationof Echocardiographyof ultrasound imaging equipment. Several such techniquesEF Ejection fractionhave emerged over the past deIBS Integrated backscattercades to address the issue ofreader’s experience and interIVPG Intraventricularmeasurement variability in interpressure gradientpretation. Some were widelyLV Left ventricularembraced by echocardiographers around the world andRV Right ventricularbecame part of the clinical rouSR Strain ratetine, whereas others remainedlimited to research and exploraSTE Speckle-trackingechocardiographytion of new clinical applications.Two such techniques have dom3D Three-dimensionalinated the research arena of2D Two-dimensionalechocardiography: (1) Dopplerbased tissue velocity measurements, frequently referred to as tissue Doppler or myocardialDoppler, and (2) speckle tracking on the basis of displacement measurements. Both types of measurements lend themselves to the derivation of multiple parameters of myocardial function. The goal of thisdocument is to focus on the currently available techniques that allowquantitative assessment of myocardial function via image-based analysis of local myocardial dynamics, including Doppler tissue imagingand speckle-tracking echocardiography, as well as integrated backscatter analysis. This document describes the current and potentialclinical applications of these techniques and their strengths and weaknesses, briefly surveys a selection of the relevant published literaturewhile highlighting normal and abnormal findings in the context ofdifferent cardiovascular pathologies, and summarizes the unresolvedissues, future research priorities, and recommended indications forclinical use.Abbreviations1. TERMS AND DEFINITIONS: BASIC PARAMETERS OFMYOCARDIAL FUNCTIONDisplacement, d, is a parameter that defines the distance that a certain feature, such as a speckle or cardiac structure, has moved between two consecutive frames. Displacement is measured incentimeters.Velocity, v, reflects displacement per unit of time, that is, how fastthe location of a feature changes, and is measured in centimeters persecond.Strain, e, describes myocardial deformation, that is, the fractionalchange in the length of a myocardial segment. Strain is unitless andis usually expressed as a percentage. Strain can have positive or negative values, which reflect lengthening or shortening, respectively. Inits simplest one-dimensional manifestation, a 10-cm string stretchedto 12 cm would have 20% positive strain.Strain rate, SR, is the rate of change in strain and is usually expressed as 1/sec or sec 1.Journal of the American Society of EchocardiographyMarch 2011Displacement and velocity are vectors; that is, in addition to magnitude, they have direction. Thus, one can examine their different spatialcomponents along the x, y, and z directions, or alternatively along theanatomic coordinates of the cardiac chambers, longitudinal, radial,and circumferential components, which are especially relevant forthe characterization of myocardial mechanics.Similar logic applies to strain and SR, which provide local information on myocardial deformation. The important advantage of strainand SR over displacement is that they reflect regional function independently of translational motion. Nevertheless, deformation imagingcannot distinguish active from passive deformation. The term ‘‘principal strain’’ describes the local magnitude and direction of the shortening or lengthening of the myocardium. The term ‘‘global strain’’ or,more precisely, ‘‘global longitudinal strain’’ or ‘‘global circumferentialstrain’’ usually refers to the average longitudinal or circumferentialcomponent of strain in the entire myocardium, which can be approximated by the averaged segmental strain components in individualmyocardial wall segments. Strain values can be expressed for eachsegment (‘‘segmental strain’’), as an average value for all segments(‘‘global strain’’ mentioned above), or for each of the theoretical vascular distribution areas (‘‘territorial strain’’).The term left ventricular (LV) rotation refers to myocardial rotation around the long axis of the left ventricle. It is rotational displacement and is expressed in degrees. Normally, the base and apex of theventricle rotate in opposite directions. The absolute apex-to-base difference in LV rotation is referred to as the net LV twist angle (also expressed in degrees). The term torsion refers to the base-to-apexgradient in the rotation angle along the long axis of the left ventricle,expressed in degrees per centimeter.2. TECHNIQUES USED TO ASSESS LOCAL WALL DYNAMICS2.1. Doppler Tissue Imaging (DTI)Since the early attempts to implement the concept of tracking tissuemotion using Doppler ultrasound1 and the subsequent developmentof DTI over the past two decades,2 this imaging technique has beenused by multiple investigators to advance the understanding of cardiac pathophysiology and test a variety of potential new diagnostictechniques, as evidenced by a large body of literature. Althoughmany of these techniques remained limited to the research arena,some have won widespread recognition and become mainstreamtools in the arsenal of clinical echocardiography.Although continuous-wave Doppler analyzes the frequency shift ofthe returning echoes compared with the original frequency of the ultrasound beam (Figure 1A), both pulsed-wave and color Doppler imaging use the phase shift between consecutive echoes for the velocitycalculation.3 In pulsed-wave Doppler mode, ultrasound wavelets areemitted repeatedly at a certain repetition frequency along a singlescan line, and the returning echoes are sampled at a preset time aftereach pulse is sent, allowing the determination of the distance betweenthe target and the transducer. The amplitude of the sampled echoesover time is then converted into a velocity spectrum using a fastFourier transform3 (Figure 1B). In color Doppler mode, the echo ofthe entire scan line is received and divided into several range gates.To determine the phase shift between pulses in all range gates, anauto-correlation algorithm is used to convert the phase shifts into velocity values, which are displayed in a color overlay of the image3(Figure 1C). Although pulsed-wave Doppler has the advantage of offering a direct curve display during the examination, only color
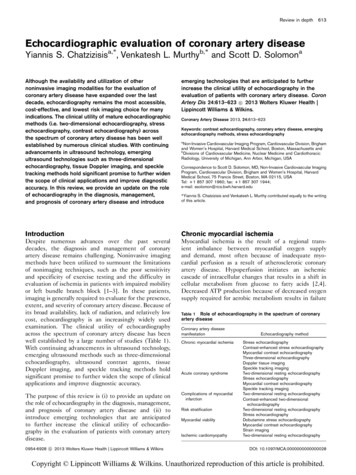
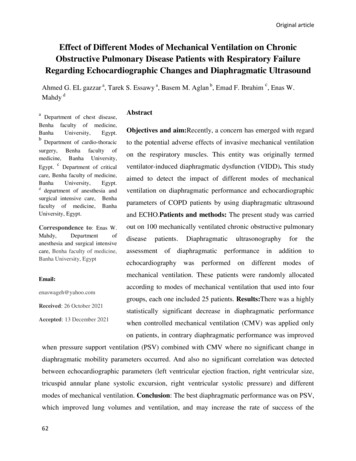
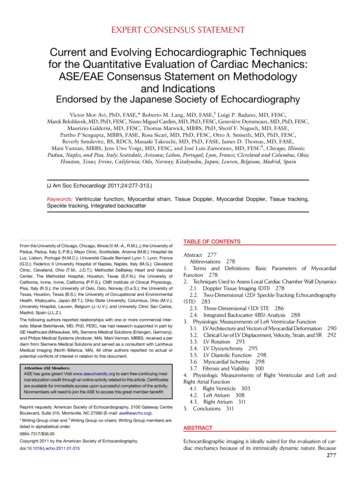
Journal of the American Society of EchocardiographyVolume 24 Number 3Mor-Avi et al 279Figure 1 (A) On continuous-wave Doppler, continuously emitted ultrasound with the frequency f0 returns with the frequency f0 Dfwhen reflected by a moving object. The envelope of the mixture of the sent and received signal has a frequency equal to the frequencyshift Df. In contrast, pulsed-wave and color Doppler analyze the phase shift between consecutive ultrasound pulses, while the frequency shift of the echoes is neglected. (B) On pulsed-wave Doppler, this phase shift is analyzed by sampling all echoes at thesame point in time after emission (range gate). Sample amplitudes over time form a signal, which is converted into a velocity spectrumusing the fast Fourier transform. (C) In color Doppler, the phase shift between consecutive pulses is measured by autocorrelation,resulting in velocities that are displayed in a color coded overlay. Modified with permission from Voigt.179Doppler allows postprocessing, including tracking of the samplevolume and calculating derived parameters (e.g., displacement or SR).Tissue Doppler velocity estimation is based on the same principlesas pulsed-wave and color Doppler echocardiography for blood flow.To distinguish between signals originating from moving tissue andblood flow, a so-called wall filter is used, which is a high-pass filterused to image blood velocities or a low-pass filter used to display tissue velocities. While the intensity of the signals generated by the myocardium is higher than that generated by blood, blood velocity usuallyexceeds that of the myocardium.DTI Acquisition: Spectral Doppler acquisition requires setting thesample volume size and position so that it remains within the region ofinterest inside the myocardium throughout the cardiac cycle. Scaleand baseline should be adjusted in a way that the signal fills most ofthe display. Sweep speed must be adjusted according to the application for measuring slopes and time intervals: high sweep speed formeasuring slopes in a few beats and low sweep speed for measuringpeak values in several beats. Some imaging systems enable retrospective adjustments of sweep speed in stored data without a loss of dataquality. Gain should be set to a value that produces an almost blackbackground with just some weak noise speckles, to ensure that no important information is lost. On the other hand, caution should betaken to avoid excessive gain, as this causes spectral broadeningand may cause overestimation of peak velocity. Although cardiac motion is three dimensional and complex, Doppler methods can measure only a single component of the regional velocity vector alongthe scan line. Care should therefore be taken to ensure that the ultrasound beam is aligned with the direction of the motion to be interrogated (Figure 2A). The angle of incidence should not exceed 15 ,thereby keeping the velocity underestimation to 4%. Only certainmotion directions can be investigated with Doppler techniques(Figure 2B). In LV apical views, velocity samples are usually obtainedat the annulus and at the basal end of the basal and mid levels and lessfrequently in the apical segments of the different walls.DTI Acquisition: Color Doppler requires a high frame rate, preferably 100 frames/sec, and ideally 140 frames/sec.3 This can beachieved by reducing depth and sector width (ideally both grayscaleand Doppler sectors) and by choosing settings that favor temporalover spatial resolution. Usually, the image is optimized in thegrayscale display before switching to the color mode and acquiringimages. Care should be taken to avoid reverberation artifacts bychanging interrogation angle and transducer position, because suchartifacts may affect SR estimations over a wide area (Figure 3). Thevelocity scale should be set to a range that just avoids aliasing inany region of the myocardium. Slowly scrolling through the imageloop before storing allows recognition of possible aliasing. As withspectral Doppler, the motion direction to be interrogated should bealigned with the ultrasound beam. If needed, separate acquisitionsshould be made for each wall from slightly different transducer positions. Data should be acquired over at least three beats, that is, covering at least four QRS complexes and stored in a raw data format.Older imaging systems that store only color values in an image shouldnot be used unless postprocessing is not planned. Acquisition of bloodflow Doppler spectra of the inlet and outlet valves of the interrogatedventricle provides useful information for timing of opening and closing of the valves, and thus for hemodynamic timing of measurementsobtained from the time curves of various parameters. For sufficienttemporal matching, all acquisitions should have similar heart rateand show the same electrocardiographic lead.DTI Image Analysis: Spectral Doppler data cannot be furtherprocessed. Peak velocities, slopes, and time intervals are measured directly on the spectral display. Figure 4 shows normal velocity timecurves obtained from the LV basal septum and lateral wall.
280 Mor-Avi et alJournal of the American Society of EchocardiographyMarch 2011Displacement, d, can be obtained by calculating the temporal integral of the tissue velocity, v:Zd¼v dt:Because of the nature of Doppler imaging, d describes only the motion component of the tissue in the sample volume toward or awayfrom the transducer, while components perpendicular to the beamremain unknown. Thus, the motion curve of the mitral annulus derived from color Doppler data should have the same shape and magnitude as the M-mode tracing of the mitral annulus obtained in thesame location.SR is the temporal derivative of strain. Analytically, it is identical tothe spatial gradient of tissue velocity and can therefore be obtainedfrom the color Doppler data, as the difference between velocitiesmeasured in two samples 1 and 2 divided by the distance r betweenthe two samples4:SR ¼v2 v1:rStrain can be calculated as the temporal integral of SR with appropriate mathematical adjustments4,5:Ze¼Figure 2 Doppler techniques measure velocities in one dimension. (A) Alignment of the Doppler beam with the wall is thereforeimportant. (Left) Measured velocities (yellow) are underestimated if the ultrasound beam is not well aligned with the motionto be interrogated (red). (Right) Narrow-sector single-wall acquisition may help minimize this problem. (B) Motion and deformation components that can be interrogated using Dopplertechniques. Modified with permission from J.U. Voigt.180DTI Image Analysis: Color Doppler data can be displayed andpostprocessed in different ways. Various function parameters canbe derived from a predefined region of interest within the same colorDoppler data set, including velocity, displacement, SR, and strain(Figure 5). Two display concepts are used: color coding with or without a straight or curved M-mode and reconstructed curves of regionalfunction. Color-coded data are best interpreted in still frames, particularly in M-mode displays. This way, there is easy visual access to theregional and temporal distribution of a particular parameter withinthe wall. Curve reconstructions are subsequently possible from anypoint within a stored data set (Figure 5). This allows displays of the exact time course of regional velocities and other parameters. An advantage of color Doppler processing over pulsed-wave Doppler is thatwith postprocessing, the sample volume can be adjusted to trackthe motion of the myocardium, thus staying in the same regionthroughout the entire cardiac cycle. Another advantage is that a sampling of the different myocardial regions is possible in the same time.Color Doppler Measurements of Myocardial Function: BecauseDoppler imaging generates velocity information, velocity, v, at any location and any time can be obtained directly from the color Doppler data.SR dt:Time curves can be generated from color Doppler data for each spatial component (i.e., longitudinal, radial, and circumferential) of eachof the above four parameters of cardiac function (Figure 6).The time course of a spectral Doppler velocity curve is similar toa color Doppler–derived one. However, absolute values differ because the spectral curve is usually measured at the outer edge ofthe spectrum, whereas color Doppler data approximate the mean velocity of a region, so that reported pulsed Doppler peak velocity is typically 20% to 30% higher than that measured by color Doppler.Accordingly, it is recommended that the modal velocity (the brightestor darkest line in the spectral display, depending on display) be usedfor pulsed Doppler measurements.Potential Pitfalls of DTI: Tissue Doppler velocities may be influenced by global heart motion (translation, torsion, and rotation), bymovement of adjacent structures, and by blood flow. These effectscannot be completely eliminated but may be minimized with theuse of a smaller sample size (which may, however, result in noisiercurves) and with careful tracking of the segment. To minimize the effects of respiratory variation, the patient should be asked to suspendbreathing for several heartbeats.The tissue Doppler signal can be optimized by making the width ofthe imaging beam as narrow as possible. Although temporal resolution is excellent with M-mode and spectral tissue Doppler, it is notas good with color tissue Doppler because of the lower frame rate.The apical views are best for measuring the majority of LV, rightventricular (RV), and atrial segments in a parallel-to-motion fashion,although there may be some areas of deficient spatial resolution, forinstance, near the apex, because of the prevalence of artifact andproblems with proximal resolution. In the parasternal long-axis andshort-axis views, tissue Doppler assessment is impossible in many segments (e.g., in the inferior interventricular septum and in the lateralwall) because the ultrasound beam cannot be aligned parallel to the
Journal of the American Society of EchocardiographyVolume 24 Number 3Mor-Avi et al 281Figure 3 Reverberation artifacts are best recognized in the grayscale image (A) and can be missed in the color Doppler display (B).They become again obvious in the color coded SR display as parallel yellow and blue lines of high intensity (C). If only the reconstructed time curve from such a region is considered (D), artifacts may be mistaken as highly pathologic curves mimicking ‘‘systoliclengthening’’ or ‘‘postsystolic shortening’’ (red arrows). Reproduced with permission from Voigt.180Figure 4 Normal tissue Doppler spectra obtained from the basal septum (left) and the basal lateral wall (right). Note the differentamplitudes and shapes of the curves. Reproduced with permission from Voigt.180direction of wall motion. Modified views should be used whenevernecessary to achieve the optimal imaging angle.Displacement and deformation of the myocardium are cyclic processes with no defined beginning or end. Therefore, the position ofthe baseline (zero line) is arbitrary. Most analysis packages definezero automatically as the value at the beginning of the QRS complex(red arrows in Figures 5B and 5D) and report the actual position orlength change relative to that value. Although useful for multiple applications, this approach may not work under certain circumstances(bundle branch blocks, wrong QRS detection on the electrocardiogram, atrial fibrillation, etc.). Care must be taken in such cases toclearly define and mark the beginning time point of deformation analysis or denote (perhaps by manual editing) the baseline (zero line) sothat comparable references are used during repeated studies.Furthermore, the integration used to calculate displacement andstrain often results in an erroneous baseline shift. Most software programs automatically apply a linear correction, which is often referredto as drift compensation (Figure 7).Strengths and Weaknesses of DTI: The major strength of DTIis that it is readily available and allows objective quantitative evaluation of local myocardial dynamics. Over the past decade, this ability triggered extensive research in a variety of disease states thataffect myocardial function, either globally or regionally, as reflectedby the large body of literature involving this methodology. It is wellestablished that peak tissue velocities are sufficiently reproducible,which is crucial for serial evaluations. Also, spectral pulsed DTIhas the advantage of online measurements of velocities and timeintervals with excellent temporal resolution, which is essential forthe assessment of ischemia (see section 3.6) and diastolic function(see section 3.5). The major weakness of DTI is its angle dependency, as any Doppler-based methodology can by definition onlymeasure velocities along the ultrasound beam, while velocity components perpendicular to the beam remain undetected. In addition,color Doppler–derived strain and SR are noisy, and as a result,training and experience are needed for proper interpretation andrecognition of artifacts.
282 Mor-Avi et alJournal of the American Society of EchocardiographyMarch 2011Figure 5 Function parameters derived from one region of interest (yellow dot) within the same color Doppler data set: (A) velocity, (B)displacement, (C) SR, and (D) strain. (Top) Color coded displays. (Below) Corresponding time curves. (Bottom) Electrocardiogram.Opening and closing artifacts allow the exact definition of the cardiac time intervals. Note that in this case, the baseline is arbitrarilyset to the curve value (red arrows) at the automatically recognized beginning of the QRS complex (red open bracket). AVC, Aorticvalve closure; AVO, aortic valve opening; MVC, mitral valve closure; MVO, mitral valve opening. Reproduced with permission fromCamm et al.1812.2. Two-Dimensional (2D) Speckle-TrackingEchocardiography (STE)STE is a relatively new, largely angle-independent technique used forthe evaluation of myocardial function. The speckles seen in grayscaleB-mode images are the result of constructive and destructive interference of ultrasound backscattered from structures smaller than the ultrasound wavelength. With this technology, random noise is filteredout, while keeping small temporally stable and unique myocardial features, referred to as speckles.6,7 Blocks or kernels of speckles can betracked from frame to frame (simultaneously in multiple regionswithin an image plane) using block matching, and provide localdisplacement information, from which parameters of myocardialfunction such as velocity, strain, and SR can be derived (Figure 8).In addition, instantaneous velocity vectors can be calculated andsuperimposed on the dynamic images (Figure 9). In contrast to DTI,analysis of these velocity vectors allows the quantification of strainand SR in any direction within the imaging plane. Depending on spatial resolution, selective analysis of epicardial, midwall, and endocardial function may be possible as well.8-10 STE has been validated forthe assessment of myocardial deformation against sonomicrometry7and clinically against DTI.112D STE Image Acquisition: Speckle tracking is an offline technique that is applied to previously acquired 2D images. The use oflow frame rates may result in a loss of speckles, which in successiveframes may move out of plane or beyond the search area. On theother hand, high frame rates may be achieved by reducing the number of ultrasound beams in each frame, thereby reducing the spatialresolution and image quality. Therefore, although frame rates of 40to 80 frames/sec have been used in various applications involvingnormal heart rates,12-14 higher frame rates are advisable to avoidundersampling in tachycardia.15,16The focus should be positioned at an intermediate depth to optimizethe images for 2D STE, and sector depth and width should be adjustedto include as little as possible outside the region of interest. Any artifactthat resembles speckle patterns will influence the quality of speckletracking, and thus care should be taken to avoid these. For softwarepackages that process single beats, data sampling should start 100msec before the peak R wave of the first QRS complex and end 200msec after the last QRS to allow correct identification of the QRS complex, because failure to do so may result in erroneous drift compensation. Apical foreshortening seriously affects the results of 2D STE, andshould therefore be minimized. Similarly, the short-axis cuts of the leftventricle should be circular shaped to assess the deformation in theanatomically correct circumferential and radial directions.2D STE Analysis of Myocardial Mechanics: Two-dimensionalSTE allows measurements of the above four parameters of myocardial mechanics by tracking groups of intramyocardial speckles (d orv) or myocardial deformation (e or SR) in the imaging plane. STEderived measurements of these parameters have been validatedagainst sonomicrometry17,18 and magnetic resonance imaging.15Assessment of 2D strain by STE is a semiautomatic method, whichrequires manual definition of the myocardium. Furthermore, the sampling region of interest needs to be adjusted to ensure that most of thewall thickness is incorporated in the analysis, while avoiding the
Journal of the American Society of EchocardiographyVolume 24 Number 3Mor-Avi et al 283when the base descends toward the apex in systole. Because LV rotation increases toward the apex, it is important to standardize the apicalshort-axis view. It is often easiest to find the correct circular apicalshort-axis view by tilting the probe from the apical four-chamberview rather than moving the probe in the apical direction from theparasternal short-axis view. The former also increases the chance ofcapturing a circular apical short-axis view when the endocardiumnearly closes at end-systole.19Global strain might be inaccurate if too many segmental strainvalues are discarded because of suboptimal tracking. This is particularly true in localized myocardial diseases where strain values are unevenly distributed.Figure 6 Segmental SR curves in the longitudinal, circumferential, and radial directions. Besides the inversion of the radialcurve, general patterns are similar.pericardium. When automated tracking does not fit with the visualimpression of wall motion, regions of interest need to be adjustedmanually until optimal tracking is achieved. For the left ventricle,because end-systole can be defined by aortic valve closure as seenin the apical long-axis view, this view should be analyzed first. If valveclosure is difficult to recognize accurately (e.g., because of aortic sclerosis), a spectral Doppler display of LV outflow may be helpful.Assessment of 2D strain by STE can be applied to both ventriclesand atria. However, because of the thin wall of the atria and right ventricle, signal quality may be suboptimal. In contrast, a
resynchronization therapy DTI Doppler tissue imaging EAE European Association of Echocardiography EF Ejection fraction IBS Integrated backscatter IVPG Intraventricular pressure gradient LV Left ventricular RV Right ventricular SR Strain rate STE Speckle-tracking echocardiography 3D Three-dimensional 2D Two-dimensional