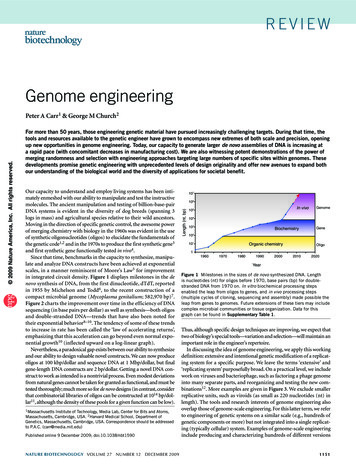
Transcription
Fabian et al., Supporting InformationSupporting Information for Fabian et al. "Genome-wide patterns of latitudinaldifferentiation among populations of Drosophila melanogaster from NorthAmerica"Additional supporting information may be found in the online version of this article.Table of Contents for Supporting InformationTable S1 Average nucleotide diversity π .3Table S2 Average scaled population mutation rate θW .4Table S3 Average pairwise FST values .5Table S4 Average pairwise FST in- and outside inversions .6Table S5 (separate Excel file) Top candidate genes . .7Table S6 Proportion of candidate SNPs within inversions . .8Table S7 (separate Excel file) Genome annotations of candidate genes .9Table S8 (separate Excel file) Gene ontology (GO) analysis of candidates.10Table S9 (separate Excel file) Overlap between FM candidate genes and thoseidentified by Kolaczkowski et al. (2011) . . . . .11Fig. S1 Average coverage of pool-seq samples .12Fig. S2 Average scaled population mutation rate θ W .13Fig. S3 Frequency of the major cosmopolitan inversion In(3R)Payne .14Fig. S4 Overlap of candidate genes among population comparisons .15Fig. S5 Decay of statistical significance around candidate SNPs .16-21Appendix S1 Examples of candidate genes in the insulin/insulin-like growthfactor (IIS) and target of rapamycin (TOR) signaling pathways .22-28Appendix S2 Examples of candidate genes involved in ecdysone biosynthesisand signaling .29-35Appendix S3 Examples of candidate genes involved in nuclear hormonereceptor (NHR) signaling and other endocrine pathways .36-38Appendix S4 Examples of candidate genes involved in lipid metabolism .39-411
Fabian et al., Supporting InformationAppendix S5 Examples of candidate genes involved in innate immunity(Toll/Imd signaling) .42-47Appendix S6 Examples of candidate genes involved in epidermal growthfactor (EGFR) signaling . .48-50App. S7 Examples of candidate genes involved in JAK/STAT signaling.51-54App. S8 Examples of candidate genes involved in TGF-β/BMP signaling. 55-57Appendix S9 Examples of candidate genes involved in torso signaling .58-60App. S10 Examples of candidate genes involved in circadian rhythms.61-64App. S11 Examples of candidate genes involved in learning and memory.65-69Appendix S12 Examples of some transcription factor candidate genes .70-73Appendix S13 (separate folder with word files and Python scripts)Folder containing a description of the bioinformatic analysis pipeline,including Python scripts .74Appendix S14 (separate folder with individual pdf files) Folder containing plotsfor each clinal (“plus plus”) candidate gene, showing the changes in allelefrequency for the candidate gene as a function of latitude . .752
Fabian et al., Supporting InformationTable S1 Average nucleotide diversity π . Average π (average across SNP-wise πvalues) for each population and chromosomal arm. SE, standard error of the mean.Levels not connected by same letter are significantly different in a two-way ANOVAon rank-transformed means followed by a Tukey HSD posthoc test (details notshown). While chromosomal arms differed significantly in π, populations did not.Note, however, that the test of population variation, using ranks of means and onlythree populations, is not very powerful. To further examine whether populations differin π we therefore applied a Kruskal-Wallis rank sum test on average π valuesestimated in non-overlapping 200 kb windows across the entire genome. Populationsdiffered significantly in π, with Florida exhibiting higher diversity than Pennsylvaniaand Maine, while Pennsylvania and Maine did not differ from each other (KruskalWallis χ2 16.8, df 2, P 0.001; followed by pairwise Wilcoxon rank sum posthoctests, details not -60.00508.8x10-60.00508.9x10-63
Fabian et al., Supporting InformationTable S2 Average scaled population mutation rate θW. Average θW (averageacross SNP-wise θW values) for each population and chromosomal arm. SE, standarderror of the mean. Levels not connected by same letter are significantly different in atwo-way ANOVA on rank-transformed data followed by a Tukey HSD posthoc test(details not shown). While chromosomal arms differed significantly in θW,populations did not. Note, however, that the test of population variation, using ranksof means and only three populations, is not very powerful. To further examinewhether populations differ in θW we therefore applied a Kruskal-Wallis rank sum teston average θW values estimated in non-overlapping 200 kb windows across the entiregenome. Populations differed significantly in θW, with Florida exhibiting higherdiversity than Pennsylvania and Maine, while Pennsylvania and Maine did not differfrom each other (Kruskal-Wallis χ2 22.3, df 2, P 0.001; followed by pairwiseWilcoxon rank sum posthoc tests, details not �WSEθWSEXA0.00448.6 x10-60.00418.3x10-60.00408.4x10-62LB0.00771.1 x10-50.00721.1x10-50.00711.1x10-52RC0.00641.1 x10-50.00621.0x10-50.00641.1x10-53LC0.00701.0 0.00528.0x10-60.00528.1x10-64
Fabian et al., Supporting InformationTable S3 Average pairwise FST values. Average pairwise FST values (averageacross SNP-wise FST values) for each population comparison and chromosomal arm.SE, standard error of the mean. Levels not connected by same letter are significantlydifferent in a two-way ANOVA on rank-transformed data followed by a Tukey HSDposthoc test. See text for further details.Florida - MaineAFlorida PennsylvaniaAPennsylvania x10-55
Fabian et al., Supporting InformationTable S4 Average pairwise FST in- and outside inversions. Average pairwise FST was estimated in- and outside four major cosmopolitaninversions for each population comparison, using 1 kb non-overlapping windows. “FST in”: FST inside the inversion; “FST out”, FST of thechromosomal arm outside the inversion. Significant differences between “FST in” and “FST out” in boldface (Wilcoxon Rank Sum Test, α 0.01). SE, standard error of the mean.Florida – MaineFlorida - PennsylvaniaPennsylvania - MaineInversionFST inSEFST outSEFST inSEFST outSEFST inSEFST 9x10-40.02781.2x10-46
Fabian et al., Supporting InformationPlease see separate Excel (.xls) file:Table S5 (Excel) Top candidate genes. Sheets FM (comparison Florida - Maine);FP (comparison Florida - Pennsylvania); PM (comparison Pennsylvania - Maine)show mean FST values for each candidate gene calculated using (a) candidate SNPsonly and (b) all polymorphic SNPs. SE, standard error of the mean. Sheets A - Gshow the candidate genes in the different intersections of the Venn diagram shown inFig. S4.7
Fabian et al., Supporting InformationTable S6 Proportion of candidate SNPs within inversions. Enrichment was testedusing one-sided FETs, with significant enrichment relative to the rest of thechromosomal arm shown in boldface. ov, overrepresented; un, underrepresented. FM,comparison Florida - Maine; FP, Florida - Pennsylvania; PM, Pennsylvania - 0.67ov0.68ov0.418
Fabian et al., Supporting InformationPlease see separate Excel (.xls) file:Table S7 (Excel) Genome annotations of candidate genes. Candidate genes insignificantly over- and underrepresented genome annotation categories for eachpairwise population comparison. FM, comparison Florida - Maine; FP, Florida Pennsylvania; PM, Pennsylvania - Maine.9
Fabian et al., Supporting InformationPlease see separate Excel (.xls) file:Table S8 (Excel) Gene ontology (GO) analysis of candidate genes. Gene ontology(GO) analysis of candidate genes for each pairwise population comparison and theclinal ("plus plus") genes. Columns contain: (1) GO category; (2) average number ofgenes obtained per simulation (10 million simulations); (3) candidate genes detectedfor the category; (4) empirical P-values; (5) false discovery rate (FDR); (6) totalgenes with at least one differentiated site; (7) total number of genes known in eachcategory; (8) GO category name; (9) FBgn number of candidate genes detected for thecategory. FM, comparison Florida - Maine; FP, Florida - Pennsylvania; PM,Pennsylvania - Maine; "Plus Plus", clinal genes. See text for further details.10
Fabian et al., Supporting InformationPlease see separate Excel (.xls) file:Table S9 (Excel) Overlap between FM candidate genes and those identified byKolaczkowski et al. (2011). This table shows the overlap between the candidategenes identified for the endpoints of the North American cline (Florida versus Maine)and the Australian cline (Queensland versus Tasmania; see Kolaczkowski et al.2011), using a window-based approach (top 5% of non-overlapping 1 kb windowswith highest FST). Details of the methods are given in the table; also see main text forfurther details.11
Fabian et al., Supporting InformationFig. S1 Average coverage of pool-seq samples. Average sequence coverage ofIllumina-sequenced pooled samples for each chromosomal arm and population afterprocessing of raw FASTA files. Error bars represent standard deviations (SD). Meanread depth of the euchromatic genome (X, 2L, 2R, 3L, 3R) was 47.4x in Florida, 45.3xin Pennsylvania, and 45.4x in Maine.12
Fabian et al., Supporting InformationFig. S2 Average scaled population mutation rate θ W. Average θW was estimatedover 200 kb non-overlapping windows and plotted separately for each chromosomalarm. Florida (black line); Pennsylvania (green); and Maine (red). Regions where theline is broken represent windows where the coverage was outside our predefinedminimum/maximum coverage interval, i.e. windows with 60% of the SNPsfulfilling our coverage criteria. The grey boxes indicate the approximate regionsspanned by four major cosmopolitan inversions on the left and right arms ofchromosome 2 (In(2L)t and In(2R)NS) and chromosome 3 (In(3L)P and In(3R)P).Note that the 4th (dot) chromosome is not shown.13
Fabian et al., Supporting InformationFig. S3 Frequency of the major cosmopolitan inversion In(3R)Payne. We usedfour different, previously published molecular markers to estimate the frequency ofIn(3R)P in each population. (a) an indel marker in hsr-omega (see Anderson et al.2003). (b) - (d) 3 SNP markers in tolkin from Matzkin et al. (2005): (b) T1444C, (c)C245T, and (d) T249C (see Matzkin et al. 2005 for details).14
Fabian et al., Supporting InformationFig. S4 Overlap of candidate genes among population comparisons. The Venndiagram shows the number of candidate genes for different intersections of the threepairwise population comparisons. FM (Florida - Maine; red), FP (Florida Pennsylvania; blue); PM (Pennsylvania - Maine; green). (A) candidate genes uniquefor FM; (B) candidate genes unique for FP; (C) candidate genes unique for PM; (D)candidate genes overlapping only between FM and FP; (E) candidate genesoverlapping only between FM and PM; (F) candidate genes overlapping only betweenFP and PM; (G) candidate genes occurring in all three comparisons. For lists ofcandidate genes see Table S6.15
Fabian et al., Supporting InformationFig. S5 Decay of statistical significance around candidate SNPs. Median log10(P)-values from FET for SNPs flanking the candidate SNPs for all pairwisepopulation comparisons, shown for (i) each chromosomal arm (A, B), (ii) the regionspanned by In(3R)P (C, D), and (iii) averaged across all autosomes, without andwithout 3R (E). FM, Florida - Maine; FP, Florida - Pennsylvania; PM, Pennsylvania Maine. (A) – (B) Median estimated either using 100 bp windows (A) or 10 bpwindows (B) and either covering a region of 100 kb (A) or 0.5 kb (B) upstream anddownstream of candidate SNPs. Black line: median of SNPs flanking candidate SNPs;red line: median of SNPs 500 kb away from candidate SNPs. (C) – (D) Medianestimated for In(3R)P either using 100 bp windows (C) or 10 bp windows (D) andeither covering a region of 100 kb (C) or 0.5 kb (D) upstream and downstream ofcandidate SNPs. Dark blue line: median of SNPs flanking candidate SNPs inside theinversion In(3R)P; light blue line: median of SNPs flanking candidate SNPs outsidethe inversion In(3R)P; dark red line: median of SNPs inside the inversion In(3R)P and 500 kb away from candidate SNPs; light red line: median of SNPs outside theinversion In(3R)P and 500 kb away from candidate SNPs. (E) Median estimatedacross all autosomes including 3R (left column) and without 3R (right column) foreach pairwise population comparison, using 100 bp windows. Dark line: median ofSNPs flanking candidate SNPs; light lines: median of SNPs 500 kb away fromcandidate SNPs. See text for further details.Note: Use the Zoom function in Adobe Acrobat to zoom into the individualfigures and to view detailed aspects of the graphs.16
Fabian et al., Supporting InformationFig. S517
Fabian et al., Supporting Information18
Fabian et al., Supporting Information19
Fabian et al., Supporting Information20
Fabian et al., Supporting Information21
Fabian et al., Supporting InformationAppendix S1Examples of candidate genes in the insulin/insulin-like growth factor (IIS)and target of rapamycin (TOR) signaling pathways§14-3-3 F8Pi3K92E9tobi10Tor11Tsc111Shown are pairwise FST values of the candidate SNPs identified in the differentpopulation comparisons; red: Florida-Maine, blue: Florida-Pennsylvania,green: Pennsylvania-Maine.Notes:§IIS/TOR signaling affects many physiological and metabolic processes andfunctions, including growth; carbohydrate, lipid and amino acid metabolism;regulation of production of downstream secondary hormones such as juvenilehormone and ecdysone; body size, reproduction, reproductive dormancy,stress resistance, lifespan, and immune function. For reviews of thesepathways, especially for their relevance in affecting lifespan, see Tatar et al.(2003) and Partridge et al. (2011).* Also found by Kolaczkowski et al. (2011)1Well known in C. elegans to affect lifespan via interaction with Daf-16/Foxo;also interacts with Foxo and affects lifespan in Drosophila (Nielsen et al.2008). Also see: ially involved in pro-insulin cleavage and insulin production (Rayburnet al. 2003); implicated in the production of adipokinetic hormone (AKH, a22
Fabian et al., Supporting Informationglucagon-like hormone in insects; Rhea et al. 2010). For further informationsee: http://flybase.org/reports/FBgn0023179.html3Foxo is a forkhead box O transcription factor downstream of IIS; affectslifespan and other life history traits in Drosophila (e.g., Hwangbo et al. 2004);has also been shown to affect diapause/dormancy in mosquitos (Sim andDenlinger 2008). See: http://flybase.org/reports/FBgn0038197.html4Hmgcr encodes a HMG (hydroxymethlyglutaryl) coenzyme A reductase;probably indirectly involved in IIS; affects the production of juvenile hormoneproduction downstream of IIS (Belgacem et al. 2007). For further informationsee: ila insulin-like peptides 3 and 5 (ilp or dilp3 and 5); peptide ligandsfor the insulin-like receptor InR; different dilps have been implicated in theregulation of growth, carbohydrate metabolism, and lifespan. See, forexample, Grönke and Partridge (2010) and Grönke et al. (2010). For furtherinformation on dilp3 see: http://flybase.org/reports/FBgn0044050.html; for dilp5see: http://flybase.org/reports/FBgn0044048.html6IGF-II mRNA binding protein; might potentially be involved in IIS signaling.For further information see: http://flybase.org/reports/FBgn0262735.html7InR, insulin-like receptor; known to affect body size, developmental time,fecundity and fertility, lifespan and the production of secondary hormonesdownstream of IIS such as juvenile hormone and ecdysone (see SS S2) inDrosophila (e.g., Tatar et al. 2001; also see Flatt et al. 2005 for a review);found to be strongly clinal along the east coast of the USA and Australia, withnatural alleles affecting Drosophila life history traits (Paaby et al. 2010). Alsosee: F encodes Phosphotidylinositol 3 kinase 59F; might be involved inTOR signaling (e.g., Teleman et al. 2010). For further information so known as PI3K or Dp110 rtant in IIS: phosphatidylinositol-4,5-bisphosphate 3-kinase activity; hasbeen found to be genetically associated with natural variation in the incidenceof reproductive dormancy in D. melanogaster (Williams et al. 2006);genetically interacts with cpo (see App. S2; Schmidt 2011)10tobi, target of brain insulin, is a relatively recently discovered gene involvedin IIS/AKH (glucagon) signaling (Buch et al. 2008). For further information oth involved in target of rapamycin (TOR) signaling, with known effects onDrosophila lifespan and metabolism (e.g., Oldham and Hafen 2003; Kapahi etal. 2004; Luong et al. 2006; Partridge et al. 2011). For further details on Torsee: http://flybase.org/reports/FBgn0021796.html; for details on Tsc1 see:http://flybase.org/reports/FBgn0026317.html23
Fabian et al., Supporting InformationReferences:Belgacem YH, Martin JR (2007) Hmgcr in the corpus allatum controls sexualdimorphism of locomotor activity and body size via the insulin pathway inDrosophila. PLoS ONE 2, e187.Buch S, Melcher C, Bauer M, Katzenberger J, Pankratz MJ (2008) Opposingeffects of dietary protein and sugar regulate a transcriptional target ofDrosophila insulin-like peptide signaling. Cell Metabolism 7, 321-332.Flatt T, Tu MP, Tatar M (2005) Hormonal pleiotropy and the juvenile hormoneregulation of Drosophila development and life history. BioEssays 27, 9991010.Grönke S, Partridge L (2010) The Functions of Insulin-like Peptides in Insects.In: Clemmons D, Robinson, ICAF, Christen, Y (editors), IGFs: Local Repairand Survival Factors Throughout Life Span, pp. 105-124. Springer: Berlin,Heidelberg.Grönke S, Clarke D-F, Broughton S, Andrews TD, Partridge L (2010)Molecular Evolution and Functional Characterization of Drosophila InsulinLike Peptides. PLoS Genetics 6, e1000857.Hwangbo DS, Gershman B, Tu MP, Palmer M, Tatar M (2004b) DrosophiladFOXO controls lifespan and regulates insulin signalling in brain and fatbody. Nature 429, 562-566.Kapahi P, Zid BM, Harper T, et al. (2004) Regulation of lifespan in Drosophilaby modulation of genes in the TOR signaling pathway. Current Biology 14,885-890.Kolaczkowski B, Kern AD, Holloway AK, Begun DJ (2011) GenomicDifferentiation Between Temperate and Tropical Australian Populations ofDrosophila melanogaster. Genetics 187, 245-260.Luong N, Davies CR, Wessells RJ, et al. (2006) Activated FOXO-mediatedinsulin resistance is blocked by reduction of TOR activity. Cell Metabolism4, 133-142.Oldham S, Hafen E (2003) Insulin/IGF and target of rapamycin signaling: aTOR de force in growth control. Trends in Cell Biology 13, 79-85.Nielsen MD, Luo X, Biteau B, Syverson K, Jasper H (2008) 14-3-3ɛantagonizes FoxO to control growth, apoptosis and longevity in Drosophila.Aging Cell 7, 688-699.Paaby AB, Blacket MJ, Hoffmann AA, Schmidt PS (2010) Identification of acandidate adaptive polymorphism for Drosophila life history by parallelindependent clines on two continents. Molecular Ecology 19, 760-774.Partridge L, Alic N, Bjedov I, Piper MDW (2011) Ageing in Drosophila: The roleof the insulin/IGF and TOR signalling network. Experimental Gerontology46, 376-381.Rayburn LYM, Gooding HC, Choksi SP, et al. (2003) amontillado, theDrosophila Homolog of the Prohormone Processing Protease PC2, IsRequired During Embryogenesis and Early Larval Development. Genetics163, 227-237.Rhea JM, Wegener C, Bender M (2010) The Proprotein Convertase Encodedby amontillado (amon) Is Required in Drosophila Corpora CardiacaEndocrine Cells Producing the Glucose Regulatory Hormone AKH. PLoSGenetics 6, e1000967.24
Fabian et al., Supporting InformationSchmidt PS (2011) Evolution and mechanisms of insect reproductivediapause: a plastic and pleiotropic life history syndrome. In Mechanisms ofLife History Evolution (T Flatt, A Heyland, eds.). Pp. 230-242. Oxford:Oxford University Press.Sim C, Denlinger D (2008) Insuling signaling and FOXO regulate theoverwintering diapause of the mosquito Culex pipiens. Proc. Natl. Acad.Sci. USA 105, 6777 - 6781.Tatar M, Kopelman A, Epstein D, et al. (2001) A mutant Drosophila insulinreceptor homolog that extends life-span and impairs neuroendocrinefunction. Science 292, 107-110.Tatar M, Bartke A, Antebi A (2003) The endocrine regulation of aging byinsulin-like signals. Science 299, 1346-1351Teleman AA (2010) Molecular mechanisms of metabolic regulation by insulinin Drosophila. Biochemical Journal 425, 13-26.Williams KD, Busto M, Suster ML, et al. (2006) Natural variation in Drosophilamelanogaster diapause due to the insulin-regulated PI3-kinase. Proc. Natl.Acad. Sci. USA 103, 15911-15915.25
Fabian et al., Supporting Information26
Fabian et al., Supporting Information27
Fabian et al., Supporting Information28
Fabian et al., Supporting InformationAppendix S2Examples of candidate genes involved in ecdysone biosynthesis 08svp9woc10Shown are pairwise FST values of the candidate SNPs identified in the differentpopulation comparisons; red: Florida-Maine, blue: Florida-Pennsylvania,green: Pennsylvania-Maine.Notes:§For reviews of this pathway see, for example, King-Jones and Thummel(2005) and Schwedes and Carney (2012). For a review of the biosynthesis ofecdysteroids see Gilbert et al. (2002). The active steroid hormone 20-hydroxyecdysone (20E; "ecdysone") has pervasive effects on various aspects ofDrosophila life history, including effects on metamorphosis, growth, ovarianmaturation, reproductive dormancy, lifespan, and immunity (e.g., see Kozlovaand Thummel 2000; Simon et al. 2003; Flatt et al. 2005; King-Jones andThummel 2005; Flatt et al. 2008; Tricoire et al. 2009; Galikova et al. 2011, andreferences therein)* Also found by Kolaczkowski et al. (2011)#Also found by Turner et al. (2011) in an artificial selection experiment onbody size in D. melanogaster. It is particularly noteworthy that severalecdysone signaling genes were found by Turner et al. (2011) as well as in ourstudy since ecdysone signaling affects many life history traits including growth29
Fabian et al., Supporting Informationand body size (e.g., Colombani et al. 2005) and since body size is stronglyclinal along the US east coast (e.g., Coyne and Beecham 1987)1Found to be clinal along the US east coast and to affect the propensity ofreproductive dormancy and related life history phenotypes by Schmidt et al.(2008); cpo contains a large number of ecdysone response elements (Schmidtet al. 2008) and is expressed in the larval ring gland, the main site of larvalecdysteroid production (Harvie et al. 1998); notably, reproductive dormancy isknown to be affected ecdysteroids (e.g., Richard et al. 1998, 2001; Flatt et al.2005). See: http://flybase.org/reports/FBgn0000363.html for further details2dib, disembodied; involved in the biosynthesis of ecdysone (Chavez et al.2000). For details see: http://flybase.org/reports/FBgn0000449.html3Gene involved in chromatin binding; mutations in this gene causeecdysteroid deficiency (Sliter and Gilbert 1992); for further information dysone-inducible proteins (Eip) or genes (Eig); these are genes/proteinsknown to be transcriptionally induced/regulated by ecdysone; for detailedinformation on these genes see King-Jones and Thummel (2005) Bgn0013948.html5Eip75B has been found to be associated with the startle response byYamamoto et al. (2008) and in a GWAS study based on the DGRP lines byMackay et al. (2012); it has also been identified in a P-element insertionscreen to affect lifespan (Magwire et al. 2010)6Hormone receptor 46; also known as dHR3; a nuclear hormone receptor;known to affect embryogenesis and growth; also interacts with IIS (App. S1)(Carney et al. 1997; King-Jones and Thummel 2005; Montagne et al. 2010).For details see: http://flybase.org/reports/FBgn0000448.html7Also known as moses; found by Kolaczkowski et al. (2011) to be clinal;interacts with Hormone receptor 78 (Hr78) and thus with ecdysone signaling(Baker et al. 2007). See: http://flybase.org/reports/FBgn0032330.html8Might be involved in ecdysteroid secretion (Andrews et al. 2002). p, seven up; uclear hormone receptor (NHR) known to interact withecdysone signaling (see Gates et al. 2004; King-Jones and Thummel 2005).See: http://flybase.org/reports/FBgn0003651.html30
Fabian et al., Supporting Information10woc, without children; found by Turner et al. (2008) to be clinal; woc mutantsare ecdysteroid deficient (Warren et al. 2001). For further information erences:Andrews HK, Zhang YQ, Trotta N, Broadie K (2002) Drosophila sec10 isrequired for hormone secretion but not general exocytosis orneurotransmission. Traffic 3, 906-921.Baker KD, Beckstead RB, Mangelsdorf DJ, Thummel CS (2007) Functionalinteractions between the Moses corepressor and DHR78 nuclear receptorregulate growth in Drosophila. Genes & Development 21, 450-464.Carney GE, Wade AA, Sapra R, Goldstein ES, Bender M (1997) DHR3, anecdysone-inducible early-late gene encoding a Drosophila nuclear receptor,is required for embryogenesis. Proc. Natl. Acad. Sci. USA 94, 12024-12029.Chavez VM, Marques G, Delbecque JP, et al. (2000) The Drosophiladisembodied gene controls late embryonic morphogenesis and codes for acytochrome P450 enzyme that regulates embryonic ecdysone levels.Development 127, 4115-4126.Colombani J, Bianchini L, Layalle S, et al. (2005) Antagonistic Actions ofEcdysone and Insulins Determine Final Size in Drosophila. Science 310,667-670.Coyne JA, Beecham E (1987) Heritability of Two Morphological CharactersWithin and Among Natural Populations of Drosophila melanogaster.Genetics 117, 727-737.Flatt T, Heyland A, Rus F, et al. (2008) Hormonal regulation of the humoralinnate immune response in Drosophila melanogaster. Journal ofExperimental Biology 211, 2712-2724.Flatt T, Tu M-P, Tatar M (2005) Hormonal pleiotropy and the juvenile hormoneregulation of Drosophila development and life history. BioEssays 27, 9991010.Galikova M, Klepsatel P, Senti G, Flatt T (2011) Steroid hormone regulation ofC. elegans and Drosophila aging and life history. Experimental Gerontology46, 141-147.Gates J, Lam G, Ortiz JA, Losson R, Thummel CS (2004) rigor mortis encodesa novel nuclear receptor interacting protein required for ecdysone signalingduring Drosophila larval development. Development 131, 25-36.Gilbert LI, Rybczynski R, Warren JT (2002) Control and biochemical nature ofthe ecdysteroidogenic pathway. Annual Review of Entomology 47, 883-916.Harvie PD, Filippova M, Bryant PJ (1998) Genes Expressed in the Ring Gland,the Major Endocrine Organ of Drosophila melanogaster. Genetics 149, 217231.King-Jones K, Thummel CS (2005) Nuclear receptors - A perspective fromDrosophila. Nature Reviews Genetics 6, 311-323.Kolaczkowski B, Kern AD, Holloway AK, Begun DJ (2011) GenomicDifferentiation Between Temperate and Tropical Australian Populations ofDrosophila melanogaster. Genetics 187, 245-260.31
Fabian et al., Supporting InformationKozlova T, Thummel CS (2000) Steroid regulation of postembryonicdevelopment and reproduction in Drosophila. Trends in Endocrinology andMetabolism 11, 276-280.Magwire MM, Yamamoto A, Carbone MA, et al. (2010) Quantitative andMolecular Genetic Analyses of Mutations Increasing Drosophila Life Span.PLoS Genetics 6, e1001037Mackay TFC, Richards S, Stone EA, et al. (2012) The Drosophilamelanogaster Genetic Reference Panel. Nature 482, 173-178.Montagne J, Lecerf C, Parvy J-P, et al. (2010) The Nuclear Receptor DHR3Modulates dS6 Kinase Dependent Growth in Drosophila. PLoS Genetics 6,e1000937.Richard DS, Jones JM, Barbarito MR, et al. (2001) Vitellogenesis indiapausing and mutant Drosophila melanogaster: further evidence for therelative roles of ecdysteroids and juvenile hormones. Journal of InsectPhysiology 47, 905-913.Richard DS, Watkins NL, Serafin RB, Gilbert LI (1998) Ecdysteroids
populations did not. Note, however, that the test of population variation, using ranks of means and only three populations, is not very powerful. To further examine whether populations differ in θ W we therefore applied a Kruskal-Wallis rank sum test on average θ W values estimated in non-overlapping 200 kb windows across the entire genome.