Transcription
Signal, Image and Video Processing (2021) 1869-7ORIGINAL PAPERStudent behavior analysis to measure engagement levels in onlinelearning environmentsKhawlah Altuwairqi1· Salma Kammoun Jarraya1,2 · Arwa Allinjawi1 · Mohamed Hammami2,3Received: 5 July 2020 / Revised: 22 January 2021 / Accepted: 29 January 2021 / Published online: 14 May 2021 The Author(s), under exclusive licence to Springer-Verlag London Ltd., part of Springer Nature 2021AbstractAfter the COVID-19 pandemic, no one refutes the importance of smart online learning systems in the educational process.Measuring student engagement is a crucial step towards smart online learning systems. A smart online learning systemcan automatically adapt to learners’ emotions and provide feedback about their motivations. In the last few decades, onlinelearning environments have generated tremendous interest among researchers in computer-based education. The challengethat researchers face is how to measure student engagement based on their emotions. There has been an increasing interesttowards computer vision and camera-based solutions as technology that overcomes the limits of both human observationsand expensive equipment used to measure student engagement. Several solutions have been proposed to measure studentengagement, but few are behavior-based approaches. In response to these issues, in this paper, we propose a new automaticmultimodal approach to measure student engagement levels in real time. Thus, to offer robust and accurate student engagement measures, we combine and analyze three modalities representing students’ behaviors: emotions from facial expressions, keyboard keystrokes, and mouse movements. Such a solution operates in real time while providing the exact level ofengagement and using the least expensive equipment possible. We validate the proposed multimodal approach through threemain experiments, namely single, dual, and multimodal research modalities in novel engagement datasets. In fact, we buildnew and realistic student engagement datasets to validate our contributions. We record the highest accuracy value (95.23%)for the multimodal approach and the lowest value of “0.04” for mean square error (MSE).Keywords Academic facial emotions · Keyboard and mouse behaviors · Convolutional neural network (CNN) · Affectivemodel · Engagement level1 IntroductionIn the social isolation period due to the COVID-19 pandemic, the educational system has shifted from physicaleducation to full distance education that highly depends onmodern technologies such as webcams and microphones.This shift has caused a disconnection of human interaction,yet it has also shown the immense potential of online education and employment. In the educational context, assessing* Khawlah t of Computer Science, King AbdulazizUniversity, Jeddah, Saudi Arabia2MIRACL-Laboratory, Sfax, Tunisia3Department of Computer Science, Faculty of Science, SfaxUniversity, Sfax, Tunisiastudent motivation and interaction are a key part in controlling the learning environment. Distance learning has madeit difficult to maintain these aspects of supervision and control, which may negatively impact student motivation andevaluation. A smart online learning system is an innovativeapproach that can automatically adapt to learners’ emotions, provide feedback about their motivations and practically incorporate new technologies and ways of expressionby developing computer vision [1]. Engagement is one ofthe qualitative indicators in the learning process [2]. It hasa three-dimensional structure during learning [3], namelybehavioral engagement such as staying on task, emotionalengagement such as being bored, and cognitive engagement such as focused attention [2]. All these dimensionsare important to measure engagement levels. Many researchers have proposed engagement levels to classify studentsdepending on engagement states. They started by assessingstudents’ engagement to detect their levels.13Vol.:(0123456789)
1388Among the various instruments that help measure studentengagement are three popular tools: self-reports, observational checklists, and automated measurements [2]. Bothself-reports and observational checklists are still very primitive and not suitable for real-time learning systems. Currently, engagement can be automatically measured based onaffective computing. The affective computing domain hasprovided smart solutions to detect students’ emotions. Someresearchers highlight the importance of monitoring students’emotions and the way emotions can be detected as a reflection of student engagement [2]. Automated measurementsare based on physiological and neurological sensor readings,like electroencephalography (EEG), heart rate, etc. [4]. Theycan also rely on computer vision techniques, such as facialexpressions, keyboard keystrokes, and mouse movements(touchpad), etc.Based on our overview, opportunities for increasing theaccuracy of engagement measures will arise when we usemore than one modality. Smart e-learning systems basedon student engagement have generated a great deal of interest among researchers of the computer vision community inorder to advance research in the computer-based educationalfield. This is motivated by two major factors: (1) measuringstudent engagement plays a key role in building smart onlinelearning systems (adaptation and motivation), so there isa need to develop an accurate automated system in orderto improve the learning process, especially in a computerlaboratory; (2) current approaches that rely only on emotionsto detect engagement have low performance. They are notsuitable for real-time systems as they use expensive toolsand do not respect student privacy.Therefore, to address such challenges, we propose a newapproach that is able to use the least expensive equipment,show high performance and operate in real time. It shouldalso rely not only on facial expressions, but also on students’ behaviors. Some studies [5–7] with representativemethods are related to the multimodal approach that bridgesthe semantic gap between different modalities and improvesaccuracy rates.Thus, in this paper, we propose a multimodal approach todetect engagement levels. This approach can use and analyzestudents’ emotions based on their facial expressions, mousemovement behaviors, and keyboard keystroke behaviors. Weutilize new levels of student engagement that were set forthin our previous work [8] together with academic emotionallinks, also called the “affective model.” The primary contributions of this paper can be summarized as follows: (1) weuse our proposed affective model to recognize engagementlevels based on students’ academic emotions; (2) we suggesta new multimodal approach to measure student engagementbased on student behavior analysis by combining the threemodalities, namely emotional facial expressions, mousemovement behaviors, and keyboard keystroke behaviors; (3)13Signal, Image and Video Processing (2021) 15:1387–1395we also test the proposed method on new realistic datasetsbased on real students’ behaviors.The remainder of this paper is structured as follows:Sect. 2 surveys the state-of-the-art on related behavior-basedsystems to recognize engagement levels. Section 3 presentsthe proposed multimodal approach to measure studentengagement based on student behavior analysis. Section 4discusses the exhaustive experimental evaluation methodwhich was applied to evaluate the efficiency and accuracyof our method. Finally, Sect. 5 summarizes the key findingsof the presented work and highlights major directions forfuture research.2 Literature reviewEngagement has been described as a fundamental protocol.People use it to monitor their perceived relationships witheach other during communication [4]. Engagement can bedetected by many distinct techniques. In this section, wefocus on a related behavior-based system to be able to recognize engagement levels.Affective computing can automatically measure engagement by using diverse techniques, such as EEG, heart rates,galvanic skin response, facial expressions, body gestures,natural language processing (NLP), keyboard keystroke, andmouse movements. Several studies used different approachesto recognize student engagement levels, with engagementrecognition accuracy rates ranging from 72.9 to 75.5%.Monkaresi et al. forward an approach to measure learnerengagement in writing tasks. Their approach dependedon facial expressions and heart rates. Both geometric andappearance features were adopted to detect facial expressions. The authors employed three different techniques toextract facial characteristics from videos and heart ratefeatures, namely Microsoft Kinect face tracker (FT), localbinary patterns from three orthogonal planes (LBP-TOP),and remote video-based HR sensing. Supervised learningwas used for the detection of concurrent and retrospectiveengagement. The area under the ROC curve (AUC) was usedto evaluate the classifier’s accuracy using leave-severalstudents-out cross-validation. As a result, their approachachieved an AUC of 0.758 for concurrent annotations andan AUC of 0.733 for retrospective self-reported annotations. The heart rate technique shows a low accuracy valueas an engagement measure. One of the limitations of theirapproach was its inability to extract features from somevideo segments due to head motion, which could cause someof that data to be lost. The authors also did not explain howthey classified the engagement levels [3].Whitehill et al. recommended an approach for automaticrecognition of student engagement from facial expressions.Three different computer vision techniques were used to
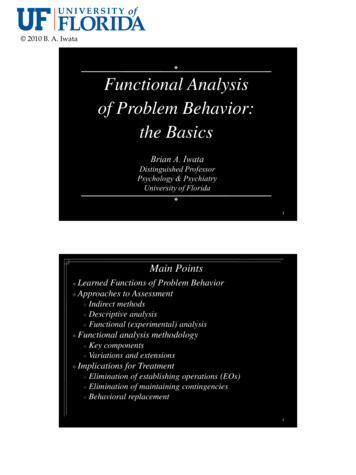
Signal, Image and Video Processing (2021) 15:1387–1395detect the engagement level of the students. Box filter features, Gabor features, and CERT features were applied independently to create machine learning models for engagementdetection. Their labels were obtained from retrospectiveannotation of videos by external annotators. Four levels ofengagement were used, ranging from strong disengagement(without even focusing on materials) to strong engagement.They were able to calculate the engagement rate (AUC 0.729; averaged across all four levels of engagement). AUCwas utilized as a classifier. Gabor features with the support vector machine (SVM) classifier proved to be the mosteffective method. In addition, they examined correlationsbetween engagement and learning performance. However,they failed to find significant correlations between perceivedengagement and learning performance because the studywas conducted in a short period of time [4].In Li et al.’s approach, facial expressions, such as eyegazes and mouse movements were used to measure userengagement in a reading task. In addition, self-reports wereused as a ground truth classification. The authors used bothwebcams and mouse movements to measure the users’ attention levels in real time. Their work included geometricbased features rather than appearance-based features. Theauthors extracted all features from these methods and thenselected the best of them. Three attention levels, namelyhigh, medium, and low were defined. Constrained localmodels (CLM) were employed for the extraction process. Asa result, their approach achieved 75.5% with the SVM classifier in a leave-one-subject-out model. As a limitation, theydid not explain how they classified the attention levels [9].You et al. handled view discrepancy, discriminability,and nonlinearity in a joint manner by proposing Multi-viewCommon Component Discriminant Analysis (MvCCDA).The suggested approach incorporates supervised informationand local geometric information into the common component extraction process. It is used to learn a discriminantcommon subspace and to discover the nonlinear structureembedded in multi-view data [5].In Guanqu et al., the problem of multi-view embeddingfrom different visual cues and modalities was considered.They proposed a unified solution for subspace learningmethods using the Rayleigh quotient, which is extensible formultiple views, supervised learning, and nonlinear embeddings. Their proposed method demonstrates the effectivenessof the proposed multi-view embedding methods on visualobject recognition and cross-modal image retrieval, andobtains superior results in both applications compared torelated methods [6].He et al. proposed that cross-modal methods can furtherreduce the semantic gap between different modalities andimprove the clustering/matching accuracy. For supervisedand unsupervised learning, they put forward a cross-modalmatching method and a multimodal subspace clustering1389method to reduce the semantic gap and learn a commonstructure for different modalities [7].An overview of previous research offers various techniques for measuring student engagement, like self-reports,observational checklists, and automated measuring methods.The first two techniques are still very primitive as they lacktemporal resolution. Besides, they require a great deal oftime and effort on the part of students and observers. Inaddition, they are not suitable for real-time systems, or arethey always clearly related to the engagement context. Manytechniques can automatically recognize learner engagementbased on the review of automatic engagement recognition.EEG machines, heart rates, blood pressure, and galvanicskin response techniques require a special sensor. They arealso expensive and are neither easily available nor usable indaily life. In recent studies, NLP and voice recognition havenot yielded satisfactory results due to cultural and linguisticdifferences [10].The previous overview showed that all approaches usedfacial expression methods to measure students’ engagement.Some researchers combined facial expression methods withother techniques, like heart rates and mouse movements.Facial expressions and heart rate signals provided highaccuracy of behavior recognition, although the equipmentis expensive. Other methods used keyboard keystrokes withmouse movements on any computer and achieved high accuracy of behavior recognition. These input devices are alsocheap and easily carried [10].Our work, then, focuses on three modalities: (1) emotionsfrom facial expressions, (2) behaviors from mouse movements, and (3) keyboard keystrokes. In addition, to overcomethe limitations of these technologies, we should select thesuitable features and use online videos for privacy issues.3 Proposed multimodal approach to detectstudent engagement levelsThe proposed multimodal approach relies on analyzingthree modalities: the emotional modality extracted fromfacial expressions, keyboard keystroke and mouse movement modalities. The engagement level depends on our newaffective model proposed in our previous work [8].In this paper, we consider only the upper part of the affective model [8] to validate our proposed approach. In fact,most facial expression recognition methods recognize onlybasic emotions. Thus, we consider basic emotions [surprise,anger, fear, happiness, disgust, sadness]. Accordingly, theupper engagement levels [strong, high, medium] are takeninto account. Figure 1 presents the conceptual architectureof the multimodal approach to recognize student engagement levels.13
1390Signal, Image and Video Processing (2021) 15:1387–1395and keystrokes. In the next subsections, we will present thetwo-part feature extraction stage: calculating the compositeengagement value [Fig. 1, stage 2 (1)], and computing mouseand keyboard feature values [Fig. 1, stage 2 (2)].3.2.1 Composite engagement value feature extractionThe first part of the feature extraction stage comprises threemain steps. In the first step, we extracted key frames fromthe facial expression frames. The second step consisted ofdetecting emotions from the key frames using the miniXception [11] model. In the third step, we calculated thecomposite engagement value. In the following paragraphs,we will examine and present these steps in detail.Step (1): Key frame detection.Fig. 1 The proposed framework of multimodal approach to recognizestudent engagement levelsThe multimodal approach starts by receiving students’behaviors (facial expression frames, mouse movementdata, keyboard keystroke data) and then producing studentengagement levels every two minutes. The system recognizes students’ engagement every two minutes because ourtasks and activities take approximately two minutes. Studentengagement levels can be recognized within a short periodof time (either longer or shorter than two minutes). The latter does not have any negative effects on our model performance. In the next section, we scrutinize the three stages.3.1 Stage 1: Data acquisitionData acquisition represents the first stage of the proposedmethod. The streaming videos and mouse/keyboard behaviorrecorders started when the student sat behind the PC to dothe lab activity as shown (Fig. 1, stage 1). Both streamingvideos and behaviors were recorded at the same time. Theinputs of this first stage were the user’s facial expressionframes and his/her mouse and keyboard behaviors, whereasthe outputs were the facial expression frames and raw keyboard and mouse data collected within two minutes leadingto the next stage.3.2 Stage 2: Feature extractionFeature extraction is the second stage of the proposed method.This stage was made up of two major parts. In the first part,we calculated a composite engagement value. In the secondpart, we computed mouse and keyboard feature values. Thesetwo parts run in parallel every two minutes. We extracted theengagement feature vector from both the facial expressionframes and the log file containing recorded mouse movements13Key frames, also called video frames, describe an entirevideo that can be removed to significantly reduce redundantinformation. Certain frames are obtained based on the keyframe extraction method [12]. The latter has two primaryobjectives. It aims to delete redundant data that will substantially reduce the amount of information to be processedand lower computational costs by diminishing the amountof data that undergoes processing [12, 13]. This step helpsto decide whether the current frame is a new key frame ornot. The first frame acquired by a webcam is taken as a keyframe. Based on this first key frame, we detected other keyframes. We needed to get the next frame and check whetherthe current frame is a key frame. This decision was based oncosine similarity as defined in Eq. 1 [14]. na i bia b i 1 Cosine Similarity (1) n 2abn 2a bi ii iwhere ai is the feature number i in feature vector a of thepreviously extracted key frame A. bi is the feature number iin feature vector b of the current frame B.Cosine similarity is a metric used to measure how similardocuments are irrespective of their size. This similarity scoreusually ranges from 1 to 1. The larger the cosine value, themore similar the two frames. The smaller the cosine value,the more different the two frames [14]. Based on our review,the recommended threshold is set between 0.9 and 1 [14]. Inthis study, the threshold similarity value (α) equals 0.998.The cosine similarity calculates the similarity between thecurrent frame B and the key frame A. If the cosine similarity value is greater than (α), the current frame will not be akey frame. Thus, the next facial expression frame should bechecked. If the cosine similarity value is smaller than (α), thecurrent frame will be a key frame. The output of this step isa key frame which moves to the following stage.
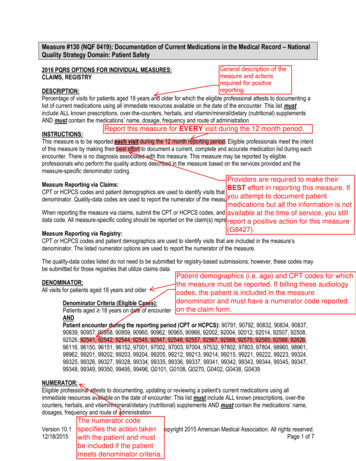
Signal, Image and Video Processing (2021) 15:1387–1395Table 1 Evaluation of single, dual, multimodal engagement leveldetectionModality nameModality Accu (%)typeFace emotionSingleMouse behaviorKeyboard behaviorFace emotion andDualmouse behaviorFace emotion and keyboard behaviorMouse behavior andkeyboard behaviorMouse and keyboard Multibehaviors with 580.950.1442.850.8595.230.04Step (2): Emotion detection.The input consists of a number of key frame facial expressions in the emotion detection step. Emotion detection models in real time should be fast and highly accurate. Therefore, depending on the previous overview [8], mini-Xception[11] is a suitable model for our work. The main purposeof this mini-Xception model [11] was to be used in realtime systems, based on the previous review of a specificconvolutional neural network (CNN) design. It is a variantof an extreme inception architecture (Xception) [15] withfew simple parameters. Mini-Xception architectures, [15],combine the use of residual modules with depthwise separable convolutions, which reduce the number of parametersby eliminating the last fully connected layers through theuse of the global average pooling layer. The mini-Xceptionarchitecture consists of a convolution followed by a batchnormalization operation and a rectified linear unit (ReLU)as the activation function. Moreover, it involves four residualdepthwise separable convolution modules, which used botha global average pooling operation and a softmax activationfunction to predict outputs.Raksarikorn et al. used a different model to detect facialexpression accuracy in the FER2013 dataset [16]. In a simple CNN model, the accuracy value is 0.629, while the number of parameters is 0.64 million. Furthermore, the numberof parameters is very large (145 million) for the VGG-Face[17] model with an accuracy of 0.712. The Xception modelhas a lot of parameters (20.87 million), with an accuracyof 0.7144. Unlike the former model, mini-Xception has asmall number of parameters (0.06 million), with an accuracy of 0.6601. Compared to the other models in terms ofthe number of parameters and accuracy, the mini-Xceptionmodel got better results. Given its low processing powerand time required, mini-Xception achieved good accuracy.Mini-Xception is a low-cost, small yet powerful model. In1391the emotion detection task, mini-Xception can only recognize basic emotions.If an emotion of the key frame is detected, it will be savedin the feature vector ekf. We will get the next frame based ontwo chief conditions: (1) the frame is not a key frame, and(2) the previous frames are finished. The output of this step isthe feature vector ekf (ekf1, ekf2, , ekfn), which leads to step 3.Step (3): Composite engagement value.Composite engagement value features are calculated inthe following manner: First, we calculated the engagementvalue of the feature vector ekf (ekf1, ekf2, , ekfn). The engagement value is thus calculated as mentioned in this work [8].Because there is no specific range for each level of engagement, the value-weighted composite should be applied tothe engagement value. Second, we computed the weightedcomposite engagement value (e1). The output of this stageis e1, which was saved in the feature vector e. The weightedcomposite engagement value (e1) was calculated based onthe following Eq. 2:) () ()(vEL3vEL2vEL1 10000 1000 1e1 123(2)where vEL1 indicates strong engagement level, vEL2 indicates high engagement level, vEL3 indicates medium engagement level.3.2.2 Mouse and keyboard feature extractionIn the second part of the feature extraction stage, the inputs arelog file, keyboard, and mouse information. We used the logfile to calculate mouse and keyboard feature values. If the logfile is empty, the value of the features will be set to zero. If thelog file is not empty, four different features will be extracted,namely the number of mouse clicks, mouse speed, the numberof keystrokes, and typing speed.Mouse movements and keyboard keystroke features are calculated in the following way: we took raw keyboard and mousedata. Then, the click number (e2) was calculated using Eq. (3).e2 n Actioni pressed or released(3)i 1This equation finds the total number of all Actions i that arepressed or released from i 1 to n (n stands for the last line ofthe log file). We calculated the speed of the mouse (e3) usingEq. (4). It was calculated by dividing the distance of pixelsby time.e3 distance(pixels)time(4)13
1392Signal, Image and Video Processing (2021) 15:1387–1395The number of keystrokes (e4) was calculated using Eq. (5).This equation finds the total number of all A ctionsi that belongto (a key action) as an example (K, 3, Z).e4 n Actioni Key(5)i 1Finally, the typing speed (e5) was calculated using Eq. (6)[18]. It was calculated by converting the number of keystrokesto the number of words. It was then divided by 5 to calculatethe average word length in characters including spaces, numbers, and other printable characters [18]. Then, misNum (mistake key number) was subtracted. Finally, the typing speed wasdivided by time. The outputs of this sub-stage are the featurevalues e2, e3, e4, e5, which were saved in the feature vector e.(( ))e4 misNum5(6)e5 time3.3 Stage 3: engagement recognitionThe input to the engagement recognition stage is a featurevector that occurs every 2 min (e1, e2, e3, e4, e5). This stagegenerates the students’ engagement levels, such as strong,high, or medium engagements using the feature vector (e1,e2, e3, e4, e5) as an input to the Naive Bayes (NB) classifiertrained in offline work.4 Experimental evaluationIn this section, we represent the datasets and validation conditions and present a discussion of the experimental resultsin order to evaluate all the techniques used and the contributions of this paper.4.1 Datasets and validation conditionsIn this study, we used facial expression recognition(FER2013) and real-world affective faces (RAF) publicdatasets in order to train the mini-Xception model [11]. Thelatter recognized emotions from facial expressions. TheRAF dataset contains 12,271 real-world images, whereasthe FER2013 dataset includes 35,887 images. Each picturebelongs to one of these classes: “anger”, “disgust”, “fear”,“happiness”, “sadness”, or “surprise.”In addition, we built four student engagement datasets (1,2, 3, and 4) by conducting many meetings with students overfour months. We gathered our datasets through performancetasks/sessions in university computer labs. These tasks wereperformed on a computer desktop in a computer lab at KingAbdul-Aziz University (KAU). Each video was recordedby the webcam of a desktop computer in each session. In13addition, the volunteers sat in front of the computer to performthe task directly. We built a data collection program that collects mouse movement/keyboard keystroke features. We usedthe key frame algorithm for all videos. The volunteers werestudents in electrical engineering or computer science fieldsat KAU. Their ages ranged between 19 and 23. We recorded164 videos from 110 volunteers during their task performance(facial expressions, mouse, and keyboard information). Allfour datasets include these engagement levels together withbasic emotions. Moreover, we collected mouse movementsand keyboard keystrokes only for datasets 2, 3, and 4. Thesefeatures were selected depending on both the review of affective mouse/keyboard features and our lab activities. Thus,we had five features in datasets 2, 3, and 4 (the number ofclicks, mouse speed, number of keys, typing speed, compositeengagement values). Dataset 1 had only one feature (composite engagement values). The emotions of each volunteer weremonitored by observing facial expressions. Each emotion wasalso recorded during the observation period. We collected aself-report from each volunteer at the end of the session todetermine his/her feelings and engagement.Engagement was labeled in all four datasets by observations, self-reports for each student, and the affective model ofthis study [8]. In observations, the emotions of each volunteerwere monitored by observing facial expressions. Each emotion that appeared was recorded with the time of observation.In addition, the engagement level was reported in the wholesession. Sometimes, we could not decide the exact engagement level during observation. In those cases, we returned tothe affective model [8] and decided the suitable engagementlevel. In addition, we used a self-report for each volunteer atthe end of the session in order to determine his/her feelingsand engagement. At the end of the session, we asked eachvolunteer to watch the recorded video. Then, they selectedtheir feelings and engagement levels from emotion andengagement tables in self-report forms. Finally, they wrotethe exact time when their feelings appeared in the video.To assess our multimodal approach for engagement levelrecognition, we applied well-known engagement recognitionevaluation metrics: accuracy and MSE. In the next sub-sections, we will present the results of two main experiments: inthe first experiment, we validated the techniques used in theproposed approach. In the second experiment, we evaluatedand validated our contributions. In the proposed method, wecombined two datasets (2 and 3, called the KM dataset) as atraining set and used the fourth dataset for testing. In the following sub-sections, all results are presented and discussed.4.2 Experimental results and discussionIn this section, several experiments are presented not only toexamine the research choices of the techniques used in theproposed method, but also to evaluate the suggested method.
Signal, Image and Video Processing (2021) 15:1387–13951393Table 2 Comparison between the engagement level of our proposed model and the state-of-the-art methodsWorkModality[4]Emotions from facial expres- SVMsions (one)[9]Emotions from facial expres- SVMsions, eye gazes, and mousebehaviors (three)Our mul- Emotions from facialtimodal expressions, mouse, andkeyboard behaviors(three)Classifier Engagement levelNaiveBayesTasksDataset descriptionVery engaged, engagedin the task, nominallyengaged, not engagedat allSet gameHigh, medium, or lowattentionReading task34 volunteers72.9Each volunteer sat in a privateroomone session6 volunte
Student behavior analysis to measure engagement levels in online learning environments . learning systems (adaptation and motivation), so there is a need to develop an accurate automated system in order to improve the