Transcription
Guidelines for statistical methods for JVIRFormatting and style of reporting statistical methods and resultsoJVIR recommends preparing statistical methods and results sections of themanuscript in accordance with ICMJE (International Committee on MedicalJournal Editors) and SAMPL (Statistical Analysis and Methods in the PublishedLiterature) guidelines. The authors are strongly recommended to review these twobrief documents and assure abiding by the guidelines prior to submission of themanuscript. The links to both documents are provided below:ICMJE .html#dSAMPL he numbers in the manuscript should be checked for integrity by the authors priorsubmission of the manuscript: Total percentages should add up to 100%. At-risk numbers should match with the presented Kaplan-Meier graph. Reporting of summarization data should be consistent throughout themanuscript (Choose either mean SD or median (range) or any othersummarization method and keep it consistent throughout the manuscript).Any deviation from the chosen method needs to be justified.Manuscripts with data integrity issues will be returned to the authors for additionalreview and correction prior to further review by the journal.Data Quality AssessmentWe strongly encourage the authors to provide a statement of data integrity assessment in the“Statistical methods” section, as appropriate.If the manuscript involves any kind of statistical data analysis, integrity of study data should beevaluated by the authors prior to analysis to assure appropriate validity of collected data. To thatPage 1 of 6
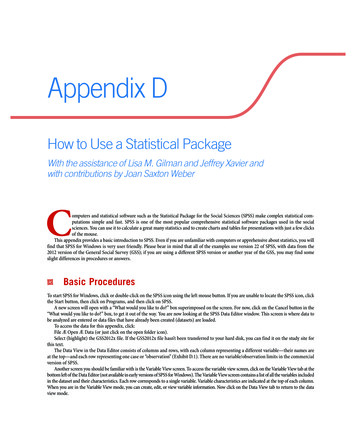
end, we recommend the authors report the following in their methods and results sections asappropriate: General “Methods and materials” section:o Method of data collection (e.g. copying from printed sheets or otherresources such as electronic medical records (EMR), data entry softwareapplications such as RedCap, automated query from EMR, etc.)o Data collection Software application (Microsoft Excel, Microsoft Access,etc.).o Data entry quality assurance (e.g. double checking the entered data by asecond observer, etc.)Statistical methods section:o Data integrity assessment methods prior to analysis (e.g. tabulating orvisually exploring range and outliers for numerical and tabulation forcategorical variables; bivariate cross-tabulation to assess reasonableintegrity of related variables).o Treatment of missing values (e.g. missing value imputation, etc.) ifapplied.o Mitigation methods of detected inconsistencies (e.g. negative survivaltime, or unusually large or small values, etc.)Results section to reflect:o Number of missing values for each reported variable.o Number of subjects included in each analysis (e.g. each regressionmodel).Choice of Statistical Tests; Assumption Checks and Other Considerations---Compatibility of tests with summarization:o The applied statistical tests should be compatible with the data summarizationmethod: e.g. Student’s t-test, ANOVA for mean (SD), Mann-Whitney U test,Kruskal-Wallis test for median (range).Comparative studies:o For comparative analysis, please review the comparative study data flow chart atthe end of this guideline for a general hint on the appropriate tests andconsiderations that would fit your data best before submitting your manuscript toJVIR.Regression analysis:o Considerations for multivariable models: Independence of the covariates: two-by-two associations betweenvariables entered in the model be checked using a separate regression orcorrelation analysis model. In case of significant interaction between thevariables, their interaction term added to the model. Results of univariate models need to be reported either in the same tableor in a separate table before multivariable results for comparison.o Reporting of regression results: Units of measurements for numerical variables as well as the referencecategory for the categorical variables need to be reported in the regressiontable.Page 2 of 6
----Each regression table should be readable independently from the bodytext. The title of the regression table should implicate the outcome variable.Survival analysis:o Univariate comparison of the survival functions (e.g. comparing the Kaplan-Meiersurvival graphs with the Log-rank test) between the main study groups isrecommended prior to multivariable modeling.o Considerations for survival regression (Cox) modeling: Important assumption #1: proportionality of hazard is one of the mainassumptions of the Cox regression models, hence the name proportionalhazard model. This assumption should be tested whenever a Cox modelingmethod is used. Statistical (Schoenfeld’s residual test) or graphical (logminus-log plot) method or both can be used for this evaluation. Hazardproportionality for each covariate needs to be assessed in a univariatesetting, and if statistically / visually significant time interaction is found, thevariable needs to be considered as the “time-varying variable” in allsubsequent models. Important assumption #2: Like regression analysis, independence of thecovariates needs to be checked in separate regression or correlationanalysis models, and if significant interaction is found, addition of theinteraction term to the multivariable model needs to be considered. Think about any events that may ‘compete’ with your event of interest (e.g.post-ablation liver transplantation competing with death). These events arecalled “competing risk events” and require consideration in the analysisusing “Competing risk Cox models”. Please consult with your statistician ifthere is possibility of such events in the study.Selection bias:o Confounding effect from the selection bias cannot be resolved simply withmultivariable adjustment. Therefore, it is strongly recommended to use anappropriate matching method (such as propensity score matching, propensityscore weighting, etc.) if such a confounding effect is detected.o When using propensity score, post-matching / weighting balance of the appliedcovariates should be reported using an appropriate method such as StandardizedMean Difference (SMD). Any unbalanced variables after matching or weighting,needs to be added to the final analysis for a multivariable model.Multiple comparisons:o Exploratory studies (such as –Omics data analysis) are exposed to the incidentalsignificant association finding depending on the number of the variables that theyevaluate. P value significance level adjustment using an appropriate method suchas False Discovery Rate (FDR) is needed for such studies. The results can besummarized in a Smile plot.Large sample size:o Although large sample size (usually over 1000 cases) are valuable source ofresearch, there are issues with them as well. One of the most important issueswith such studies is shrinkage of the type one error. In practical sense, it meansthat small associations can become statistically significant merely due to the largesize of the study population. This issue is commonly seen in studies usingPage 3 of 6
--insurance or other national registry data. In such studies, the ‘effect sizes’ of thestudied associations should be calculated and reported beside the P values.Meta-analysis:o There is a debate of using random-effect versus fixed-effect models in metaanalysis studies. Random-effect models assume that the effect size varies amongstudies and meta-analysis tries to calculate the average effect size. In contrast,fixed-effect models assume an identical effect size and sampling error being theonly reason for variation between studies hence largely ignoring effect size fromthe smaller studies. Since it is very unlikely that such condition will be true in areal-world scenario, it is highly recommended that random-effect models beapplied in all meta-analyses unless the authors have a robust evidence of a fixedeffect.Novel measurement:o When presenting a novel measurement (e.g. a radiographic index, etc.) in a studythat demonstrates a significant association with an outcome (e.g. post-treatmenttumor progression), the validity of the measurement should also be demonstrated.It is recommended that the measurement is repeated blindly by two or moreobservers and the reliability indices such as Inter-rater reliability, intraclasscorrelation coefficient (ICC), inter-observer agreement or standard error ofmeasurement (SEM) be calculated and reported.Page 4 of 6
Page 5 of 6
Further readings:1. Lantz B. The large sample size fallacy. Scand J Caring Sci. 2013 Jun;27(2):487-92.2. A B Haidich. Meta-analysis in medical research. Hippokratia. 2010 Dec;14(Suppl 1):2937.3. Margarita Stolarova, Corinna Wolf, Tanja Rinker, Aenne Brielmann. How to assess andcompare inter-rater reliability, agreement and correlation of ratings: an exemplary analysisof mother-father and parent-teacher expressive vocabulary rating pairs. Front Psychol.2014 Jun 4;5:509.4. Fixed-Effect Versus Random-Effects Models. In: Introduction to Meta-Analysis. MichaelBorenstein M, Hedges LV, Higgins JPT and Rothstein HR. 2009 John Wiley & Sons, Ltd.5. Newson R. Multiple-test procedures and smile plots. The Stata Journal. 2003; 3(2):109132.6. Imbens/Wooldridge. Estimation of Average Treatment Effects Under Unconfoundedness.Lecture Notes 1, Summer ’07. https://www.nber.org/WNE/lect 1 match fig.pdfAccessed: 9/11/2020.Page 6 of 6
method: e.g. Student's t-test, ANOVA for mean (SD), Mann-Whitney U test, Kruskal-Wallis test for median (range). - Comparative studies: o For comparative analysis, please review the comparative study data flow chart at the end of this guideline for a general hint on the appropriate tests and