Transcription
Swing TradINGCHAPTER 3. FUNDAMENTALS & TECHNICALS –WHAT YOU NEED TO KNOW!
Fundamentals & TechnicalsOne is not more right than the other, but they both DO matter whenswing trading, and can even matter when day trading (think oilreversals)Fundamental vs Technical analysis- Fundamental Analysis: A method for evaluating securities byattempting to measure intrinsic value using qualitative andquantitative metrics. Fundamental analysis includes everythingthat affects the security including micro and macro economicfactors. One of the most successful fundamentalists of all time isWarren Buffett.- Common fundamental metrics include: debt-equity ratio,balance sheets, book value, free cash flow, P/E (price toearnings) and P/B (price to book) ratios, valuations, PEG(price/earnings to growth) ratio, etc. Download the PDF for moreinformation on these. Generally, we aren’t super concerned withthese for short term swing trades.
Fundamentals & TechnicalsTechnical Analysis: A method for evaluating securities by utilizingstatistical analysis of market activity from past behavior, priceaction and volume. Technical analysis does not focus on intrinsicor fundamental metrics, but instead uses charts, tools and otherindicators to identify patterns that can help suggest futurebehavior.Common technical analysis terms and tools: moving averages,charting, candles, price action, volume, indicators, historicaltrends, volatility, etc. It is EASY to get carried away with ‘chart art’and fall into analysis paralysis. My thoughts on this .KISS. Keep ItSimple Stupid. Stay away from the exotic stuff and focus on whatthe bulk of the traders are looking at.
Fundamentals & TechnicalsHow do I find trades that capitalize on both fundamentals & technicals?Scanners of course! I use Trade Ideas Pro and TC2000 algorithms to scanthe market for stocks meeting certain technical and fundamentalrequirements. It saves a TON of time and is highly efficient. I also useOptionHacker.com for options ideas based on large sweeps.We are able to back test our results, screen ideas quickly and adjust oureyes in the market to reflect changing market conditions.
Fundamentals & TechnicalsMy Trade Ideas swing scanner looks for 10 types of trades- Stocks that are breaking through moving averages on high relativevolume (technical; bullish & bearish)- Stocks that are in an accumulation phase below a major breakout level(technical; bullish)- Stocks that have had recent fundamental news and are technicallysetup for continuation (technical & fundamental; bullish)- Stocks that are experiencing extreme buying/selling pressure at keyareas. (bullish & bearish)- Reversal setups from stocks that have put in majorly over extended runsand are overbought or oversold (bullish & bearish)With tens of thousands of stocks trading, it’s impossible to monitor themall at one time. It just isn’t efficient. Let technology do the heavy lifting.Time is MONEY!
Fundamentals & TechnicalsMy primary technical indicators for swing trading are: 20 EMA, 50 EMA, 200 EMA, ATR & VolumeI always use a daily chart for my swing trade analysis, looking back at least two yearsThere is no reason to clutter up a chart with fancy indicators if you already know what you arelooking for. Patterns repeat, look for those, not the indicators.I will also use TAS Market Map and TAS Boxes Indicators on my daily chart (more on those later)Occasionally, I will draw trend lines. Trend lines are drawn by connecting two lows/highs in theline. This depends on the direction of the trade/trend you are looking at. There are different waysto draw trend lines, and no one way is absolute. This can make them unreliableWhen using trend lines, waitfor a break or close above orbelow the trend line to signalan entry or an exit.
Fundamentals & TechnicalsExponential Moving Average vs. Simple Moving AverageUsed for smoothing out price action data. For swing trading, this givesus a more conservative number to work with in most cases.Measures the past XX time period (20, 50, 200) to calculate an averageprice. Why do I use these time periods? Everyone’s doing it! And thatmatters!SMA gives equal weight to each price in the time period.EMA gives more weight to more recent prices in the time period.Average True Range (ATR) – The ATR is the 14 day average of the trueranges in price each day. Think of it as the average tick range of astock over 14 days.
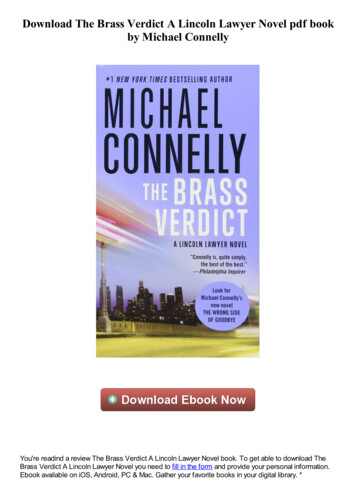
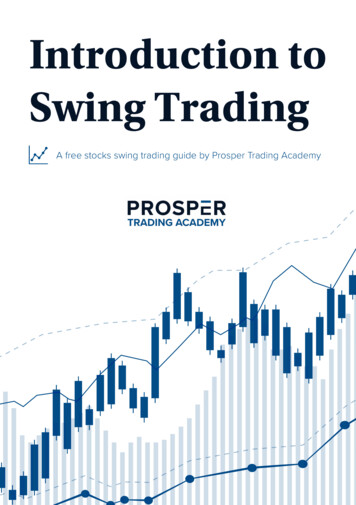
Fundamentals & TechnicalsHow to use moving averages The general rule of thumb says, stocks trading above theMAs are in an uptrend, and stocks trading below the MAs are in a down trend. Thecrossover areas are possibly entry/exit locations.Notice the accelerated sell off around the MAs. Notice the consolidation taking placeunder the MAs. Notice the tap on the 20 EMA before breaking through.Why do we respect theMAs for entry/exit? This is why
Fundamentals & TechnicalsWho has heard, “the trend is your friend” it really is, until it isn’tOnce we are in a trending trade, how do we know when to get out?Exit indicators?- There are several ways to accomplish this- Just like in day trading, we can use new daily candle lows as a bearishreversal indicator, a change in the buying and selling has occurred- Channel or trend line breaks- TAS indicators or other charting tools- Violations of key technical levels, dojis and upcoming earnings releasesor conference calls! We NEVER hold through earnings or newsannouncements!- Always pay attention to the economic calendar (I use Benzinga Pro) forupcoming data that can impact your trade (inventories, unemploymentnumbers, Fed minutes, GDP, etc.)
Fundamentals & TechnicalsVolume and chart reading work the SAME WAY for swing trading as theydo day trading.A combination of both charts (intraday and daily) helps find our entryspotEverything is connected. Day traders need swing traders and viceversa. The patterns between the two are largely the same, it is theexecution, exposure and time frames that are different. As a result, riskhas to be managed differently as well. Size will change, etc.Knowing basic chart setups will help you understand why pricebehaves the way it does at certain levels at times, and what to expectat future tests of those levels. Charting is FULL of historical data USE IT!If you have not done so already, I HIGHLY recommend every traderread Steve Nison’s book, “The Candlestick Course.” This will greatlyreduce your learning curve.
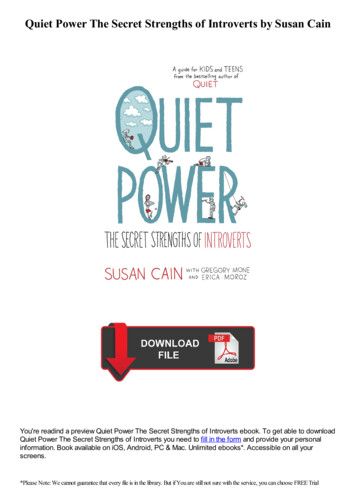
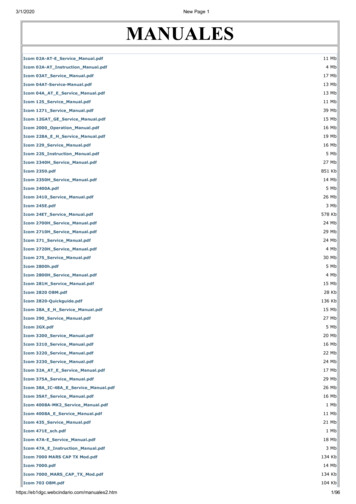
Candle Sticks - ReVIEWWhat does each Candle StickTell usOpen PriceClose PriceHigh of the time periodLow of the time periodThe shape of candle can alsogive us information about themarket sentiment. Bulls vsBears is an ongoing struggle.
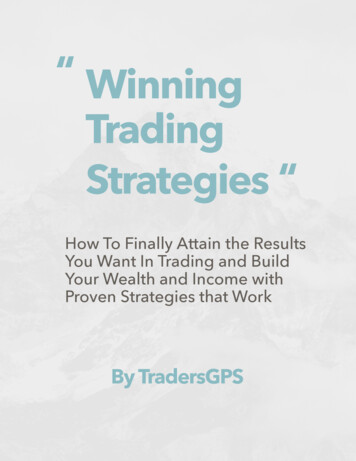
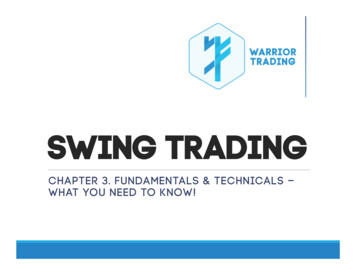
Fundamentals & TechnicalsBasic chart patterns – repeated over and over! This is what we want to see!The stock market is madeup of patterns. Learn thepatterns and beat the market
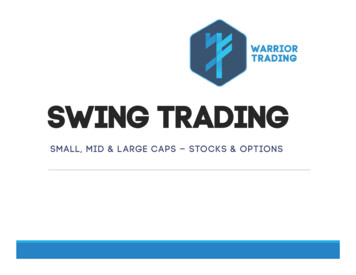
Fundamentals & TechnicalsNegotiating entries and exits – look for high relative volume breaks of key levelsHigh volume can signal an entry, declining volume can signal a sell opportunityNews can move a stock quickly, evaluating the news is critical in deciding whether toenter/exit a tradeLevel 2 is not as important for swing trading as it is day trading, however, we can still use itto help us determine our entries/exits intradayJust like we look at intraday charts to find support and resistance, we can get betterentries and could possibly save some if we just plan ahead.We know ahead of time that breakout areas, moving averages and 52w highs/lowsare going to be areas of support and resistance. It is where prices have failed tomove through in the past. We use history to guide the present/future.
Fundamentals & TechnicalsNote the major S/R levels – Buy above/short below? This is why wewe wait for setups to trigger. Technicals are often fueled by fundamentals.
TAS Indicators w/ eSignalFor swing trading I use TAS boxes and Market Map the most.
TAS Indicators w/ eSignalTAS Indicators are used by a ton of institutional traders, they help us understandwhat “big money” is looking at, and can often give us an edge.TAS Market Maps show us theareas of contention and thesqueeze zones. Why is this important?Buyers vs. Sellers and volume!TAS Boxes show us the major supportand resistance levels. Why is this important?breakouts and breakdowns occur at theselevels.
TAS Indicators – Market Map
TAS Indicators - Boxes
TAS Indicators- Market Map
TAS Indicators – Boxes
Fundamentals & TechnicalsOrder types that I use, and when- OCO (conditional; One Cancels the Other): A pair of orders where if one isexecuted/triggered, the other is automatically cancelled. (limit order/stoporder to sell)- Trailing Stop: Stop that follows the price up using % or change, protectsgains by allowing the trade to continue to move up, and by trailing up thestop proportionately. Useful for trades deep in the profit zone or poised tomake another move up. Can be tough to use on wide moving stocks with abig ATR. Ideal for traders who can’t monitor positions intraday.- Limit: An order to buy/sell at a specific price or BETTER- Stop: An order to sell a security when it reaches a certain price- Stop limit/buy stop: A combination stop order and limit order, where abuy/sell order is triggered at a certain price, but capped at a different price(limit) This gives the investor precise control over entry and exits, however,can result in lower quality fills and in the case of stops, no fills at all when bigmarket orders go through. This type works best with very liquid stocks.
Fundamentals & TechnicalsThe basics on SEC filings (fundamentals):Form 4*- Insider buying or selling- Tells us if insiders are bullish or bearish on their companyForm 8-K*-Report of unscheduled material events (things that will impact the stock price)Changes in controlling ownership, bankruptcy, M&A, and any materially important eventsSchedule 13D-Reveals who owns the most shares in the companyFiled within 10 days of any new 5% stakeholderExplains more about the people behind purchase of controlling shares10-K Report (annual financials)-Similar to a prospectus, contains detailed financial analysis for a company.Provides financial outlook/guidanceProvides cash flow, balance sheet, debtsAlso discloses any legal proceedings/lawsuits that may affect valuation*Represents most important of the filings There are a TON of forms and reports that get filed, but these are the most common we see and act on.
Fundamentals & TechnicalsQuestions, comments, concerns?Email me: jeff@warriortrading.com
Volume and chart reading work the SAME WAY for swing trading as they do day trading. A combination of both charts (intraday and daily) helps find our entry spot Everything is connected. Day traders need swing traders and vice versa. The patterns between the two are largely the same, it is th