Transcription
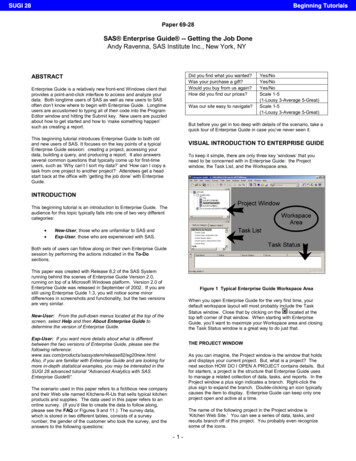
SUGI 28Beginning TutorialsPaper 69-28SAS Enterprise Guide -- Getting the Job DoneAndy Ravenna, SAS Institute Inc., New York, NYDid you find what you wanted?Was your purchase a gift?Would you buy from us again?How did you find our prices?ABSTRACTEnterprise Guide is a relatively new front-end Windows client thatprovides a point-and-click interface to access and analyze yourdata. Both longtime users of SAS as well as new users to SASoften don’t know where to begin with Enterprise Guide. Longtimeusers are accustomed to typing all of their code into the ProgramEditor window and hitting the Submit key. New users are puzzledabout how to get started and how to ‘make something happen’such as creating a report.Was our site easy to navigate?Yes/NoYes/NoYes/NoScale 1-5(1-Lousy 3-Average 5-Great)Scale 1-5(1-Lousy 3-Average 5-Great)But before you get in too deep with details of the scenario, take aquick tour of Enterprise Guide in case you’ve never seen it.This beginning tutorial introduces Enterprise Guide to both oldand new users of SAS. It focuses on the key points of a typicalEnterprise Guide session: creating a project, accessing yourdata, building a query, and producing a report. It also answersseveral common questions that typically come up for first-timeusers, such as ‘Why can’t I sort my data?’ and ‘How can I copy atask from one project to another project?’ Attendees get a headstart back at the office with ‘getting the job done’ with EnterpriseGuide.VISUAL INTRODUCTION TO ENTERPRISE GUIDETo keep it simple, there are only three key ‘windows’ that youneed to be concerned with in Enterprise Guide: the Projectwindow, the Task List, and the Workspace area.INTRODUCTIONThis beginning tutorial is an introduction to Enterprise Guide. Theaudience for this topic typically falls into one of two very differentcategories: New-User, those who are unfamiliar to SAS andExp-User, those who are experienced with SAS.Both sets of users can follow along on their own Enterprise Guidesession by performing the actions indicated in the To-Dosections.This paper was created with Release 8.2 of the SAS Systemrunning behind the scenes of Enterprise Guide Version 2.0,running on top of a Microsoft Windows platform. Version 2.0 ofEnterprise Guide was released in September of 2002. If you arestill using Enterprise Guide 1.3, you will notice some minordifferences in screenshots and functionality, but the two versionsare very similar.Figure 1 Typical Enterprise Guide Workspace AreaWhen you open Enterprise Guide for the very first time, yourdefault workspace layout will most probably include the Tasklocated at theStatus window. Close that by clicking on thetop left corner of that window. When starting with EnterpriseGuide, you’ll want to maximize your Workspace area and closingthe Task Status window is a great way to do just that.New-User: From the pull-down menus located at the top of thescreen, select Help and then About Enterprise Guide todetermine the version of Enterprise Guide.Exp-User: If you want more details about what is differentbetween the two versions of Enterprise Guide, please see thefollowing /eg20new.html.Also, if you are familiar with Enterprise Guide and are looking formore in-depth statistical examples, you may be interested in theSUGI 28 advanced tutorial “Advanced Analytics with SASEnterprise Guide ”.THE PROJECT WINDOWAs you can imagine, the Project window is the window that holdsand displays your current project. But, what is a project? Thenext section HOW DO I OPEN A PROJECT contains details. Butfor starters, a project is the structure that Enterprise Guide usesto manage a related collection of data, tasks, and reports. In theProject window a plus sign indicates a branch. Right-click theplus sign to expand the branch. Double-clicking an icon typicallycauses the item to display. Enterprise Guide can keep only oneproject open and active at a time.The scenario used in this paper refers to a fictitious new companyand their Web site named Kitchens-R-Us that sells typical kitchenproducts and supplies. The data used in this paper refers to anonline survey. (If you’d like to create the data to follow along,please see the FAQ or Figures 9 and 11.) The survey data,which is stored in two different tables, consists of a surveynumber, the gender of the customer who took the survey, and theanswers to the following questions:The name of the following project in the Project window is‘Kitchen Web Site.’ You can see a series of data, tasks, andresults branch off of this project. You probably even recognizesome of the icons.-1-
SUGI 28Beginning TutorialsExp-User: The Tasks by Name tab also contains the SASprocedure associated with that task. If you know which ‘proc’ youwant, it is easy to find the Enterprise Guide task name from thistab. Also if you prefer, tasks are available to you through thepull-down menus at the top of the screen.THE WORKSPACE AREAThe Workspace area serves several purposes, but in general itallows you to display your results. For example, if you run a ListData task on a data source, the detailed report would show up inthis area. Or if you want to investigate the values of a SAS datatable that you just created, double-click on the table name insidethe Project window and the table appears in a data grid inside ofthe Workspace area.Figure 2 Typical Project WindowNew-User: The icon that looks like a table with a dot is a SASData Table. The icon that looks like an x is an Excelspreadsheet.THE TASK LISTAfter you have opened a project and added some data, you willwant to create some reports. The Task List allows you to selectthe task that you wish to run on the data. There are many tasksavailable to you in Enterprise Guide. Some are simple and someare more complex. For example, if you wanted to get a simple,detailed listing of some data in your project, you would select theList Data task.In order to find the List Data task in the Task List, you have twochoices. From the Tasks by Category tab, you will find itunderneath the Descriptive grouping. From the Tasks by Nametab, you will find it listed in alphabetical order.Figure 5 Typical Workspace AreaExp-User: The entire Enterprise Guide window is considered tobe the Workspace area. Items discussed so far, such as theProject window, the Task List, and the Task Status window areconsidered to be in the Workspace area. Because you canremove the toolbars at the top of the Enterprise Guide window,they also fall into that same category.HOW DO I OPEN A PROJECT?Now that you’ve had a brief tour of Enterprise Guide, you areready to ‘make something happen.’ Not so fast! It turns out thatyou cannot do anything in Enterprise Guide until you either openan existing project or create a new project.Figure 3 Tasks by Category TabExp-User: For those of you who have been coding in SAS forquite some time, you may be annoyed. The project concept isnot only something new, but it is also required. The projectstructure is not used if you are running SAS in any of thetraditional ways such as interactive Display Manager mode orbatch mode. However, that is not the case with EnterpriseGuide, and you cannot move on to the next step until you have aproject.Think of your project as your kitchen. This is the place where youbring together all the ingredients, perhaps combine them in amixing bowl, place it in the oven, and create something delicious.If you do not have a kitchen, you will not be able to cookanything!Figure 4 Tasks by Name Tab2
SUGI 28Beginning TutorialsFortunately, creating a new project or even opening up anexisting project could not be easier in Enterprise Guide. Unlessyou have turned the Welcome to Enterprise Guide! window off, itappears each time you invoke Enterprise Guide.HOW DO I GET TO MY DATA?At this point, you’ve opened up the kitchen, but the cabinets areall empty and you need to do some shopping. The currentproject is available, but it is completely empty. In order to moveto the next step and ‘make something happen,’ some data needsto be added to the project.New-User: Begin by thinking about what are a couple of yourfavorite data sources. Enterprise Guide allows you to add SASdata sets and Microsoft Excel spreadsheets that are storedlocally on your computer to your current project. By the way, aSAS table is simply another name for a SAS data set. You mighteven hear someone use the expression SAS data table. Theterms all refer to the same thing.Exp-User: Enterprise Guide allows you to access several datasources provided that those tables contain data in a table format(rows and columns). Here are several popular examples: Figure 6 Welcome WindowNew-User: It is possible that the Welcome window might lookslightly different if somebody else has invoked Enterprise Guideon your machine before you. SAS data sets (local or remote)Microsoft Excel spreadsheets, Microsoft Access tables,and Lotus spreadsheets (local)Text and HTML files (local)ODBC-compliant data (local)DB2, Oracle, and SYBASE database files (local andremote; additional SAS database engine licenserequired)MDDBs (local and remote; additional SAS softwaremay be required)Exp-User: Enterprise Guide uses the Microsoft Jet databaseengine to access data sources for which there is a DAO (DataAccess Objects) interface.To-Do:After starting up Enterprise Guide, select the CreateNew Project button. A new project, named Project, iscreated for you.INSERTING A SAS TABLEThis is a terribly uncreative project name, so renamethe project by right-clicking on Project in the Projectwindow and selecting Save Project As It is time to add a SAS table to your Kitchen Web Site project.The SAS table that you are going to add has been created and isstored on your local computer. (Please see the FAQ or Figure 9if you need to create the table.) The name of the table that youare going to add to your project is SurveyAnswers, and it islocated in the C:\SUGI28\EG2\Data subdirectory. TheSurveyAnswers data table contains the results of a total of 10surveys. If you do not remember the questions that made up thesurvey, review the INTRODUCTION to this paper.Navigate in the dialog box to the subdirectoryC:\SUGI28\EG2\Projects (you might have to create thesubdirectory if it does not already exist) and then typeKitchen Web Site into the File name box:New-User: SAS data sets have the extension ‘sas7bdat’, so thefile that you are looking for is named SurveyAnswers.sas7bdat.Also, SAS data set names are case insensitive, soSurveyAnswers and surveyanswers are both considered thesame table.Figure 7 File Name BoxFinally, select the Save button to save the projectunder your new name and location.To-Do:Select the Insert Data button,of the toolbar.New-User: If someone has given you a project or you havecreated a project in a previous session, you can find it byselecting the Browse for Project button., near the right endWhen the Insert Data dialog box appears, select theExisting tab if it is not already selected.Exp-User: Recent projects appear automatically in the Welcometo Enterprise Guide! window, making it easy to access the mostrecent projects you have been working on. Of course, this listdoes not appear if you have never saved any projects on yourcomputer.Verify that the Files of type: box has eitherAll Files (*.*) selected orSAS Data Files (*.sas7bdat; *.sd7; *.sd2) selected.3
SUGI 28Beginning Tutorialsahead, add one more item to the inventory to keep thingsinteresting.Navigate in the Insert Data dialog box until you haveselected the file surveyanswers.sas7bdat located inthe C:\SUGI28\EG2\Data subdirectory.INSERTING AN EXCEL SPREADSHEETSelect the OK button.The other existing data source that you are going to add to theproject is the SurveyNumbers Microsoft Excel spreadsheet.This table contains only two columns. One column specifies thesurvey number. The other column reveals the gender of theperson who took the survey. For now, add the spreadsheet to theproject. In the following section use this new SurveyNumberstable to determine what percentage of the survey takers weremale and what percentage were female. At the end of the tutorial,you will combine this table with the SurveyAnswers table toanalyze the results characterized by gender. But add the tablefirst.New-User: Microsoft Excel files have an extension of ‘xls’, so thefile that you are looking for is named SurveyNumbers.xls. Also,typically an Excel file is a Workbook that contains worksheets. Itis not uncommon for a simple Workbook to contain only oneworksheet. When this occurs, you may be surprised to see twoworksheets appear in the pop-up dialog box. One of theworksheet names is plain and the other contains the ‘ ’ characterattached to the end of the name. Always select the name withthe ‘ ’ character to get the entire worksheet, unless you know forcertain that you want just a range. You see this in the followingexample.Figure 8 Insert Data Dialog Box – SAS TableExp-User: You can also add data to your project by selectingInsert and then Data from the pull-down menus.To-Do:New-User: It is a good practice to save your project on a regularbasis. Select File and then Save Kitchen Web Site from thepull-down menu.Select the Insert Data button,of the toolbar.By default, when you add a data source to your project, it opensin a data grid automatically. This is what your table looks like.When the Insert Data dialog box appears, select theExisting tab if it is not already selected., near the right endVerify that the Files of type: box has eitherAll Files (*.*) selected orMicrosoft Excel Files (*.xls) selected.Navigate in the Insert Data dialog box until you haveselected the file SurveyNumbers.xls located in theC:\SUGI28\EG2\Data subdirectory.Select the OK button.Select the SURVEYNUMBERS worksheet.Figure 9 SurveyAnswers Data TableSelect the OK button.Not very interesting is it? Well, you have some things to dobefore you make something more meaningful out of your data inEnterprise Guide.But first, congratulations! Your kitchen is stocked with oneingredient. One thing you should know about what is going onbehind the scenes is that Enterprise Guide did not make a copyof the table in your project folder. In fact, what happened whenyou added that table to your project was that Enterprise Guidesimply added a pointer to that table in your project. You probablyknow that most of the icons on your computer desktop are reallypointers to the actual files located somewhere else on your harddrive. When you add a table to your project, Enterprise Guidejust creates a pointer to that data source wherever it is stored onyour hard drive. In fact, you can delete that data table from yourproject and it will not delete the table from your hard drive.On the one hand, you are very pleased that you have managed toadd one item to your project. On the other hand, this would leadto a very bland meal. So before you really start cooking, goFigure 10 Insert Data Dialog Box – Excel File4
SUGI 28Beginning TutorialsSurveyNumbers(SURVEYNUMBERS ) table is the active datasource before the task is selected.As discussed a little earlier, when you add a data source to yourproject, it opens in a data grid automatically. This is what thenew table looks like.To-Do:Select the SurveyNumbers(SURVEYNUMBERS )table by clicking on its icon inside of your Projectwindow. It is now the active data source.Select the Tasks by Category tab in the Task Listwindow. Use the scroll bar to move down and find theDescriptive category.Underneath this category, double-click the One-WayFrequencies task. This opens the One-WayFrequencies dialog box.Figure 11 SurveyNumbers Excel FileYou’ll notice that once in Enterprise Guide, the Excel file lookspretty much like a SAS data set and vice-versa. In fact, on thesurface, all the data sources you pull into your project are goingto be treated in the same way, regardless of whether they areExcel files, SAS data sets, or even DB2 tables. But remember,don’t be fooled here. The phrase ‘pull into your project’ does notmean that Enterprise Guide is making a copy of the data sourcein your project. It is only creating a pointer to where that table istruly located.HOW DO I CREATE A REPORT?You are ready ‘make something happen’ in Enterprise Guide.Create a report that displays what percentage of the surveytakers were male and what percentage were female. Continuingwith the kitchen analogy, you might say you were getting ready toactually cook something!Figure 12 One-Way Frequencies Dialog BoxThis is discussed in depth later on, but for now, goahead and drag and drop the Gender column from theVariables to assign: pane onto the Analysisvariables role in the other window pane. A thirdwindow pane opens up; ignore it for now.You produce reports and analyze data in Enterprise Guide byusing tasks. You might want to think of a task like a recipe-select a particular recipe when you want a particular report. Asseen earlier, Enterprise Guide has made tasks available to you inthe Task List (Figure 3).Select the Finish button.The Tasks by Category tab conveniently groups the tasks underseveral different headings. If you want to count the number ofmales and females in theSurveyNumbers(SURVEYNUMBERS ) table, you might evensay that you are trying to describe this table. If you look underthe ‘Descriptive’ category in the Task List, you will see the OneWay Frequencies task. It turns out that this task will produce notonly frequency counts (how many do I have?) but alsoconveniently enough, percentages.You’ve done it. The results from the One-Way Frequencies taskshould display automatically.New-User: This task is called ‘one-way’ because it counts downa column in one direction only.Exp-User: The One-Way Frequencies task uses the FREQprocedure behind the scenes. If you want a two-way frequencyreport, take a look at the Table Analysis task, which uses thesame procedure.Oh, one more thing. The task that you activate is going toprocess on the currently active data source in your projectwindow. The currently active data source is the single datasource that is currently highlighted. The data source does nothave to be open in the data grid to be considered active; it simplyhas to be highlighted. It’s very easy to assign a new active datasource, so make sure that theFigure 13 One-Way Frequencies Results5
SUGI 28Beginning TutorialsBy now you have figured out that the tables that have been addedto the project are pretty small. The tables contain informationfrom only 10 surveys, and you can see from the report you justcreated that 70% of the survey takers were female. The OneWay Frequencies task calculates four statistics by default:frequency, percent, cumulative frequency, and cumulativepercent.In the Frequency table options pane, select theFrequencies and percentages option.Select the Finish button.Enterprise Guide asks you if you would like to replacethe results from the previous run? Select Yes tooverwrite the last report you created. That’s okaybecause both reports are not needed. (If you were toselect No, Enterprise Guide would save both sets oftasks and results.)But perhaps you don’t need all of those statistics. Maybe the lasttwo columns of cumulative statistics are not needed. Is there aneasy way to make modifications to your existing report? Surethere is! Close the report that you created and then rerun thesame One-Way Frequencies task using a different option.Exp-User: At this time, you might be ready to head off andexplore on your own. If you wish, invoke the One-WayFrequencies task again and check out the different tabs. Havefun and discover all that Enterprise Guide has to offer. If you stayfor the rest of the paper, there are more tips just for you.To-Do:Close the report that just opened in the work area byclicking on thein the upper-right corner of thereport.WHAT ELSE SHOULD I KNOW ABOUT TASKS?Take a look in the Project window and see that theSurveyNumbers(SURVEYNUMBERS ) table has aOne-Way Frequencies task underneath it (amongother things). Double-click on the One-WayFrequencies that is located in the Project window. (Donot double-click on the One-Way Frequencies that islocated in the Task List. If you double-click in the TaskList, you will be starting up a brand new task instead ofmaking changes to the one you already created.)The report you just created is the result of selecting theappropriate task from the Task List. It turns out that just aboutany time you want to produce a report, create a graph, or even doa statistical analysis, you will need to use a task.Exp-User: There are tasks available for the most popular SASprocedures and software features. Inherent to any point-andclick software product is that it cannot contain every singlepossible feature. At some point you might discover thatEnterprise Guide has not yet implemented one of your favoriteprocedures or options. If this has already happened to you, seethe FAQ at the end of this paper for a possible solution.After you have invoked your favorite task from the Task List, youfind that a lot of tasks have the following tabs: Columns, Results,and Titles. When you start up a new task, the Columns tab isusually preselected because this is the best starting place foreach task.New-User: The number of tabs that appear for each taskdepends completely on the task itself.Figure 14 Reopen One-Way Frequencies ResultsThe One-Way Frequencies dialog box is displayed.Observe that the task has saved the selections thatwere made before; the Gender column is still listedunder Analysis Variables.COLUMNS TABThe Columns tab enables you to select which columns from yourtable are going to be included in this task. Technically, this iscalled ‘assigning a variable to a role.’ The layout of this tab isalso dependent on the task you select. Take a look at the taskthat you have been working with, One-Way Frequencies.The Columns tab has not been discussed in depth yet,but it is covered in the next section. For now, go aheadand select the Statistics tab.As you can see in Figure 12, the variables or columns are listedunder the Variables to assign: pane and the roles are listedunder the One-way frequencies roles: pane. You can eitherdrag and drop variables one at a time, or use the arrow keysbetween the two window panes to move variables and assignthem to specific roles. As is common to many applications, usethe CTRL key to select more than one variable at a time.Numeric variables are identified with a blue dot icon andcharacter variables are identified with a red pyramid.RESULTS TABIn general, the Results tab enables you to save calculatedstatistics produced by a task into a permanent data set. Forexample, the One-Way Frequencies Results tab allows you tosave the frequency count and percentages of gender to a SAStable that you can use in another task. The new data set that iscreated will be attached underneath that task in the Projectwindow along with other reports.Figure 15 One-Way Frequencies Dialog – Statistics Tab6
SUGI 28Beginning TutorialsHOW DO I MODIFY MY DATA?The best way to make modifications to your data is to create aquery from this data. A query is simply a way of extracting datafrom one or more tables while specifying particular conditions tobe met. For example, suppose you want to determine which ofthe survey takers purchased a gift as part of their order. TheSurveyAnswers table contains a column GiftBought, whichreveals that information. The values of that column are Y or N.Your goal is to create a brand new table that contains only therows from the table where the value of GiftBought is equal to Y.This is done by creating a simple query.New-User: The concept of a query might be new to you.Structured Query Language (SQL) is a popular language thatallows you to retrieve data (and perform other actions) fromtables of data. The Query Builder constructs SQL code behindthe scenes while you point and click and build the query. Anotherway to think of a query is to think of it as asking your data aquestion. For example, “Can you tell me who bought gifts?”Figure 16 One-Way Frequencies Dialog Box – ResultsTabSELECTING CERTAIN ROWSTITLES TABWhenever you want to see certain rows of a particular table, youcan create a query that subsets or filters the rows of that table. InEnterprise Guide, the default result of a query is a SAS table.You start with a table and the result of the query is another tablethat contains only the rows you want.The Titles tab enables you to add custom titles and footnotes toyour reports. There are default titles and footnotes for mosttasks. If you want to have no titles and/or no footnotes, you needto delete the defaults in this tab.To-Do:New-User: You can see the default title of One-WayFrequencies Results and the default footnote of Generated bythe SAS System in the report you created (Figure 13).Select the SurveyAnswers table by clicking on its iconinside of the Project window. It is now the active datasource.Exp-User: You are limited to a total of 10 titles and 10 footnoteseach. You can use macro variable references in these titles andfootnotes.Select the Tasks by Category tab in the Task Listwindow. Use the scroll bar to move up and find theAdd Items to Project category.You have now seen the most common tabs found in tasks. Thetabs that appear are dependent on which task you have currentlyselected. Unfortunately, looking at every tab or task is beyondthe scope of this paper. How can you learn more about tasksand their tabs? Here are a couple of suggestions. First, look atthe bottom-right corner of any task dialog box (after you haveinvoked the task) and notice the Help button. Each task hascustomized help instructions. This is a great way to learn as yougo. Second, here are some recommended tasks for you toexplore:New-User:CATEGORYTASKDescriptiveList DataGraphBar or derneath this category, double-click the CreateQuery using Active Data task. This causes the QueryBuilder to display.TASKPROCCreate FormatFORMATDescriptiveSummary TablesTABULATERegressionLinearREGFigure 17 Query Builder – Filter Data TabThere is an enormous amount of functionality built intothe Query Builder, but for now, keep it simple. TheGiftBought column needs a subset or filter applied.Drag and drop that column from the left pane onto theFilter Data tab.7
SUGI 28Beginning TutorialsThe Edit Filter Condition dialog box displays. It ispopulated with most of the needed information. Selectthe Column Values button in the Filter constantspane and the ‘Y’ and ‘N’ values appear in the List ofColumn Value constants. Select the ‘Y’ value.Select OK.Observe that the Query Builder has saved theprevious selections; the filter on the GiftBoughtcolumn is still on the Filter Data tab. Select the Selectand Sort tab in the Query Builder. While there is a lotof functionality to discover on this one tab of the QueryBuilder, keep it simple.Notice how all of the columns have check marks besidethem by default. To suppress a column from appearingin the output table, clear the check box beside thatcolumn. Clear the check boxes for the followingcolumns: FoundIt, BuyAgain, and Navigate.Figure 18 Edit Filter Condition DialogueExp-User: Select the Show preview of the generatedcode check box to review the SQL code generated byEnterprise Guide.Select Run Query (Figure 17).Figure 19 Query Builder – Select and Sort TabThe new result table automatically displays and revealsthat the gift buyers are surveys numbered 4, 5, and 6.The name of the new table is Results of Query1 forsurveyanswers. That is too cryptic, so change thename.Exp-User: When you clear the check box for a column,Enterprise Guide replaces the single column name with thetwo-level qualifying name of tablename.columname that isstandard to SQL.Select Run Query.Right-click the Results of Query1 for surveyanswerstable inside of the Project window. (It is located underthe branch of the new query you just created, Query1for surveyanswers. Try not to get the two differentitems confused.) Select the Rename option. Changethe name of the table to Gift Buyers.Enterprise Guide asks you if you would like to replacethe results from the previous run? Select No tocreate a second query. The new table displaysautomatically and reveals that all the gift buyers arepleased with the prices. The responses rate the priceswith the top category of 5.SELECTING CERTAIN COLUMNSAnother popular way of querying data is to select only particularcolumns. Whenever you want to see certain columns of aparticular table, you can create a query that subsets or filters thecolumns of that table. While the Filter Data tab is used to filteron rows, use the Select and Sort tab to filter or select thecolumns you want to keep. Modify the previous query thatselects the gift buyers and keep only the following columns:SurveyNumber, GiftBought, and Prices. The result of thisquery is a small SAS table of three rows and three columns. Itallows you to see how the gift buyers rate the prices they saw onthe Web site.Figure 20 Result Table from Second QueryThe name of the query just created is Query1 forsurveyanswers. The name of the table just created isResults of Query1 for surveyanswers. Change bothnames to avoid any confusion later.To-Do:To modify the previous query, reopen the Query1 forsurveyanswers query by double-clicking on the bluefunnel icon inside the Project window. (Do not doubleclick on the Create Query using Active Data that islocated in the Task List. If you double-click in the TaskList, you start up a new task instead of making changesto the one you already created.)Right-click the second instance of Query1 forsurveyanswers query inside of the Project window. (Itis the second blue funnel icon. It is located below theother query you created and has the same name.)Select the Rename option. Change the name of thequery to Query2 for surveyanswers.8
SUGI 28Beginning TutorialsRight-click the Results of Query1 for surveyanswerstable insi
SUGI 28 advanced tutorial "Advanced Analytics with SAS Enterprise Guide ". The scenario used in this paper refers to a fictitious new company and their Web site named Kitchens-R-Us that sells typical kitchen products and supplies. The data used in this paper refers to an online survey. (If you'd like to create the data to follow along,
