Transcription
IBP1206 07PIPELINE LEAKAGE DETECTION AND LOCALIZATION USINGDISTRIBUTED FIBER OPTIC SENSINGDaniele Inaudi1, Branko Glisic2, Angelo Figini 3, Roberto Walder 4Copyright 2007, Instituto Brasileiro de Petróleo e Gás - IBPThis Technical Paper was prepared for presentation at the Rio Pipeline Conference & Exposition 2007, held between 2 and 4October 2007, in Rio de Janeiro. This Technical Paper was selected for presentation by the Technical Committee of the eventaccording to the information contained in the abstract submitted by the author(s). The contents of the Technical Paper, as presented,were not reviewed by IBP. The organizers are not supposed to translate or correct the submitted papers. The material as it ispresented, does not necessarily represent Instituto Brasileiro de Petróleo e Gás’ opinion, or that of its Members or Representatives.Authors consent to the publication of this Technical Paper in the Rio Pipeline Conference& Exposition 2007 Annals.AbstractDistributed fiber optic sensing offers the ability to measure temperatures and strain at thousands of points along a singlefiber. This is particularly interesting for the monitoring of pipelines, where it allows the detection and localization ofleakages of much smaller volume than conventional volume balance techniques. Sensing systems based on Brillouinand Raman scattering are used to detect and localize leakages in fluid, gas and multiphase pipelines, allowing themonitoring of hundreds of kilometers of pipeline with a single instrument and the localization of the leakage with aprecision of 1 or 2 meters. Early applications of this technology have demonstrated that the design and production ofsensing cables and their optimal location around the pipeline section are critical elements for the success of anydistributed sensing instrumentation project.This contribution presents advances in distributed sensing and in novel sensing cable design for distributed temperatureand strain measurements. The proper installation technique and location around the pipe is discussed for fluid and gaspipelines installed above ground, below ground and offshore. The paper also reports a number of significant fieldapplication examples of this technology as well as field tests with controlled leakages.1. IntroductionFlowlines – pipelines or gas-lines often cross hazardous environmental areas, from the point of view naturalexposures such as landslides and earthquakes, and from the point of view of third party influences such as vandalism orobstruction. These hazards can significantly change the original functioning of the flowline, leading to damaging,leakage and failure with serious economic and ecologic consequences. Furthermore, the operational conditions of thepipeline itself can induce additional wearing or even damage due to corrosion, erosion and fatigue.The structural and functional monitoring can significantly improve the pipeline management and safety. Providingregularly with parameters featuring the structural and functional condition of the flowline, monitoring can help (1)prevent the failure, (2) detect in time the problem and its position and (3) undertake maintenance and repair activities intime. Thus the safety is increased, maintenance cost optimized and economic losses decreased. Typical structuralparameters to be monitored are strain and curvature while the most interesting functional parameters are temperaturedistribution, leakage and third-party intrusion. Since the flowlines are usually tubular structures with kilometric lengths,structural monitoring of their full extent is an issue itself. The use of the discrete sensors, short- or long-gage ispractically impossible, because it requires installation of thousands of sensors and very complex cabling and dataacquisition systems, raising the monitoring costs. Therefore, the applicability of the discrete sensors is rather limited tosome chosen cross-sections or segments of flowline, but cannot extend to full-length monitoring. Other currentmonitoring methods include flow measurements at the beginning and end of the pipeline, offering an indication of thepresence of a leak, but limited information on its location.Recent developments of distributed optical fiber strain and temperature sensing techniques based on Raman andBrillouin scattering provide a cost-effective tools allowing monitoring over kilometric distances. Thus, using a limited1Ph.D., Physicist – SMARTEC SA, Manno, Switzerland, www.smartec.ch2Ph.D ., Civil Engineer – SMARTEC SA, Manno, Switzerland, www.smartec.ch3Civil Engineer – SMARTEC SA, Manno, Switzerland, www.smartec.ch4Sales Manager – SMARTEC SA, Manno, Switzerland, www.smartec.ch
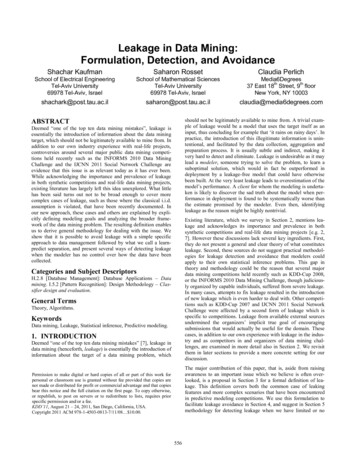
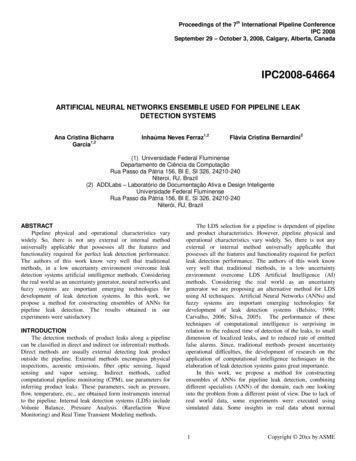
Rio Pipelne Conference & Exposition 2007number of very long sensors it is possible to monitor structural and functional behavior of flowlines with a highmeasurement and spatial resolution at a reasonable cost.Unlike electrical and point fiber optic sensors, distributed sensor offer the unique characteristic of being able tomeasure physical and chemical parameters along their whole length, allowing the measurements of thousands of pointsusing a single transducer. The most developed technologies of distributed fiber optic sensors are based on Raman andBrillouin scattering. Both systems make use of a nonlinear interaction between the light and the silica material of whichthe fiber is made. If light at a known wavelength is launched into a fiber, a very small amount of it is scattered back atevery point along the fiber. Besides the original wavelength (called the Rayleigh component), the scattered lightcontains components at wavelengths that are different form the original signal (called the Raman and Brillouincomponents). These shifted components contain information on the local properties of the fiber, in particular strain andtemperature. Figure 1 shows the main scattered wavelengths components for a standard optical fiber. It can be noticedthat the frequency position of the Brillouin peaks is dependent on the strain and temperature conditions that werepresent at the location along the fiber where the scattering occurred, while the intensity of the Raman peak istemperature dependent.Figure 1. Light scattering in an Optical FiberWhen light pulses are used to interrogate the fiber, it becomes possible, using a technique similar to RADAR, todiscriminate different points along the sensing fiber by the different time-of-flight of the scattered light. Combining theradar technique and the spectral analysis of the returned light one can to obtain the complete profile of strain ortemperature along the fiber. Typically it is possible to use a fiber with a length of up to 30 km and obtain strain andtemperature readings every meter. In this case we would talk of a distributed sensing system with a range of 30 km anda spatial resolution of 1 m.Raman scattering is the result of a nonlinear interaction between the light traveling in a fiber and silica. When anintense light signal is shined into the fiber, two frequency-shifted components called respectively Raman Stokes andRaman anti-Stokes will appear in the backscattered spectrum. The relative intensity of these two components dependson the local temperature of the fiber. Systems based on Raman scattering typically exhibit a temperature resolution ofthe order of 0.1 C and a spatial resolution of 1m over a measurement range up to 8 km.For temperature measurements, the Brillouin sensor is a strong competitor to systems based on Raman scattering,while for strain measurements it has practically no rivals. Brillouin scattering is the result of the interaction betweenoptical and sound waves in optical fibers. Thermally excited acoustic waves (phonons) produce a periodic modulationof the refractive index. Brillouin scattering occurs when light propagating in the fiber is diffracted backward by thismoving grating, giving rise to a frequency-shifted component by a phenomenon similar to the Doppler shift. The mostinteresting aspect of Brillouin scattering for sensing applications resides in the temperature and strain dependence of theBrillouin shift. This is the result of the change the acoustic velocity according to variation in the silica density. The bestBrillouin scattering systems offer a temperature resolution of 0.1 C, a strain resolution of 20 με and a measurement2
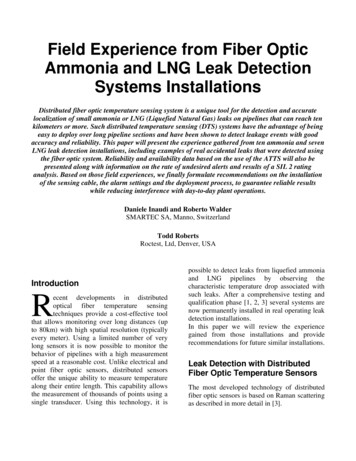
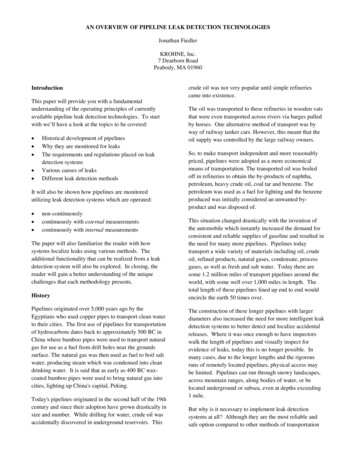
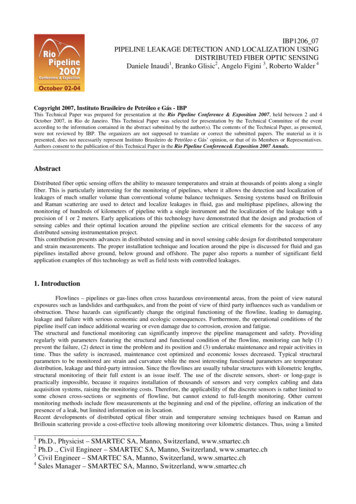
Rio Pipelne Conference & Exposition 2007range of 30 km with a spatial resolution of 1 m. The systems are portable and can be used for field applications. Figure2 shows an example of a Raman and a Brillouin interrogator.Figure 2. Raman and Brillouin distributed sensing interrogators.Since the Brillouin frequency shift depends on both the local strain and temperature of the fiber, the sensor design willdetermine the actual sensitivity of the system. For measuring temperatures it is necessary to use a cable designed toshield the optical fibers from an elongation of the cable. The fiber will therefore remain in its unstrained state and thefrequency shifts can be unambiguously assigned to temperature variations. Measuring distributed strains also requires aspecially designed sensor. A mechanical coupling between the sensor and the host structure along the whole length ofthe fiber has to be guaranteed. To resolve the cross-sensitivity to temperature variations, it is also necessary to install areference fiber along the strain sensor. Special cables, containing both free and coupled fibers allow a simultaneousreading of strain and temperature. Figure 3 shows examples of temperature, strain and combined cables.Figure 3. Sensor Cable for Temperature, Strain and combined Strain and Temperature.2. Pipeline Leakage detectionThe basic principle of pipeline leakage detection through the use of distributed fiber optic sensing relies on asimple concept: when a leakage occurs at a specific location along the pipeline, the temperature distribution around thepipeline changes. This change in temperature is localized both in space (a few meters around the leakage location) andin time (the onset of the leak). This makes the algorithmic detection of leaks relatively easy to implement. The origin ofthe temperature disturbance around the pipeline depends on the type of pipeline and its surroundings. The most typicaleffects are the following: The released liquid is warmer than the surrounding soil (typical for buried oil pipelines) The released gas produces a local cooling due to pressure release (typical for buried, underwater and surfacegas pipelines) The released liquid changes the thermal properties of the soil, in particular thermal capacity, and influencesthe natural day/night temperature cycles. A warm plume is formed around the pipeline (typical for underwater oil pipelines) In the case of multiphase pipelines a combination of the above can occur.Knowing the above effects, one can determine the ideal sensing cable placement around the pipeline.3
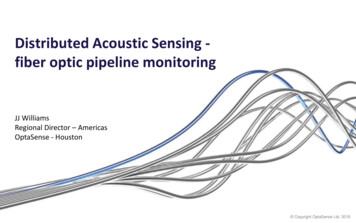
Rio Pipelne Conference & Exposition 2007In the case of a buried oil pipeline the best location for the sensing cable is below the pipe, but not in direct contact. Atthat position there is a maximum probability of collecting the released oil, independently form the leakage location.This is depicted in Figure 4.Figure 4. Detection of a liquid leak through a cable placed under the pipeline.If the pipeline is installed below the water table or underwater, the oil will have a tendency to rise and not to sink. Inthis case, the ideal placement is reversed.As we have pointed out, a gas leakage produces a temperature drop at the leak location. This has the tendency to cooldown the pipeline itself and its surroundings. The best position for the temperature sensing cable is in this case in directcontact with the pipeline surface. In this case we make use of the good thermal conduction properties of the pipelineitself to transfer the cooling from the leak to the cable. An example of such installation is depicted in Figure 5.Figure 5. Detection of a gas leak through a cable placed on the pipeline. This arrangement can also be used to detect athird-party intrusion.This arrangement can also be used to detect an intrusion attempt. When the pipe surface is exposed to the air; this alsoproduces a local thermal change that can be detected by the same cable. In this situation, the best location is obviouslyabove the pipeline.3. Qualification TestsIn the following sections we will present two qualification tests that were performed to demonstrate the abilityof a distributed fiber sensor to detect oil and gas leakages, respectively.3.1. Oil Leakage simulationTo simulate an oil leakage form a buried pipeline, a test has been performed at the premises of Praoil in Italy,in cooperation with Electronic News. The optical fiber cable, containing two optical fibers, was buried in a small layerof sand at approximately 1.5 m below ground. Successively, a polyethylene pipe was placed above the cable, in aserpentine, and provided with taps allowing a controlled injection of water in the ground. Several taps were installedwith varying horizontal and vertical distances to the sensing cable. Each tap was also instrumented with a volume meterto asses the leak volume and capacity. The temperature of the injected water could also be adjusted to simulate differentoperational conditions. Figure 6 illustrates the testing setup.4
Rio Pipelne Conference & Exposition 2007Figure 6. Leakage detection simulation arrangement. Warm water is injected in the ground at different positions withrespect to the sensing cable positions. Several taps, with volume meters are used to generate controlled leaks.In a first testing session, four leakages were produced in sequence at different location. The following table summarizesthe leaks.Table 1. Test 7.10D1 openingD1 closingD2 openingD2 closingD3 openingD3 closingD4 openingD4 closingFLOW RATE[l/min]10LEAKAGE VOLUME [m3]160.40140.9160.060.08The next Figure 7 shows the raw temperature data recorded during the test. Although temperature profiles wererecorded every minute, for clarity, we have depicted only one measurement every 10 minutes.40353.10 PM3.20 PM303.30 PMtemperatura[o[C]temperatureC]3.40 PM253.50 PM4.00 PM4.10 Pm204.20 PM4.30 PM154.40 PM4.50 PM5.00 PM105.10 PM5.20 sizione[m][m]positionFigure 7. Raw temperature data for the leakage test.5
Rio Pipelne Conference & Exposition 2007The initial temperature variations, from the beginning of the cable to approximately 38m correspond to a section of thesensing cable above ground and are due to different contact with the ground and sunshine conditions. From meter 38 to117 the cable is in the ground and its temperature is much more constant, around 12 C. From meter 117 to 158 thecable is again in the air and than re-enters the ground coming back in the opposite direction. The interesting section forthe experiment is therefore the one between 38 and 117 meters. In figure 7 it is already possible to observe a couple oftemperature peaks at leakage locations, however other leaks are not easily visible and additional processing is thereforenecessary.The first step is to move to a relative visualization, where the temperature is plotted relatively to a referencetemperature profile obtained at the beginning of the test. Once this is done, we obtain the results shown in Figure 8. Allfour leakages are now clearly visible. It has to be noticed than the fist leakage was in the transition zone between buriedand exposed section of pipe and cable.141st leakage ( p1 40 m , ΔT 12oC)122nd leakage ( p2 58 m , ΔT 1oC)103.10 PM3.20 PM3rd leakage ( p3 78 m , ΔT 3.5oC)3.30 PM83.40 PMΔTΔ T[o[C]C]4th leakage ( p4 110 m , ΔT 6oC)3.50 PM4.00 PM64.10 PM4.20 PM44.30 PM4.40 PM4.50 PM25.00 PM5.10 PM5.20 ioneposition[m][m]Figure 8. Relative temperature data for the leakage test.The temperature peaks from the four leakages are clearly visible.In order to quantify the detection time and released volume we will now concentrate on a single leak and observe theassociated temperature evolution. Figure 9 shows the temperature evolution at the location of leakage 3.3.51leakage temperature trend0.930.70.620.51.50.40.31detection volume 0.6 m30.20.50.15.20 PM5.10 PM5.00 PM4.50 PM4.40 PM4.30 PM4.20 PM4.10 PM4.00 PM3.50 PM3.40 PM3.30 PM03.20 PM03.10 PMT [oCΔΔTC]]detection time 50 minvolume perdita 3leakagevolume [m ]0.8leakage volume2.5oraacquisitionacquisizionetimeFigure 9. Temperature and leaked volume evolution at leak location 3.6
Rio Pipelne Conference & Exposition 2007In this case the leakage was started at 3:40 PM. The temperature started rising at 4:20 PM and reached the presetthreshold level of 0.5 C at 4:30, 50 minutes after the leakage started. During those 50 minutes a total of 0.6 cubicmeters of water have been released in the ground. The maximum temperature change was of the order of 3.5 C, whilethe injected water had a temperature of 20 C above the ground temperature. This experiment was one of those showinga relatively slow response because of the large lateral distance between the injection point and sensing cable. Thefollowing table resumes the results of all the performed tests:Table 2. Summary of test resultsTestTapFlow Rate[L/Min]12345D1D2D3D4D4101614613Water to groundtemperaturedifference [ C]202020204Detection Time [min]Leakage Volume [M3]180502750.0050.4000.6000.0100.800In summary, this test simulates leakage along pipeline with a diameter between 12 and 32 inches with a flow ratebetween 300 and 3500 m3 per hour. Average flow rate of the leakage is 0.6 m3 per hour, corresponding to a detectedleakage of 0.1-0.01% of the transported volume. This is significantly better than any available volume balance methodcurrently available. Detection time was between 1 and 80 minutes and the accuracy in leakage localization was betterthan 2 m. In test 5, performed in a different day, the temperature difference between fluid and ground was only 4 C, butthe detection time remained in the order of one hour for a leakage of 0.01%.The variability in the detection time and volume reflects the different local conditions and in particular: Permeability of the soil (type of soil) Compaction of the soil (presence of cracks and pockets) Proximity between the leakage and the sensor Temperature difference between fluid and groundFigure 10. Gas leakage detection simulation test.Figure 11. Temperature drop due to gas pressure releaseindicates the presence of a leakage.3.2. Gas Leakage simulationTo evaluate the suitability of a distributed temperature sensing system for gas leakage detection, an experimentwas performed on a real gas pipeline in Italy. A fiber optic temperature sensing cable was installed on the top of a 10”gas pipeline over a length of 500m. This installation was part of a larger test on measuring strain induced in the pipelineby a landslide. During the putting the sensors in place and burring of the pipe, an empty plastic tube was installedconnecting the pipeline surface to the open air, 50 m far from the beginning of the instrumented zone. This tube wasused to simulate a leakage of gas. In fact, carbon dioxide was inserted in the tube, cooling down the pipe and making7
Rio Pipelne Conference & Exposition 2007the thermal field surrounding the contact between the pipe and the tube similar to the conditions expected in case of aleakage. This process is presented in Figure 10. A total of 4 carbon dioxide tanks were discharged through the dummypipe.A reference measurement was performed before the tube was cooled down. After the carbon dioxide was inserted, thetemperature measurements are performed every 2 to 10 minutes and compared with the reference measurement. Theresults of the test are presented in Figure 11. The test was successful and the point of simulated leakage was clearlyobserved in diagrams (encircled area in Figure 11). The recorded temperature drop was of 3.5 C.3.3 Other applicationsBesides the presented qualification tests, the described monitoring system have been applied in the followingother pipeline applications: Brine pipeline of 55km in Germany, leakage detection Raw oil pipeline in Germany, temperature profile during pigging operations Monitoring of a 500m section of gas pipeline in Italy, evaluation of strain induced by landslide Ammonia pipeline of 3km in Italy, leakage detection Ammonia pipeline of 2km in Italy, leakage detectionThe interested reader will find more details on these applications in the papers referenced in the bibliography.4. ConclusionsThe use of a distributed fiber optic monitoring system allows a continuous monitoring and management ofpipelines, increasing their safety and allowing the pipeline operator to take informed decisions on the operations andmaintenance of the pipe. The presented monitoring system and the qualification tests shown in this paper demonstratehow it is possible to detect and precisely localize leakages from oil and gas pipelines with unprecedented sensitivity.Through the identification of temperature anomalies, it is possible to detect and localize leakages of small entity, whichcannot be detected by conventional volumetric techniques. Furthermore, the ability to pinpoint the exact location of theleak allows an immediate reaction at the event location, minimizing downtime and ecological consequences.Recent developments in distributed fiber sensing technology allow the monitoring of 60 km of pipeline from a singleinstrument and of up to 300 km with the use of optical amplifiers. To achieve the above-mentioned goals and take fulladvantage of the described sensing technology, it is however fundamental to select and appropriately install appropriatesensing cables, adapted to the specific sensing need. While it is generally easier to install sensing cables during thepipeline construction phases, it is sometimes possible to retrofit existing pipelines. In some cases it is even possible touse existing fiber optic telecommunication lines installed along a pipeline for temperature monitoring and leakagedetection.5. AcknowledgementsThe authors would like to thank the following persons and organizations for their support in the realization ofthe presented tests: Lorenzo Carcione (Praoil, Italy), Lorenzo Danzini (Praoil, Italy), Marco Montanari (ElectronicNews, Italy), Piergiorgio Braiani (Electronic News, Italy), Giuseppe Milani ( SNAM Rete Gas, Italy), MaurizioZecchin (ENI, Italy), Omnisens SA, Sensornet Ltd.6. ReferencesINAUDI, D., GLISIC, B. Long-Range Pipeline Monitoring By Distributed Fiber Optic Sensing, 6th InternationalPipeline Conference September 25 - 29, 2006, Calgary, Alberta, Canada'(2006)INAUDI, D., GLISIC, B. Fiber Optic Sensing for Innovative Oil & Gas Production and Transport Systems, 18thInternational Conference on Optical Fiber Sensors, October 23-27, Cancun, Mexico'(2006)NIKLES, M. et al. Leakage detection using fiber optics distributed temperature monitoring, 11th SPIE's AnnualInternational Symposium on Smart Structures and Materials (2004)NIKLES, M. et al. Greatly extended distance pipeline monitoring using fiber optics, OMAE05 24th InternationalConference on Offshore Mechanics and Arctic Engineering 2005, Halkidiki, Greece, June 12-17'(2005), .8
2. Pipeline Leakage detection The basic principle of pipeline leakage detection through the use of distributed fiber optic sensing relies on a simple concept: when a leakage occurs at a specific location along the pipeline, the temperature distribution around the pipeline changes.