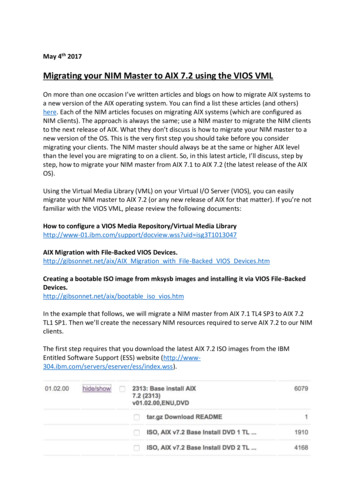
Transcription
AIX Monitoring GuidelinesBest Practice
About Ash GiddingsWith more than 20 years’ experience in the IT industry andcoming from an operational background, Ash Giddings is acommercially astute technical manager. He has worked for someof the largest Data Centers in Europe and in the US has advisedFortune 500 companies on major projects to save costs andimprove efficiencies.His apprenticeship was served on the IBM Mainframe, where heacquired his key skills by the following of structured processesand best practice principles.Later in his career he applied those skills to midrange systems such as IBM i and AIX as well asother platforms including Windows and Linux .In his role as Product Manager for Halcyon – A Division of HelpSystems, Ash enjoys finding solutionsfor challenging IT problems. He has a broad, generalist approach – with deep dives into technicalsubjects including monitoring and automation techniques for critical services, core processes andbusiness applications as well as the art of performance management.
AIX Monitoring Guidelines – Best PracticeForewordby Ash GiddingsThere is a proliferation of Power Systems hardware in the market place and the hardware looksidentical (regardless of whether it is hosting IBM i, AIX, Linux or Windows operating systems).This can create the perception that the operating systems running on Power, (e.g. AIX and IBM i)must be quite “similar”. The consequence of this assumption is that technical people, experienced inmanaging IBM i systems, are often plunged into the world of monitoring of AIX systems and quicklyrealize that it is an ‘older’ interface with specialist commands that do not make sense - unless youhave been brought up in a UNIX environment.In the world of business, major commercial events, like company mergers and acquisitions, alsocreate the scenario where AIX systems may become a critical part of your infrastructure. This meansthat with little prior knowledge, your IT staff, who may not have AIX skills, need to be able tomonitor and manage systems which are unfamiliar, but are running applications and processes onwhich your business relies.In response to the scenarios above and requests from customers, I have written this guide for threereasons:1) To demystify the art of managing AIX systems2) To give you a reference document on what are the important things to monitor on AIX systemsand why3) To show how to make a systems administrator’s life less stressful by adopting an appropriatemonitoring solution and an approach that uses pre-configured, adaptable templates formonitoring and management of your AIX environmentThe purpose of this guide is to let people know that AIX is “just another operating system” and thatyou do not have to become an expert in AIX to successfully manage it.This guide is aimed at technical people, systems administrators, computer operators, but also seniorIT managers who need to gain an understanding of what it is important to look for (and look after) sothat they can ensure the smooth running of their business operations. Halcyon – A Division of HelpSystemsPage 3
AIX Monitoring Guidelines – Best PracticeTable of ContentsForeword . 3Introduction . 5AIX Error Report . 6Volume Groups . 6Logical Volumes . 6Filesystems . 6Disks . 7CPU, Memory and Paging Space . 7Process Monitor . 8Server Configuration . 9Log Files. 10Network . 10Network File System . 11Appendix 1 – AIX Monitoring Templates . 12AIX System Monitoring (Basic) Template . 12AIX System Monitoring (Advanced) Template . 18Appendix 2 – AIX Monitoring Template Assignment . 20AIX System Monitoring (Standard) Template . 20AIX System Monitoring (Advanced) Template. 26 Halcyon – A Division of HelpSystemsPage 4
AIX Monitoring Guidelines – Best PracticeIntroductionThis document aims to provide a high level overview of baseline monitoring for the IBM AIXplatform. The vast majority of monitoring elements detailed in this document have been included asa Central Configuration Manager template and are now shipped as part of Network Server Suite. Halcyon – A Division of HelpSystemsPage 5
AIX Monitoring Guidelines – Best PracticeAIX Error ReportAIX error codes take the following format:Field 1 – AIX error identifier (8 digit hexadecimal)Field 2 – Error labelField 3 – Error type (4 character) of values: (INFO, PEND, PERF, PERM, TEMP, UNKN)Field 4 – Error class (1 character) of values:H - HardwareS - SoftwareO - Error loggerU - UndeterminedField 5 – Error descriptionVery few AIX errors would not need to be alerted to the local administrators so it is advised that allare alerted on. Your software should poll the error log and any new entries should be alerted asstandard.From AIX 5 onwards, you can limit the number of duplicates reported within a certain time frame.Hardware failure errors, Logical Volume Manager errors are generally critical and should be flagged assuch.Although not directly attributed to the Error Report its good practice to run a dumpcheck(/usr/lib/ras/dumpcheck) once a day at a peak time (this is normally added as a cron job by default oninstallation of AIX). If the system dump device is not big enough for a potential machine failure anerror will be generated in the Error Report.Volume GroupsDefined Volume Group statuses should always be active and there should never be any StalePartitions.Check that Quorum is set to off for any mirrored volume groups.Logical VolumesThere should never be any Stale Physical Partitions associated with Logical Volumes resigning onsystem.The normal working status for Logical Volumes is open/syncd.FilesystemsSpace checking should be against percentages configured by the end user for each filesystem asmonitoring depends on the size and usage of the individual filesystem. Halcyon – A Division of HelpSystemsPage 6
AIX Monitoring Guidelines – Best PracticeFor example, a 1 TB filesystem housing Oracle datafiles would have very different requirements froma 256Mb /var filesystem on the same server.For normal filesystems space less than 20% free should be alerted upon.Key Filesystems /, /tmp, /usr, /home and /var should always be resident.The availability of sufficient Inodes can be critical and you should monitor for less than 10% beingfree.Journaled Filesystems should have separate logging devices.DisksDisk activity taken over a number of samples over 80% should be alerted upon.Verify MultiPath I/O (MPIO) path failures – the normal status should read enabled.Any disks that have a status of missing or removed would tend to indicate an issue and should beinvestigated (these will also be written to errpt).A system could potentially be I/O bound if %iowait 25% and / or %tm act 70% and should beinvestigated.CPU, Memory and Paging SpaceFrom AIX 5.3 the processor’s simultaneous multi-threading mode should be checked and alertedupon if it is capable but not enabled. However, in some rare situations, threading off will increaseperformance.Historically the runqueue would be an element to keep a close check (alerting if the runqueueexceeded the number of CPU multiplied by 2) but with more powerful P-Series servers the valuebeing monitored for should be increased to suit.Although not an error as such it’s worth checking lparstat on lpar’d machines for over utilization.Check for sustained (multiple samples of) %usr %sys 95%. This would tend to indicate a very busybox that could possibly be CPU bound.The percentage of CPU time spent waiting on disk I/O (wio time) should be measured in samples andbe alerted on 25% as this indicates a potential I/O bound machine.Paging Space Utilization should be tracked and a general rule being 30% used means that there isprobably too much page space while 70% means there is probably too little page space. Halcyon – A Division of HelpSystemsPage 7
AIX Monitoring Guidelines – Best PracticeThe paging of the Paging Space is absolutely critical and would indicate a shortfall of RAM. Check thisby monitoring for Paging 0.Useful additional commands used for sampling software for memory footprints:svmon -G provides a global report. You can see the size of memory, how much is in use and theamount that is free. It provides details about how it is being used and it also provides statistics onpaging space. All numbers are reported as the number of frames. A frame is 4 KB in size.svmon -Pt 3 displays memory usage of the top 3 memory-using processes sorted in decreasing orderof memory demand.Process MonitorMandatory processes that should be alerted if not running; tional processes (may not be configured to run); mailsshd Halcyon – A Division of HelpSystemsPage 8
AIX Monitoring Guidelines – Best PracticeServer ConfigurationConfiguration files – Check for modifications. ontabs/root/etc/sendmail.cf/etc/ssh/ssh config (optional)/etc/ssh/sshd config k for following lines in /etc/inetd.conf – any services not being used in the environment shouldbe commented out. Note, they are all available by default. ftptelnetshellloginexecntalkdaytimetimeCheck users with pwck for inconsistencies in /etc/passwd & /etc/security/passwd Halcyon – A Division of HelpSystemsPage 9
AIX Monitoring Guidelines – Best PracticeLog FilesConsole logFailed loginsError ReportCron log/var/adm/ras/conslog (alog –o –t console)/etc/security/failedlogin (who -a /etc/security/failedlogin)/var/adm/ras/er rlog (last)/var/adm/cron/logConslog, failedlogin and errlog are all binary based files and must be accessed via the methods above.NetworkNetwork problems are by their nature very difficult to spot and normally require further investigation.The starting points are listed here and are not currently shipped as a template with the Halcyon AIXServer Manager.netstat –m:Look for any failures on mbuf allocation. Indicates “thewall” parameter not set high enough.netstat –p udp:Look for “packets dropped due to no socket” ! 0 and “socket overflows” 0 indicates udp sendsocket parameter too low.netstat –p tcpip:Compare the number of packets sent to the number of data packets retransmitted. If the number ofpackets retransmitted is over 10-15% of the total packets sent, TCP is timing out indicating thatnetwork traffic may be too high for acknowledgements (ACKs) to return before a timeout. Abottleneck on the receiving node or general network problems can also cause TCP retransmissions.Compare the number of packets received with the number of completely duplicate packets. If TCP ona sending node times out before an ACK is received from the receiving node, it will retransmit thepacket. Duplicate packets occur when the receiving node eventually receives all the retransmittedpackets. If the number of duplicate packets exceeds 10-15%, the problem may again be too muchnetwork traffic or a bottleneck at the receiving nodenetstat –in:If the Oerrs column is greater than 1% of Opkts, the send queue size for that interface may need to beincreased. If Ierrs is greater than 1 % of Ipkts, then memory may be a problem. The transmit queuesize can be changed via SMIT or the chdev command. The mtu size can be changed by the ifconfig orchdev commands or through SMIT.netstat -vLook if there is any value in the S/W Transmit Queue Overflow field which would indicate a need for alarger transmit queue size. Halcyon – A Division of HelpSystemsPage 10
AIX Monitoring Guidelines – Best Practicenetstat –DThe -D option of netstat displays the number of packets received (Ipkts), transmitted(Opkts) and dropped (Idrops, Odrops) in the communications subsystem. The importantinformation seen here are the dropped packets particularly with the device drivers (dd). If packets arebeing dropped at the device driver, then you want to increase the queue size on the device driver.Network File SystemThis section of the baseline document covers the Network File System (NFS) is intended as generaltips and has therefore not been configured in a standard template of the Halcyon AIX ServerManager.nfsstat –s:If bad calls are greater than 0 the server is rejecting RPC requests. Whenever thenfsd daemon isscheduled to run but doesn't find a packet on the NFS server queue, the nullrecv field getsincremented by one. The server may be running an excessive number of nfsd daemons – this can bechecked by using the command lssrc.badlen refers to an empty or truncated RPC packet. The packet could have been damaged by anetwork problem.xdrcall refers to an XDR header that may have been damaged. This is rare, but can happen more oftenif the network is a WAN rather than a LANFor nfs clients:badcalls indicates RPC failures due to timeouts (if a server does not respond within a timeout period)and interrupts (if a file system mount is interrupted with the intr option).This differs from the badcalls as shown under the NFS statistics, which indicate authentication errors.retrans indicates the number of retransmissions because no response was received for the server. Ifthere is poor server response time, retrans will have a high number. Halcyon – A Division of HelpSystemsPage 11
AIX Monitoring Guidelines – Best PracticeAppendix 1 – AIX Monitoring TemplatesThe Halcyon approach: Managing by automation and the use of rule-based templatesAIX is very text based (there is a graphical user interface but it is not a sophisticated one) so youcan look at the AIX console and run powerful commands that give you really good information but nevertheless it’s only displayed on a console. This means that unless you are watching it24 x7 you might miss something important.A better way of doing things is to have a solution in place which can run the AIX commands,automatically ‘read’ the responses and one which “taps you on the shoulder” if there is an issueor something is about to go wrong. To cover all bases it makes sense to use the same solution tohandle your escalation procedures and also send information to one console for centralizedmanagement of all alerts across your enterprise.Look for solutions which will integrate with your helpdesk system and can also provide, viamobile ‘apps’, access to the Enterprise Console using your smartphones and tablets.Halcyon have made the investment to develop solutions which automate processes, notify IT staff ofany issues (via email, console display or mobile devices), comply with your escalation procedures,and integrate with your existing IT systems and your helpdesk software.Working with IBM business partners, ISVs and customers Halcyon have also created rule-basedtemplates to monitor AIX systems and a comprehensive list is presented below.AIX System Monitoring (Basic) TemplateThe AIX System Monitoring (Basic) template contains filters covering all of the AIX Monitors withthe exception of the System Monitor. The following filters are defined:AIX Error Report MonitorThis monitor checks against the AIX Error Report, which contains a list of logged errors. This monitorcontains the following two filters:Hardware Errors - Errpt(Class H)This filter checks for any hardware errors that are reported within the AIX Error Report. These areidentified as being of class H. An alert is generated if any class H errors are found within the AIXError Report.Software Errors - Errpt(Class S)This filter checks for any software errors that are reported within the AIX Error Report. These areidentified as being of class S. An alert is generated if any class S errors are found within the AIX Error Report. Halcyon – A Division of HelpSystemsPage 12
AIX Monitoring Guidelines – Best PracticeAIX Subsystem Report MonitorThis monitor checks for critical subsystems being present and active. It contains the following sixfilters:Critical Subsystem (inetd) Does Not Exist - Subsystem Does Not Exist(inetd)This filter checks for the existence of the AIX subsystem ‘inetd’. An alert is generated if this criticalsubsystem is not found.Critical Subsystem (inetd) is Inoperative - Subsystem is Inoperative(inetd)This filter checks that the AIX subsystem ‘inetd’ is active. An alert is generated if this criticalsubsystem is in an inoperative state.Critical Subsystem (qdaemon) Does Not Exist - Subsystem Does Not Exist(qdaemon)This filter checks for the existence of the AIX subsystem ‘qdaemon’. An alert is generated if thiscritical subsystem is not found.Critical Subsystem (qdaemon) is Inoperative - Subsystem is Inoperative(qdaemon)This filter checks that the AIX subsystem ‘qdaemon’ is active. An alert is generated if this criticalsubsystem is in an inoperative state.Critical Subsystem (syslogd) Does Not Exist - Subsystem Does Not Exist(syslogd)This filter checks for the existence of the AIX subsystem ‘syslogd’. An alert is generated if this criticalsubsystem is not found.Critical Subsystem (syslogd) is Inoperative - Subsystem is Inoperative(syslogd)This filter checks that the AIX subsystem ‘syslogd’ is active. An alert is generated if this criticalsubsystem is in an inoperative state.Logical Volume MonitorThe AIX Logical Volume monitors the status of Logical Groups, Logical Volumes and Physical Volumesof the AIX system and contains the following two filters:Alert when Quorum is Set To On When Disk Mirroring is Active(rootvg) Measure(Quorum) Trigger( 0)A quorum is a state in which 51 percent or more of the physical volumes in a volume group areaccessible. A quorum is a vote of the number of Volume Group Descriptor Areas and Volume GroupStatus Areas (VGDA/VGSA) that are active. A quorum ensures data integrity in the event of a diskfailure. When a quorum is lost, the volume group varies itself off so that the disks are no longeraccessible by the Logical Volume Manager (LVM). This filter checks to ensure that the Quorum isavailable when disk mirroring is active and raises an alert if set to On.Volume Group (rootvg) Does Not Exist - Volume Group rootvg Does Not ExistRoot Volume Group (rootvg) is a volume group containing the Base Operating System (BOS). Thisfilter checks to ensure that the Root Volume Group exists and raises an alert if it is not found to bepresent. Halcyon – A Division of HelpSystemsPage 13
AIX Monitoring Guidelines – Best PracticeScript MonitorThe AIX Script Monitor runs custom AIX scripts and commands and checks the output againstRegular Expressions. This contains the following two filters:Check for Failed Logins - Script(/var/lib/halcyon/logfails.sh denied)This filter checks for any failed login attempts. Any failed login attempts found are entered in thefailedlogins.log. The filter, ‘Monitor for Failed Logins’ within the Log File Monitor, then looks for anyentries within this file.Check for Missing or Removed Disks - Script(lspv missing removed)This filter runs the lspv command and checks to see if any disks are reported as missing or removed.An alert is raised upon discovery of either of these two conditions.AIX File & Folder MonitorThe AIX File & Folder Monitor checks the current status of specific files within the AIX system andcontains the following seven filters:File (/etc/aixmibd.conf) Has Changed - File(/etc/aixmibd.conf) Trigger(Has Changed)This filter checks the file; /etc/aixmibd.conf. This file is used to configure the thresholds for many AIXmonitors. An alert is generated if a change is detected to the modified date of this file.File (/etc/inetd.conf) Has Changed - File(/etc/inetd.conf) Trigger(Has Changed)This filter checks the file; /etc/inetd.conf. This file, also known as the super server, loads a networkprogram based upon a request from the network. An alert is generated if a change is detected to themodified date of this file.File (/etc/inittab) Has Changed - File(/etc/inittab) Trigger(Has Changed)This filter checks the file; /etc/inittab. This file is a script that controls most of the boot sequence. Itdictates what programs and scripts to launch and at what runlevels. An alert is generated if a changeis detected to the modified date of this file.File (/etc/profile) Has Changed - File(/etc/profile) Trigger(Has Changed)This filter checks the file; /etc/profile. This file contains system wide environment details and startupprograms. An alert is generated if a change is detected to the modified date of this file.File (/etc/security/login.cfg) Has Changed - File(/etc/security/login.cfg) Trigger(HasChanged)This filter checks the file; /etc/security/login.cfg. The /etc/security/login.cfg file is an ASCII file thatcontains stanzas of configuration information for login and user authentication. An alert is generatedif a change is detected to the modified date of the file.File (/etc/sendmail.cf) Has Changed - File(/etc/sendmail.cf) Trigger(Has Changed)This filter checks the file; /etc/sendmail.cf. This is a lengthy and detailed configuration file and directediting of this file should be avoided. An alert is generated if a change is detected to the modifieddate of the file.File (/var/spool/cron/crontabs/root) Has Changed - File(/var/spool/cron/crontabs/root)Trigger(Has Changed)The /var/spool/cron/crontabs/root file contains commands needed for basic system control. Thisfilter checks this file and raises an alert if any changes have been made to the file since the last timethe filter ran. Halcyon – A Division of HelpSystemsPage 14
AIX Monitoring Guidelines – Best PracticeLog File MonitorThe AIX Log File Monitor checks AIX Log Files for failed user login attempts and new entries beingposted to the Cron Log file. This monitor contains the following two filters:Monitor for Failed Logins - LogFile(/var/lib/halcyon/failedlogins.log) Expression(.*)This filter checks the failedlogins.log file for any entries. An alert is generated if any failed logins arereported within the /var/lib/halcyon/failedlogins.log file.Monitor for New Entries in Cron Log - LogFile(/var/adm/cron/log) Expression(.*)This filter checks the /var/adm/cron/log for any new entries. The cron daemon, that controls theautomatic running of commands creates a log of its activities in the /var/adm/cron/log file. An alertis generated if any new entries are recorded in this log file.CPU, Filesystem and Memory MonitorThe AIX CPU, Filesystem and Memory Monitor template contains the following sixteen filters, thatmeasure filesystem, memory and CPU performance and alerts if thresholds are breached.Filesystem (/) Disk Space Used 80% - Group(Filesystem) Volume(/)Type(UsedPercent) Trigger( 80%)This filter checks that the root filesystem ‘/’ on volume ‘/’ has more than 20% free space available atall times. An alert is generated if the available disk space on filesystem ‘/’ equals or exceeds 80percent.Filesystem (/) Does Not Exist - Group(Filesystem) Volume(/) Trigger(Does Not Exist)This filter checks that the root filesystem ‘/’ is in existence on volume ‘/’. An alert is generated if theroot filesystem ‘/’ is not found on volume ‘/’.Filesystem (/) Inode Used 90% - Group(Filesystem) Volume(/) Type(I-Nodes Used %)Trigger( 90%)This filter checks the percentage Inode used on root filesystem ‘/’. An inode is a data structure inUNIX operating systems that contains important information pertaining to files within a file system.When a file system is created in UNIX, a set amount of inodes are also created. Usually, about 1percent of the total file system disk space is allocated to the inode table. An alert is generated if thepercentage Inode used on root filesystem ‘/’ equals or exceeds 90 percent.Filesystem (/home) Disk Space Used 80% - Group(Filesystem) Volume(/home)Type(UsedPercent) Trigger( 80%)This filter checks that the filesystem ‘/home’ on volume ‘/home’ has more than 20% free spaceavailable at all times. An alert is generated if the available disk space on filesystem ‘/home’ equals orexceeds 80 percent.Filesystem (/home) Does Not Exist - Group(Filesystem) Volume(/home) Trigger(DoesNot Exist)This filter checks that the filesystem ‘/home’ is in existence on volume ‘/home’. An alert is generatedif the root filesystem ‘/home’ is not found on volume ‘/home’.Filesystem (/home) Inode Used 90% - Group(Filesystem) Volume(/home) Type(INodes Used %) Trigger( 90%)This filter checks the percentage Inode used on filesystem ‘/home’. An alert is generated if thepercentage Inode used on root filesystem ‘/home’ equals or exceeds 90 percent. Halcyon – A Division of HelpSystemsPage 15
AIX Monitoring Guidelines – Best PracticeFilesystem (/tmp) Disk Space Used 80% - Group(Filesystem) Volume(/tmp)Type(UsedPercent) Trigger( 80%)This filter checks that the filesystem ‘/tmp’ on volume ‘/tmp’ has more than 20% free space availableat all times. An alert is generated if the available disk space on filesystem ‘/tmp’ equals or exceeds80 percent.Filesystem (/tmp) Does Not Exist - Group(Filesystem) Volume(/tmp) Trigger(Does NotExist)This filter checks that the filesystem ‘/tmp’ is in existence on volume ‘/tmp’. An alert is generated ifthe root filesystem ‘/tmp’ is not found on volume ‘/tmp’.Filesystem (/tmp) Inode Used 90% - Group(Filesystem) Volume(/tmp) Type(I-NodesUsed %) Trigger( 90%)This filter checks the percentage Inode used on filesystem ‘/tmp’. An alert is generated if thepercentage Inode used on root filesystem ‘/tmp’ equals or exceeds 90 percent.Filesystem (/usr) Disk Space Used 80% - Group(Filesystem) Volume(/usr)Type(UsedPercent) Trigger( 80%)This filter checks that the filesystem ‘/usr’ on volume ‘/usr’ has more than 20% free space availableat all times. An alert is generated if the available disk space on filesystem ‘/usr’ equals or exceeds 80percent.Filesystem (/usr) Does Not Exist - Group(Filesystem) Volume(/usr) Trigger(Does NotExist)This filter checks that the filesystem ‘/usr’ is in existence on volume ‘/usr’. An alert is generated ifthe root filesystem ‘/usr’ is not found on volume ‘/usr’.Filesystem (/usr) Inode Used 90% - Group(Filesystem) Volume(/usr) Type(I-NodesUsed %) Trigger( 90%)This filter checks the percentage Inode used on filesystem ‘/usr’. An alert is generated if thepercentage Inode used on root filesystem ‘/usr’ equals or exceeds 90 percent.Filesystem (/var) Disk Space Used 80% - Group(Filesystem) Volume(/var)Type(UsedPercent) Trigger( 80%)This filter checks that the filesystem ‘/var’ on volume ‘/var’ has more than 20% free space availableat all times. An alert is generated if the available disk space on filesystem ‘/var’ equals or exceeds 80percent.Filesystem (/var) Does Not Exist - Group(Filesystem) Volume(/var) Trigger(Does NotExist)This filter checks that the filesystem ‘/var’ is in existence on volume ‘/usr’. An alert is generated ifthe root filesystem ‘/var’ is not found on volume ‘/usr’.Filesystem (/var) Inode Used 90% - Group(Filesystem) Volume(/var) Type(I-NodesUsed %) Trigger( 90%)This filter checks the percentage Inode used on filesystem ‘/var’. An alert is generated if thepercentage Inode used on root filesystem ‘/var’ equals or exceeds 90 percent.Sustained CPU 95% - Group(CPU) CPU(0) Type(Load) Trigger( 95%)This filter checks the sustained usage of the CPU. An alert is generated if the sustained CPU loadexceeds 95% at any one time. Halcyon – A Division of HelpSystemsPage 16
AIX Monitoring Guidelines – Best PracticeAIX Process MonitorThe AIX Process Monitor is used to check that critical processes exist on the system. This monitorcontains the following eight filters:Critical Process (biod) Does Not Exist - Type(Process By Name) Process(biod)Trigger(DoesNotExist)The biod daemon is required on systems that are either mounting (as a client) or exporting (as aserver) filesystems via NFS. This filter checks that the critical process, biod, exists on the system andgenerates an alert if it is not present.Critical Process (cron) Does Not Exist - Type(Process By Name) Process(cron)Trigger(DoesNotExist)The cron daemon runs shell commands at specified dates and times. This filter checks that thecritical process, cron, exists on the system and generates an alert if it is not present.Critical Process (errdemon) Does Not Exist - Type(Process By Name)Process(errdemon) Trigger(DoesNotExist)This critical process starts the error logging daemo
Later in his career he applied those skills to midrange systems such as IBM i and AIX as well as other platforms including Windows and Linux . In his role as Product Manager for Halcyon - A Division of HelpSystems, Ash enjoys finding solutions for challenging IT problems. He has a broad, generalist approach - with deep dives into .
