Transcription
1DuPont Safety Perception SurveySurvey: University of California - Lawrence Berkeley National LabSurvey Date: 18-Oct-10Report: OSFNumber of RespondentsExecutivesManagers/SupervisorsHourly WorkersProfessionalsNo Job Category Selected0104220Total36Report: OSF Created: 17Nov2010 Survey: University of California - Lawrence Berkeley National Lab 2010 Survey DuPont 2010. All rights reserved.
2Many ways to gain insight from the DuPontSafety Perception survey: Read the comments Absolute level of answers Comparison by role: managers, supervisors, workers, andprofessionals Comparison from one time to another (current survey vs.survey taken 2 years ago) Comparison to Benchmark Best Comparison of one location/region/business unit to others Upward comparison within organizational hierarchy: comparelocation to region; region to global; single business tobusiness group; business group to corporate, etc. Comparison to industry average Other demographic comparisons: employees vs. contractors,experienced employees vs. new employees, etc.Report: OSF Created: 17Nov2010 Survey: University of California - Lawrence Berkeley National Lab 2010 Survey DuPont 2010. All rights reserved.
3How to read this reportYour results are indicated in dark blue while our BenchmarkBest scores are shown in light blue. Red, Yellow, and Greenindicators are used throughout the report to indicate thedifference (x in legend below) between your score and thesurvey Benchmark Best score. Green means you are close tothe Benchmark best scoreYellow indicates that improvement is neededRed indicates significant deficiencies for that questionBenchmark BestSurvey Resultxx 1515 - 25x 25Report: OSF Created: 17Nov2010 Survey: University of California - Lawrence Berkeley National Lab 2010 Survey DuPont 2010. All rights reserved.
4How to read this reportWe show the 25th, 50th, and 75th percentiles of the scores of allof the organizations that have taken the DuPont SafetyPerception Survey. Note: the 50th percentile is also known asthe median.This gives you an idea of the distribution of scores for eachquestion and how you compare to not only our Benchmark Best,but also to every organization that has taken the survey.Benchmark BestSurvey Resultx25th 50th 75thpercentilex 1515 - 25x 25Report: OSF Created: 17Nov2010 Survey: University of California - Lawrence Berkeley National Lab 2010 Survey DuPont 2010. All rights reserved.
5Look for differing perceptions among the jobcategoriesFew workers andprofessionals believethat all injuries can beprevented.Workers less involved insafety activities comparedto supervisors andmanagers.Report: OSF Created: 17Nov2010 Survey: University of California - Lawrence Berkeley National Lab 2010 Survey DuPont 2010. All rights reserved.
6How to read this reportTo summarize each question we add the percentage ofrespondents that chose either the first choice or first two choices.The choice or choices to be added are marked with a Indicates the first twochoices are used forthis questionReport: OSF Created: 17Nov2010 Survey: University of California - Lawrence Berkeley National Lab 2010 Survey DuPont 2010. All rights reserved.
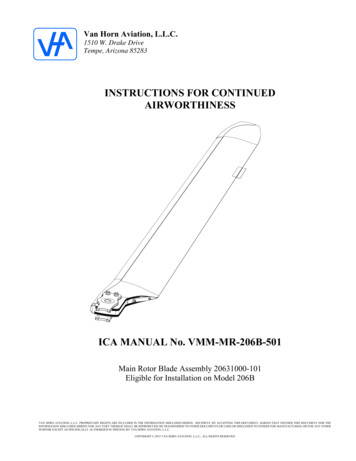
7Question 2: Indicate the priority that others give to safety.Percent of respondents that said others ranked safety first:SurveyScore%0%A 88% of managers say theythemselves give safety toppriority while 51% of workersthink managers give safety toppriority.B 94% of supervisors say theythemselves give safety topBenchmark priority while 62% of hourlyBestworkers think supervisors givesafety top priority%100%All Respondents7391ManagersSupervisorsHourly WorkersProfessionals8398627091919191C 87% of workers say theythemselves give safety toppriority while only 74% ofworkers say that other workersgive safety top priorityThese are perception gaps.All ResponsesManagersPercent of Respondents:SelvesManagers Supervisors Hourly Workers All unt of Responses Above:816 Indicates what response or responses are grouped together for Benchmarking.HourlyWorkers%87C51 A62 96872797385Take the time to review and understand this bottom table for Question 2 in your report.You may value safety as top priority but how does your organization perceive this?Report: OSF Created: 17Nov2010 Survey: University of California - Lawrence Berkeley National Lab 2010 Survey DuPont 2010. All rights reserved.
8Benchmark Best SitesOur Benchmark Best sites are manufacturing sites in the oil, textile,electrical, and chemical industries. To be considered BenchmarkBest, a site must meet the following size and safety performancecriteria: 160 employees at the location and had a statistically significantsurvey response rate No employee or contractor fatalities in the last 5 years 5 year employee LWIFR 0.25 with no single year employeeLWIFR 0.50. LWIFR is based on 200,000 hours. 5 year employee TRIFR 1.00. TRIFR is based on 200,000 hours.On-site assessments by DSR are required to verify that their SafetyLeadership, Structure, and Processes and Actions are World Class.Report: OSF Created: 17Nov2010 Survey: University of California - Lawrence Berkeley National Lab 2010 Survey DuPont 2010. All rights reserved.
9Job Category DefinitionsExecutive — Scientific and Operations Division Directors, LaboratoryCounsel, Associate Laboratory Directors, Deputy Lab Director, andLab Director.Manager/Supervisor — Those who provide formal supervision toothers — e.g. Division Deputies, Department Heads, Group Leaders,PI’s, Center Directors, Business Managers, Line Managers.Hourly Worker — Skilled Crafts & Trades, Service, RepresentedTechnicians, Clerical, Research Assistants, Occupational HealthNurse, and Student Assistants.Professional — Scientists & Engineers, Research Professionals,Post Docs, Technical Professionals, Program/Project Managers,Administrative Professionals, HR Professionals, Health & SafetyProfessionals, Finance Professionals, Attorneys, LicensingProfessionals, Internal Audit Professionals, and EngineeringAssociates.Report: OSF Created: 17Nov2010 Survey: University of California - Lawrence Berkeley National Lab 2010 Survey DuPont 2010. All rights reserved.
10Overall Survey Results vs. Benchmark Best, sorted by strengthLeadershipQ6Q7aQ7bQ14Q2Q1Q9aQ3Q19%Extent that safety is built inPresence of safety valuesInfluence of safety valuesExtent safety rules are enforcedPriority respondents think others give to safetyPriority individuals give to safetyInvolvement in safety activitiesBelief that injuries can be preventedRecognition for safety achievementsReport: OSF Created: 17Nov2010 Survey: University of California - Lawrence Berkeley National Lab 2010 Survey DuPont 2010. All rights reserved.
11Overall Survey Results vs. Benchmark Best, sorted by strengthStructureQ13bQ22Q23Q8Q24Q13aQ21Q5Q4%Extent that safety rules are obeyedRating of the safety organizationRating of the safety departmentExtent line management is held accountable for safetySatisfaction with the safety performance of the organizationQuality of safety rulesKnowledge of safety performanceLevel of safety where the cost-benefit break-point occursEffect of a drive for safety on business performanceReport: OSF Created: 17Nov2010 Survey: University of California - Lawrence Berkeley National Lab 2010 Survey DuPont 2010. All rights reserved.
12Overall Survey Results vs. Benchmark Best, sorted by strengthProcesses and oughness in investigation of injuries and incidentsRating of the safety of facilities and equipmentExtent individuals feel empowered to take action in safetyQuality of safety auditsExtent of safety trainingSafety meeting attendanceRating of modified duty and return-to-work systemsQuality and effectiveness of safety meetingsExtent of involvement in safety auditsFrequency of safety meetingsThe presence of off-the-job safety programsReport: OSF Created: 17Nov2010 Survey: University of California - Lawrence Berkeley National Lab 2010 Survey DuPont 2010. All rights reserved.
13Overall Survey Results vs. Benchmark Best, sorted by Q13bQ22Q23Q8Q24Q13aQ21Q5Q4Processes and nt that safety is built inPresence of safety valuesInfluence of safety valuesExtent safety rules are enforcedPriority respondents think others give to safetyPriority individuals give to safetyInvolvement in safety activitiesBelief that injuries can be preventedRecognition for safety achievements%Extent that safety rules are obeyedRating of the safety organizationRating of the safety departmentExtent line management is held accountable for safetySatisfaction with the safety performance of the organizationQuality of safety rulesKnowledge of safety performanceLevel of safety where the cost-benefit break-point occursEffect of a drive for safety on business performance%Thoroughness in investigation of injuries and incidentsRating of the safety of facilities and equipmentExtent individuals feel empowered to take action in safetyQuality of safety auditsExtent of safety trainingSafety meeting attendanceRating of modified duty and return-to-work systemsQuality and effectiveness of safety meetingsExtent of involvement in safety auditsFrequency of safety meetingsThe presence of off-the-job safety programsReport: OSF Created: 17Nov2010 Survey: University of California - Lawrence Berkeley National Lab 2010 Survey DuPont 2010. All rights reserved.
14Overall Survey Results vs. Benchmark Best, sorted by question Q5Q8Q13aQ13bQ21Q22Q23Q24Processes and rity individuals give to safetyPriority respondents think others give to safetyBelief that injuries can be preventedExtent that safety is built inPresence of safety valuesInfluence of safety valuesInvolvement in safety activitiesExtent safety rules are enforcedRecognition for safety achievements%Effect of a drive for safety on business performanceLevel of safety where the cost-benefit break-point occursExtent line management is held accountable for safetyQuality of safety rulesExtent that safety rules are obeyedKnowledge of safety performanceRating of the safety organizationRating of the safety departmentSatisfaction with the safety performance of the organization%Extent individuals feel empowered to take action in safetyExtent of safety trainingFrequency of safety meetingsSafety meeting attendanceQuality and effectiveness of safety meetingsThoroughness in investigation of injuries and incidentsExtent of involvement in safety auditsQuality of safety auditsRating of modified duty and return-to-work systemsThe presence of off-the-job safety programsRating of the safety of facilities and equipmentReport: OSF Created: 17Nov2010 Survey: University of California - Lawrence Berkeley National Lab 2010 Survey DuPont 2010. All rights reserved.
15Survey Results by Job CategoryA: Executives B: Managers/Supervisors C: Hourly Workers D: ProfessionalsABCDLeadershipQ1*Priority individuals give to safetyQ2*Priority respondents think others give to safetyQ3*Belief that injuries can be preventedQ6*Extent that safety is built inQ7a*Presence of safety valuesQ7b*Influence of safety valuesQ9a*Involvement in safety activitiesQ14**Extent safety rules are enforcedQ19*Recognition for safety achievementsABCDStructureQ4*Effect of a drive for safety on business performanceQ5*Level of safety where the cost-benefit break-point occursQ8*Extent line management is held accountable for safetyQ13a*Quality of safety rulesQ13b*Extent that safety rules are obeyedQ21*Knowledge of safety performanceQ22*Rating of the safety organizationQ23*Rating of the safety departmentQ24*Satisfaction with the safety performance of the organizationABCDProcesses and ActionsQ10*Extent individuals feel empowered to take action in safetyQ11*Extent of safety trainingQ12a*Frequency of safety meetingsQ12b*Safety meeting attendanceQ12c*Quality and effectiveness of safety meetingsQ15**Thoroughness in investigation of injuries and incidentsQ16a*Extent of involvement in safety auditsQ16b**Quality of safety auditsQ17**Rating of modified duty and return-to-work systemsQ18*The presence of off-the-job safety programsQ20*Rating of the safety of facilities and equipmentReport: OSF Created: 17Nov2010 Survey: University of California - Lawrence Berkeley National Lab 2010 Survey DuPont 2010. All rights reserved.
16Job Category Comparison: LeadershipPriority individuals give to safety Q1*Priority respondents think others give to safety Q2*Belief that injuries can be prevented Q3*Extent that safety is built in Q6*Presence of safety values Q7a*Influence of safety values Q7b*Involvement in safety activities Q9a*Extent safety rules are enforced Q14*Recognition for safety achievements ly Workers*Professionals*To ensure confidentiality, responses from groups with less than 3 respondents are not shown.Report: OSF Created: 17Nov2010 Survey: University of California - Lawrence Berkeley National Lab 2010 Survey DuPont 2010. All rights reserved.
17Job Category Comparison: StructureEffect of a drive for safety on business performance Q4*Level of safety where the cost-benefit break-point occurs Q5*Extent line management is held accountable for safety Q8*Quality of safety rules Q13a *Extent that safety rules are obeyed Q13b *Knowledge of safety performance Q21*Rating of the safety organization Q22*Rating of the safety department Q23*Satisfaction with the safety performance of the organization ly WorkersProfessionals*To ensure confidentiality, responses from groups with less than 3 respondents are not shown.Report: OSF Created: 17Nov2010 Survey: University of California - Lawrence Berkeley National Lab 2010 Survey DuPont 2010. All rights reserved.
18Job Category Comparison: Processes and ActionsExtent individuals feel empowered to take action in safety Q10*Extent of safety training Q11*Frequency of safety meetings Q12a *Safety meeting attendance Q12b *Quality and effectiveness of safety meetings Q12c *Thoroughness in investigation of injuries and incidents Q15 *Extent of involvement in safety audits Q16a *Quality of safety audits Q16b *Rating of modified duty and return-to-work systems Q17*The presence of off-the-job safety programs Q18*Rating of the safety of facilities and equipment ly Workers*Professionals*To ensure confidentiality, responses from groups with less than 3 respondents are not shown.Report: OSF Created: 17Nov2010 Survey: University of California - Lawrence Berkeley National Lab 2010 Survey DuPont 2010. All rights reserved.
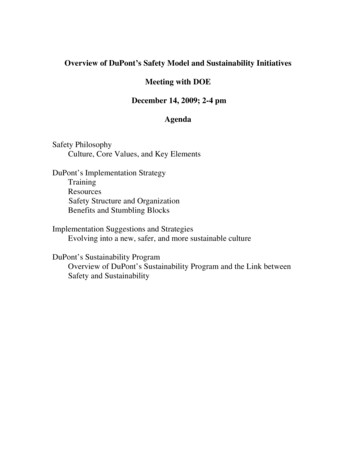
19Survey ComparisonRelative Culture StrengthOverallBenchmark Best 107OSF 49Berkeley National Lab 52World ClassLeadership1114140Structure1085158Processes and Number ofActionsRespondents1025559362,17680Overall Relative Culture Strength is a proprietary score that includes all of the questions from the SafetyPerception Survey. The Leadership, Structure, and Processes and Actions scores are based on questions inthose categories.Report: OSF Created: 17Nov2010 Survey: University of California - Lawrence Berkeley National Lab 2010 Survey DuPont 2010. All rights reserved.
20Survey Comparison: LeadershipPriority individuals give to safety Q1Priority respondents think others give to safety Q2Belief that injuries can be prevented Q3Extent that safety is built in Q6Presence of safety values Q7aInfluence of safety values Q7bInvolvement in safety activities Q9aExtent safety rules are enforced Q14Recognition for safety achievements Q190Benchmark BestOSFBerkeley National LabReport: OSF Created: 17Nov2010 Survey: University of California - Lawrence Berkeley National Lab 2010 Survey DuPont 2010. All rights reserved.2550%75100
21Survey Comparison: StructureEffect of a drive for safety on business performance Q4Level of safety where the cost-benefit break-point occurs Q5Extent line management is held accountable for safety Q8Quality of safety rules Q13aExtent that safety rules are obeyed Q13bKnowledge of safety performance Q21Rating of the safety organization Q22Rating of the safety department Q23Satisfaction with the safety performance of the organization Q240Benchmark BestOSFBerkeley National LabReport: OSF Created: 17Nov2010 Survey: University of California - Lawrence Berkeley National Lab 2010 Survey DuPont 2010. All rights reserved.2550%75100
22Survey Comparison: Processes and ActionsExtent individuals feel empowered to take action in safety Q10Extent of safety training Q11Frequency of safety meetings Q12aSafety meeting attendance Q12bQuality and effectiveness of safety meetings Q12cThoroughness in investigation of injuries and incidents Q15Extent of involvement in safety audits Q16aQuality of safety audits Q16bRating of modified duty and return-to-work systems Q17The presence of off-the-job safety programs Q18Rating of the safety of facilities and equipment Q200Benchmark BestOSFBerkeley National LabReport: OSF Created: 17Nov2010 Survey: University of California - Lawrence Berkeley National Lab 2010 Survey DuPont 2010. All rights reserved.2550%75100
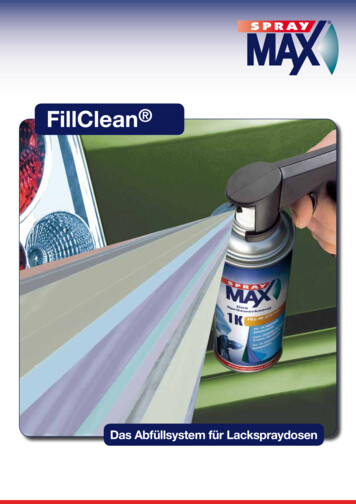
23Question 1: Indicate the priority you personally give to safety.Percent of respondents that ranked safety first:BenchmarkBestSurvey Score%%All y WorkersProfessionals*505045*91939698All ResponsesExecutivesPercent of Respondents:First SecondThirdFourth%****Managers/SuperHourly Workersvisors%%5050405010000Count of Responses Above:010 Indicates what response or responses are grouped together for Benchmarking.* To ensure confidentiality, responses from groups with less than 3 respondents are not shown.Report: OSF Created: 17Nov2010 Survey: University of California - Lawrence Berkeley National Lab 2010 Survey DuPont 2010. All rights reserved.4Professionals%45141823All Respondents%472514142236
24Question 2: Indicate the priority that others give to safety.Percent of respondents that said others ranked safety first:BenchmarkBestSurvey Score%%All y WorkersProfessionals*506757*91919191All ResponsesExecutivesPercent of Respondents:SelvesExecutives Managers/Supervisors Hourly Workers All Respondents%****0Managers/SuperHourly Workersvisors%%50505075507550505067Count of Responses Above:010 Indicates what response or responses are grouped together for Benchmarking.* To ensure confidentiality, responses from groups with less than 3 respondents are not shown.Report: OSF Created: 17Nov2010 Survey: University of California - Lawrence Berkeley National Lab 2010 Survey DuPont 2010. All rights reserved.4Professionals%4567574857All Respondents%47635749562135
25Question 3: To what extent can injuries be prevented?Percent of respondents answering that all injuries can be prevented:BenchmarkBestSurvey Score%%All y WorkersProfessionals*202518*91989396All ResponsesExecutivesPercent of Respondents:All Almost AllManySomeFew%*****Managers/SuperHourly Workersvisors%%2025605020002500Count of Responses Above:010 Indicates what response or responses are grouped together for Benchmarking.* To ensure confidentiality, responses from groups with less than 3 respondents are not shown.Report: OSF Created: 17Nov2010 Survey: University of California - Lawrence Berkeley National Lab 2010 Survey DuPont 2010. All rights reserved.4Professionals%18552700All Respondents%195622302236
26Question 4: How would a strong, long-term effort for safety excellence affect excellence in otherareas, such as quality, productivity, costs, and profits?Percent of respondents answering that the safety effort will be very helpful:BenchmarkBestSurvey Score%%All y WorkersProfessionals*10023*90919095All ResponsesExecutivesPercent of Respondents:Be Very Helpful Provide Some HelpHave No EffectMake It HarderWeaken Our Ability%*****Managers/SuperHourly Workersvisors%%1007075100100025Count of Responses Above:010 Indicates what response or responses are grouped together for Benchmarking.* To ensure confidentiality, responses from groups with less than 3 respondents are not shown.Report: OSF Created: 17Nov2010 Survey: University of California - Lawrence Berkeley National Lab 2010 Survey DuPont 2010. All rights reserved.4Professionals%232327235All Respondents%1742191762236
27Question 5: At what point does safety improvement cost more than the economic benefits itprovides? (Possible economic benefits of safety are reduced costs of injuries and lost workingtime, better morale and product quality, improved production, etc.)Percent of respondents answering that within reason there is no limit:BenchmarkBestSurvey Score%%All y WorkersProfessionals*105018*100899490All ResponsesExecutivesPercent of Respondents:No Limit Excellent SafetyGood SafetyAverage SafetyAlways A Net Cost%*****Managers/SuperHourly Workersvisors%%10507025100100025Count of Responses Above:010 Indicates what response or responses are grouped together for Benchmarking.* To ensure confidentiality, responses from groups with less than 3 respondents are not shown.Report: OSF Created: 17Nov2010 Survey: University of California - Lawrence Berkeley National Lab 2010 Survey DuPont 2010. All rights reserved.4Professionals%18453205All Respondents%195022362236
28Question 6: To what extent in your organization is safety an integral part of equipment and facilitydesign, operating practices, and job training-not something that is added later?Percent of respondents answering that safety is thoroughly or substantially built in:BenchmarkBestSurvey Score%%All ly WorkersProfessionals*9010082*100100100100All ResponsesExecutivesPercent of Respondents:Thoroughly Substantially Some IntegrationLittle IntegrationNo Integration%*****Managers/SuperHourly Workersvisors%%401005001000000Count of Responses Above:010"I Don't Know" Responses Excluded:00 Indicates what response or responses are grouped together for Benchmarking.* To ensure confidentiality, responses from groups with less than 3 respondents are not shown.Report: OSF Created: 17Nov2010 Survey: University of California - Lawrence Berkeley National Lab 2010 Survey DuPont 2010. All rights reserved.40Professionals%18641450All Respondents%33531130220360
29Question 7a: Does your organization have well-established, readily available, written safety values(beliefs and principles)?Percent of respondents answering that safety values do exist:BenchmarkBestSurvey Score%%All y WorkersProfessionals*7010077*10010098100All ResponsesExecutivesPercent of Respondents:Yes NoDon't Know%***Managers/SuperHourly Workersvisors%%70100200100Count of Responses Above:010 Indicates what response or responses are grouped together for Benchmarking.* To ensure confidentiality, responses from groups with less than 3 respondents are not shown.Report: OSF Created: 17Nov2010 Survey: University of California - Lawrence Berkeley National Lab 2010 Survey DuPont 2010. All rights reserved.4Professionals%77023All Respondents%786172236
30Question 7b: Check the statement below that best describes your organization's written safetyvalues.Percent of respondents who describe current written safety values as influential:BenchmarkBestSurvey Score%%All ly WorkersProfessionals*865076*100100100100All ResponsesExecutivesPercent of Respondents:Are Up-to-date and Influential Have Some InfluenceHave Little or No Influence%***Managers/SuperHourly Workersvisors%%8650145000Count of Responses Above:07 Indicates what response or responses are grouped together for Benchmarking.* To ensure confidentiality, responses from groups with less than 3 respondents are not shown.Report: OSF Created: 17Nov2010 Survey: University of California - Lawrence Berkeley National Lab 2010 Survey DuPont 2010. All rights reserved.4Professionals%76240All Respondents%752501728
31Question 8: Respond to this statement: "In my organization, supervisors and managers are heldaccountable for preventing injuries and safety incidents in their area, and safety performance has adirect effect on their performance rating, advancement, and pay.”Percent of respondents who strongly agree or agree that managers and supervisors are heldaccountable:BenchmarkBestSurvey Score%%All y WorkersProfessionals*6010068*951009391All ResponsesExecutivesPercent of Respondents:Strongly Agree Agree NeutralDisagreeStrongly Disagree%*****Managers/SuperHourly Workersvisors%%407520254000000Count of Responses Above:010"I Don't Know" Responses Excluded:00 Indicates what response or responses are grouped together for Benchmarking.* To ensure confidentiality, responses from groups with less than 3 respondents are not shown.Report: OSF Created: 17Nov2010 Survey: University of California - Lawrence Berkeley National Lab 2010 Survey DuPont 2010. All rights reserved.40Professionals%16532650All Respondents%30392730193333
32Question 9a: In the past year, how active were you in safety improvement activities such as servingon a committee, participating in an incident investigation, or helping put together safety rules?Percent of respondents who say they are deeply or quite involved in safety activities:BenchmarkBestSurvey Score%%All y WorkersProfessionals*5005*89806843All ResponsesExecutivesPercent of Respondents:Deeply Quite ModeratelyNot Very MuchNot At All%*****Managers/SuperHourly Workersvisors%%40010020020251075Count of Responses Above:010 Indicates what response or responses are grouped together for Benchmarking.* To ensure confidentiality, responses from groups with less than 3 respondents are not shown.Report: OSF Created: 17Nov2010 Survey: University of California - Lawrence Berkeley National Lab 2010 Survey DuPont 2010. All rights reserved.4Professionals%0553655All Respondents%116831442236
33Question 9b: In the last two years, have you participated in a safety committee or task team? Forexample, a site safety and health committee, rules/procedures committee, safe driving committee,or a task force to review area safety rules.Percent of respondents answering that they are involved in a safety committee or team:BenchmarkBestSurvey Score%%All y WorkersProfessionals*40259*100956786All ResponsesExecutivesPercent of Respondents:Yes No%**Managers/SuperHourly Workersvisors%%40256075Count of Responses Above:010 Indicates what response or responses are grouped together for Benchmarking.* To ensure confidentiality, responses from groups with less than 3 respondents are not shown.Report: OSF Created: 17Nov2010 Survey: University of California - Lawrence Berkeley National Lab 2010 Survey DuPont 2010. All rights reserved.4Professionals%991All Respondents%19812236
34Question 10: To what extent do you feel empowered and expected to take action to prevent injuriesand ensure the safety of yourself and others? This includes stopping work, shutting downequipment, and making suggestions or taking steps to fix the safety of the job, knowing that you’llbe supported by your supervision for your action.Percent of respondents answering who feel fully or quite empowered:BenchmarkBestSurvey Score%%All y WorkersProfessionals*1007577*10010094100All ResponsesExecutivesPercent of Respondents:Fully Empowered Quite Empowered Moderately EmpoweredNot Very EmpoweredNot At All Empowered%*****Managers/SuperHourly Workersvisors%%90751000250000Count of Responses Above:010 Indicates what response or responses are grouped together for Benchmarking.* To ensure confidentiality, responses from groups with less than 3 respondents are not shown.Report: OSF Created: 17Nov2010 Survey: University of California - Lawrence Berkeley National Lab 2010 Survey DuPont 2010. All rights reserved.4Professionals%36411490All Respondents%562811602236
35Question 11: How much formal, structured training have you received in safety and occupationalhealth in the last two years?Percent of respondents who say their training has been extensive or considerable:BenchmarkBestSurvey Score%%All y WorkersProfessionals*6010064*947094100All ResponsesExecutivesPercent of Respondents:Extensive Considerable SomeLittleNone%*****Managers/SuperHourly Workersvisors%%2050405030010000Count of Responses Above:010 Indicates what response or responses are grouped together for Benchmarking.* To ensure confidentiality, responses from groups with less than 3 respondents are not shown.Report: OSF Created: 17Nov2010 Survey: University of California - Lawrence Berkeley National Lab 2010 Survey DuPont 2010. All rights reserved.4Professionals%27363250All Respondents%283928602236
36Question 12a: How often are safety meetings held in your workplace?Percent of respondents who say safety meetings are held weekly, bi-weekly, or monthly:BenchmarkBestSurvey Score%%All ly WorkersProfessionals*505023*100100100100All ResponsesExecutivesPercent of Respondents:Weekly or Every Two Weeks Monthly Every Two MonthsLess Than Every Two MonthsNever%*****Managers/SuperHourly Workersvisors%%105040020251025200Count of Responses Above:010 Indicates what response or responses are grouped together for Benchmarking.* To ensure confidentiality, responses from
Overall Survey Results vs. Benchmark Best, sorted by strength Structure % Q13b Extent that safety rules are obeyed Q22 Rating of the safety organization Q23 Rating of the safety department Q8 Extent line management is held accountable for safety Q24 Satisfaction with the safety performance of the organization Q13a Quality of safety rules