Transcription
BCABUILDINGENERGYBENCHMARKINGREPORT 2014Overview20Data Analysisand EnergyBenchmarking28Top 10CommercialBuildings35Green Buildings:Making BusinessSense41
ContentCEO’s MessageExecutive SummarySingapore’s Built Environment: A SnapshotLegislation for Existing BuildingsOverviewData Analysis and Energy BenchmarkingTop 10 Commercial BuildingsGreen Buildings: Making Business SenseGreening of Singapore’s Building StockKey Observations and Conclusion341417202835415153Appendix A: Data Verification MethodologyGlossary5758AcknowledgementsThis inaugural Building Energy Benchmarking Report 2014 is published by the Building and Construction Authority (BCA) of Singapore toshare analytical findings from the 2013 building energy benchmarking data. The building information and energy consumption data werecollated from the annual mandatory submission of building information and energy consumption data, a new key requirement under theBuilding Control (Amendment) Act 2012. A panel of technical consultative members comprising representatives from the government,industry and academia, were engaged for their feedback on this report.We would like to express our gratitude to the members of the Technical Consultative Panel for their valuable insights:Chairman:Mr. Lam Siew Wah [Deputy CEO, Industry Development, BCA]Panel Members:Mr. Tan Tian Chong [Group Director, Technology Development Group, BCA] Mr. Ang Kian Seng [Group Director, Research Group, BCA]Mr. Ho Hiang Kwee [Lead Technologist, National Climate Change Secretariat, Prime Minister Office] Prof. Lee Siew Eang [AssociateProfessor, Department of Building, School of Design & Environment, National University of Singapore] Er. Ng Eng Kiong [President,Singapore Green Building Council and Managing Director, Squire Mech Pte Ltd] Mr. Kenneth Foo [Past President, International FacilitiesManagement Association] Mr. Tan Keng Chiam [Regional Director and Head of Valuation Advisory Services, Jones Lang Lasalle PropertyConsultants Pte Ltd]And with contributions from various BCA departments:Technology Development Group – Green Building Policy DepartmentSerene Peh [Director] Vinna Tan [Senior Manager] Choo See Loke [Executive Manager] Jeremy Hong [Executive Manager]Technology Development Group – Green Mark DepartmentLeong-Kok Su Ming [Director] Toh Eng Shyan [Director] Thomas Pang [Senior Manager] Kong Jia Hng [Senior Manager] Leow Yock Keng [Senior Manager] Benjamin Huang [Executive Manager] Lim San Teng [Executive Manager] Wee Kai Siong [Executive Manger]Corporate Development Group – Corporate Communication DepartmentLeong Ee Leng [Director] Letchimi d/o Palanisamy [Senior Communications Manager] Kong Yuqi [Senior Communications Manager] Peggy Lee [Executive Communications Manager]BCA Building Energy Benchmarking Report 2014 Building and Construction AuthorityAll rights reserved. No part of this publication may be reproduced in any material form (including photocopying or storing it in any medium by electronic meansand whether or not transiently or incidentally to some other use of this publication), republished, uploaded, posted, transmitted or otherwise distributed in anyway without the prior written permission of the copyright holder, application of which should be addressed to the Green Building Policy Department, Buildingand Construction Authority, 5 Maxwell Road, #16-00 Tower Block MND Complex, Singapore 069110 or emailed to bca enquiry@bca.gov.sg.
CEO’SMESSAGEClimate change has caused extreme weather conditions to be experiencedworldwide. We all have a role to play in mitigating climate change by reducingcarbon emissions. Singapore’s building sector consumes up to 38% of the nation’selectricity. With a focus on addressing the environmental impact caused bybuildings, the Building and Construction Authority (BCA) of Singapore formulatesand charts green building policies to track and improve the energy efficiency ofthe built environment in Singapore under our Green Building Masterplan. Thesepolicies have met with much success, helping to trigger a green movement in thebuilt environment sector, not just in Singapore, but also the region.Riding on this green wave, we rolled out our landmark legislation for existingbuildings under the Building Control Act in Dec 2012, to mandate environmentalsustainability standards and monitor the overall energy performance of ourbuilding stock. For a start we targeted the commercial building stock comprisingoffices, hotels, retail buildings and mixed developments as they are the higherenergy consumers within the building sector. Building owners are required tosubmit their buildings’ information and energy consumption data annuallythrough our online submission portal, Building Energy Submission System(BESS) since 1 July 2013. The submitted data is analysed to better understandthe commercial buildings’ energy consumption trends and help shape policies toimprove building energy efficiency going forward.In this inaugural publication, we are sharing highlights of the findings drawn fromthe first year’s data collected by BESS. With the building energy benchmarks,building owners will now be able to compare their buildings’ performancesagainst similar building types and proactively improve their buildings’ energyefficiency. This report will be focusing on electricity consumption of commercialbuildings. The Energy Utilisation Index (EUI) of commercial buildings hasimproved over the years based on analysed trending. The EUI data also showthat Green Mark commercial buildings are more energy efficient than nonGreen Mark commercial buildings. With this on track, focus has now shifted tobuilding occupants and tenants as data showed their contribution to be 50% ofthe total electricity consumption in the buildings. In addition, we are profilingthe top 10 better energy performers of each commercial building category toshowcase building owners’ efforts in advocating and adopting green practicesin their buildings, and to highlight the strong business case and energy savingspotential for green buildings.With the enabling strategies under our Green Building Masterplans, andcontinuous monitoring of the buildings’ energy efficiency. I am confident that weare on track to achieve our national target of greening 80% of Singapore’sbuilding stock by 2030, and sustaining a low carbon, high quality builtenvironment for everyone.Dr. John KeungChief Executive OfficerBCA BUILDING ENERGY BENCHMARKING REPORT 2014 // 3
EXECUTIVESUMMARYThis inaugural issue of the BCA Building EnergyBenchmarking Report is a new milestone in BCA’sunrelenting drive to enhance Singapore’s energyresilience and achieve the national target of greeningof 80% of the country’s building stock by 2030.The Building Control (Amendment) Act 2012provides the means for BCA to collect and analysebuilding information and energy consumption datawhich forms the basis for energy consumptionmonitoring and national benchmarking forbuildings in Singapore.The information provided is intended to spurstakeholders at all levels to initiate and implementimprovements in building energy efficiency,indvidually or collectively.BCA BUILDING ENERGY BENCHMARKING REPORT 2014 // 4
Why Singapore NeedsBuilding Energy BenchmarkingThe national building energy benchmarks provided in thisinaugural report will benefit key stakeholders in many ways:TheGovernment means tomonitor energyconsumptionand efficiency ofbuildings insights toformulatemeasures toreduce theimpact ofbuildings on theenvironmentBuildingOwners,FacilitiesManagers &Tenants awareness ofthe energyperformances oftheir buildingsConsultants& Designers new ideas,designs andbest practicesin designing/retrofitting agreen building information totake necessarysteps to improveenergy efficiencyof buildingsBCA BUILDING ENERGY BENCHMARKING REPORT 2014 // 5Research &EducationCommunities research andstudies usingshared datato furtheradvance greenbuildingtechnologiesand solutionsfor the future
Implementation of Legislation:A Concerted Effort to SuccessIn December 2012, a new legislation for existing buildings was enacted. One of the requirements mandatedbuilding owners to complete the annual submission of their building information and energy consumptiondata through BCA’s online submission portal, Building Energy Submission System (BESS). For thefirst year, commercial buildings consisting of offices, hotels, retail buildings and mixed developmentswere targeted to complete the submission. The overall period of submission was between 1 July and31 December 2013. In addition, BCA supported with extensive public outreach efforts to drive submissions.User SubmissionManualTechnical GuideBuildingEnergySubmissionSystem(BESS)Training VideoOne-to-oneConsultationsPublic BannersDemo VideoNotice Letterand CircularPublicOutreachEffortsTelephone andEmail SupportIndustry BriefingSessionsExhibitionOperational Challenges FacedTo address the challenge of securing credible and quality data, energy consumption data wereobtained directly from utilities suppliers, while building information was furnished by buildingowners. The following were some of the challenges encountered during the process: Lack of informative system-generated reports for building owners and policy makers by BESSBuilding owners’ unfamiliarity with the information required by legislationBuilding owners’ oversight leading to data entry error in the submissionInadequate knowledge of terminology used for technical fields in BESS submission formLack of up-to-date contact information of targeted building ownersBESS performed optimally throughout the first year of submission with data smoothly extracted for thepurpose of analysis. Moving forward, the system will be enhanced to improve the submission processand the quality of data submitted by the building owners through more engagement and education.BCA BUILDING ENERGY BENCHMARKING REPORT 2014 // 6
Key Findings and ObservationsSubmission Compliance Rate:99%Number of Buildings Included In This Report884Existing buildingsEquivalent to 92% compliance as of 31 December 2013Commercial Buildings Gross Floor Area (GFA)52% 16% Type of Air-conditioning Systems UsedGeneral Electricity Consumption Patterns Larger commercial buildings with 15,000 m2 ofGFA commonly used the water cooled chilledwater plants air-conditioning system due to itshigh load capacity and good efficiency Between 2008 and 2013, there was a yearlyincrease in electricity consumption forcommercial buildings. This increase waslargely attributed to the increase in thecommercial building stock, as the rate of GFAgrowth was higher at 20% in comparison to theincrease in total annual electricity consumptionat 14% over the five-year period. Smaller buildings (GFA 15,000 m2) generallypreferred split-units or unitary air-conditionersdue to their lower cooling demand and greateroccupant control over the operation of theair-conditioning system Energy utilisation index (EUI) has also improvedby 5% over the five-year period, attributed to theenergy efficiency improvement works conductedby 279 commercial buildings. Tenants of commercial buildings are significantelectricity consumers, consuming as much astheir building ownersBCA BUILDING ENERGY BENCHMARKING REPORT 2014 // 7
National Building Energy BenchmarksEnergy Utilisation Index (EUI) of Commercial Buildings Among the four main commercial building types, retail buildings recorded the highest median EUI at405 kWh/m2.yr. This could be attributed to the wide variety of tenant mix and the design concept ofretail shops, which require higher lux levels to enhance the appeal of their products. Hotels recorded a lower median EUI at 292 kWh/m2.yr. Compared to retail buildings, hotels demand alower cooling load due to the lower human density and stable occupancy rate within its premises. Offices had the lowest median EUI at 218 kWh/m2.yr. This low EUI was due to shorter operating hours andstable operations with a fairly fixed occupancy rate.Commercial Buildings Median EUI (kWh/m2.yr)218 292 405 e table below shows four quartiles of the range of EUIs obtained for the four major building types gatheredfrom the 783 commercial developments that were benchmarked. This information allows building owners toevaluate their buildings’ energy performance.EUI by Building Type(kWh/m2.yr)Top Quartile(1%-25%)2nd Quartile(26%-50%)3rd Quartile(51%-75%)Bottom Quartile(76%-100%)Offices164164 - 218218 - 280 280Hotels232232 - 292292 - 359 359Retail Buildings259259 - 405405 - 554 554Mixed Developments212212 - 264264 - 357 357BCA BUILDING ENERGY BENCHMARKING REPORT 2014 // 8
Green Mark Commercial Buildings Perform Better Than NonGreen Mark Commercial Buildings The average EUI of Green Mark commercial buildings was lower than theaverage EUI of similar non-Green Mark commercial buildings.Green MarkCommercialBuildingsare moreenergyefficientthan nonGreen MarkBuildings. The average EUI of Green Mark commercial buildings ranged from 16%lower for offices, to 7% lower for retail buildings and 5% lower for hotels.Average EUI Comparison Chart7%5%16%271 228309 295527 492OfficesHotelsRetail BuildingsNon-Green MarkBCA BUILDING ENERGY BENCHMARKING REPORT 2014 // 9Green Mark
Case Studies:Four Green Mark Commercial BuildingsOut of the top 10 commercial buildings, four Green Markbuildings were identified as case studies for this report.The case studies focus on the adoption of energy efficient(EE) solutions and the economic benefits reaped through itsenergy savings.Health PromotionMapletreeBoard HQBusiness CityBuilding NameNovotelSingaporeClarke QuayInternationalPlazaType of UsePublic OfficePrivate OfficeHotelMixedDevelopmentYears inOperation1843138Green MarkPlatinumGreen MarkPlatinum(re-certification)Green MarkGoldPLUSGreen MarkGoldPLUSGFA 15,007Years to RecoupEE Costs7.26.4Tapped intoBCA’s GreenMark IncentiveScheme forExistingBuildings(GMIS-EB) toenjoy fundingsupport for theenergy efficientretrofitsTapped intoGMIS-EB toreplace theirchillers withmore energyefficient onesProject gy Savingsgreen buildingProject (GESP),design andan initiative undergood operationalthe Public SectorpracticesTaking the Leadin EnvironmentalDemonstratedSustainabilitycollective effort(PSTLES)betweenprogramme, toMapletree andimprove theoffice occupantsbuilding’s energyin maintainingefficiencyoptimal buildingenergy efficiencyBCA BUILDING ENERGY BENCHMARKING REPORT 2014 // 10
Singapore’s Green Buildings: The Journey Thus FarIn recent years, there has been a higher take-up rate for Green Mark buildings locally.Here are the facts and figures:60%average year-onyear growth from2008 to 201390%approximatedoverseas Green Markprojects in Malaysia,China, Indonesiaand Vietnam. 25%national targetachieved to dateof ‘greening’ 80%of Singapore’sbuilding stock 2,100buildings(GFA 62 million m2)awarded GreenMark certificationto dateBCA BUILDING ENERGY BENCHMARKING REPORT 2014 // 11 250overseas projectsapplied for GreenMark certificationfrom 2005 toJuly 2014
Key Challenges to Meet the National Target ofGreening 80% by 2030Although it is well established that retrofitting buildings for higherEE results in increased capital value of the property, and that savingsachieved after the retrofits could pay off the cost of the projects typicallyin three to eight years, key barriers include:(i) Competing uses of capitalBuilding owners could have non-energy efficiency related projects that achieve higher rates of returnthan that of energy efficient projects, consequently placing less priority on improving the buildings’ EE.This may deter building owners from utilising capital to green their buildings.(ii) High upfront costsWithout legislation and financial incentives, building owners are more unlikely to bring forward EEretrofitting works. They are still reluctant to take up loans for EE projects due to the impact of loans ontheir balance sheets. With this, the momentum of EE improvement is expected to slow down andeventually even hit a plateau.(iii) Principal-agent issuesPrincipal-agent problems arising from the split incentives between building owners and their managingagents are still preventing building owners, in particular, the Management Corporation Strata Title(MCST) and Small and Medium Enterprises (SMEs) from undertaking EE retrofits for existing buildings.(iv) Entrenched business values and behavioursDeep behavioural adjustments of building occupants and tenants, and changes in business processesare required to achieve more energy reduction over time.Solutions & Strategies(i)Review standards and legislations to raise EE levels(ii) Extend incentive schemes and create innovative financing schemesto help businesses undertake EE retrofits(iii) Drive concerted research and development efforts to test-bed newtechnologies, business models and solutions for the tropics(iv) Step up capability development initiatives(v) Raise awareness of the importance of sustainable energyconsumption behaviourBCA BUILDING ENERGY BENCHMARKING REPORT 2014 // 12
The Road AheadOur TargetGreening 80% of Singapore’s building stock by 2030Leading The Way: Singapore’s Green Building MasterplanBCA’s 3rd Green Building Masterplan provides the blueprint of outlining our vision to make Singaporea global leader in green buildings with special expertise in the tropics and sub-tropics, enabling sustainabledevelopment and quality living.The latest Green Building Masterplan is anchored on three strategic goals:1) Lead - to uphold and advance Singapore’s leadership in green buildings2) Engage - to engage public and private stakeholders in the green movement3) Sustain - to address information gap by measuring and monitoring building performanceThese goals can be achieved through a suite of measures, such as collecting data and sharing informationwith industry, disclosing energy performance of buildings, and enhancing current financing schemes toencourage building owners to adopt green retrofits.What’s Next?Going forward, BCA will continue to focuson monitoring commercial buildings’ energyperformance due to its significant electricity usage. The annual mandatory submission will beexpanded to other building types such asinstitutions and healthcare in the next phase New 50 million Green Mark Incentive Scheme forExisting Buildings and Premises (GMIS-EBP) toencourage building owners and tenants to adopt ofEE improvements within their buildings and premises. Greater emphasis will be placed on the tenants’consumption through the existing occupant centricGreen Mark schemes and green partnershipsBCA BUILDING ENERGY BENCHMARKING REPORT 2014 // 13
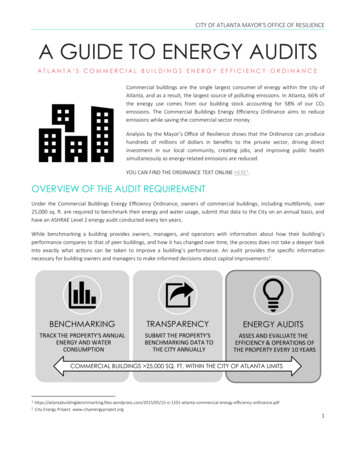
SINGAPORE’SBUILTENVIRONMENT:A SNAPSHOTSingapore’s Commercial Building StockSingapore is a city state with a population of 5.4 million and a total land area of about 716 km2. Energyefficiency is an integral part of the country’s policy planning. An Inter-Ministerial Committee onSustainable Development (IMCSD) was set up in 2008 to:1. formulate a national strategy for Singapore’s sustainable development, and2. manage the growing energy demands of the built environmentIn 2009, IMCSD set a national target to green at least 80% of Singapore’s building stock by 2030.The country’s high temperature (between 25 C and 33 C) and relative humidity (mean value of 84%)has resulted in a high demand for air-conditioning in commercial buildings to provide optimal thermalcomfort for building occupants.Given the need for more cooling, commercial buildings are thus the higher energy consumers withinthe building sector, taking up about 38% of the nation’s total electricity consumption in 2012.Therefore, there is a greater need to first focus on the energy efficiency of commercial buildings.BCA BUILDING ENERGY BENCHMARKING REPORT 2014 // 14
Singapore Total Electricity Consumptionfor Year rial-related40%Commerce andServices-related38%Source: Energy Market Authority, Singapore Energy Statistics 2013BackgroundThe 1st and 2nd Green Building Masterplans were rolled out by BCA to stimulate the growth of the nation’sgreen building stock. They included a comprehensive suite of initiatives, comprising policy levers, guidelinesand standards as well as incentives for the development of green buildings. With these efforts, the stock ofgreen buildings jumped from 33 in 2006 to over 2,100 in July 2014.Riding on the earlier successful implementation of the various green building initiatives, the 3rd GreenBuilding Masterplan was developed with a vision to develop Singapore as“A global leader in green buildingswith special expertise in the tropicsand sub-tropics, enabling sustainabledevelopment and quality living”.BCA BUILDING ENERGY BENCHMARKING REPORT 2014 // 15
The 3rd Green Building MasterplanResearch,Development oliciesExternalInfluence &CollaborationHigherGreen MarkStandardsLeadA global leader ingreen gewith special expertise inthe tropics and sub-tropics,enabling sustainabledevelopment andquality entThree Key Strategic GoalsThe 3rd Green Building Masterplan has been structured to focus on three key strategic goals:LeadBuilds on BCA’s continual leadership and support of the green buildingadvancement in the region.EngageFocuses on the Government taking a greater lead in championing change, withemphasis on collaborative efforts to raise community involvement.SustainMonitors energy consumption, demonstrates building energy performance,shares relevant information to ensure continued building energy compliance tohigher standards, improving the quality of the built environment and occupantwell-being.BCA BUILDING ENERGY BENCHMARKING REPORT 2014 // 16
ission of BuildingInformation and EnergyConsumption DataEffective July 2013, one keyrequirement under BCA’s legislationfor existing buildings mandatesbuilding owners to participatein the Annual Submission ofBuilding Information and EnergyConsumption Data (under Section22FJ of the Building ControlAmendment Act 2012).Data collection was carried out instages, starting with commercialbuildings for offices, hotels, retailbuildings and mixed developments.BCA BUILDING ENERGY BENCHMARKING REPORT 2014 // 17
Building Energy Submission System (BESS)BESS provides the seamless submission process to enable building owners to submit the requiredinformation online conveniently. For the first year, building owners are required to provide all necessary information. For subsequent years, building owners are only required to update their building information onlineannually, if there are changes. BESS streamlines the online submission process by extracting the previous year’s monthly electricityconsumption data of targeted buildings directly from utility suppliers.www.bca.gov.sg/bessBCA BUILDING ENERGY BENCHMARKING REPORT 2014 // 18
Public Outreach EffortsExtensive communication platforms were established to reach out to key stakeholders so as to ensuresuccessful implementation of the nation-wide data collection exercise. Outreach efforts included: A series of industry briefing sessions to share the objectives and processes of theannual mandatory submission with building owners (BO) and their building submissionrepresentations (BSR) to prepare them for the official submission of data. BSRs includerepresentatives such as the Management Corporation Strata Title (MCST), managingagents and facilities managers. Exhibition booths and information banners were set up at strategic public locations tocreate awareness of the implementation of the new legislation. A training video was also produced to inform BOs on the aims of the landmark legislationand encourage action. The video, together with other self-help tools, were madeavailable under ‘useful links’ at www.bca.gov.sg/bess.Support & AssistanceA dedicated team was mobilised to provide assistance tothe BOs and BSRs through hotlines, emails and one-toone consultations throughout the submission period.Site visits were made where no response was received toensure that the targeted BOs were informed of the newrequirement and took action to complete the submission.BCA BUILDING ENERGY BENCHMARKING REPORT 2014 // 19
OVERVIEWThe TargetAbout 1,000 commercial buildings in Singapore’s building stock were targetedto complete annual mandatory submission from 1 July 2013. 1,000Offices, Hotels, Retail Buildings and Mixed Developments99%*OverallCompliance92% 884BuildingsAnalysed* The full list of submitted commercial buildings can be found nks.aspxBCA BUILDING ENERGY BENCHMARKING REPORT 2014 // 20
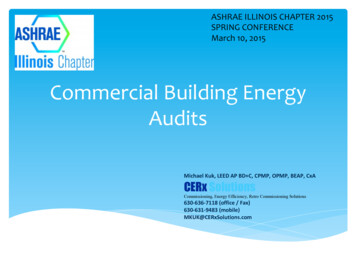
Percentage Breakdown of 884 Commercial Buildings47% 28% 19% al Gross Floor Area (GFA) Recorded At 18.6 million m252% 16% 24% 8%OfficesHotelsRetailBuildingsMixedDevelopmentsBCA BUILDING ENERGY BENCHMARKING REPORT 2014 // 21
Growth of Commercial Building StockThe submitted data revealed that 400 commercial buildings,comprising offices, hotels, retail buildings and mixeddevelopments were constructed between 1980 and 2000, whenthe nation was focusing on driving economic growth.Total No. of Commercial BuildingsNo. of Commercial Buildings by Year of Completion (TOP) & Building Type3,132,0003,401,0004,000,0003,500,0000BCA BUILDING ENERGY BENCHMARKING REPORT 2014 // ,0001,825,0002,500,0001,957,0003,000,000140,000GFA of Commercial Buildings (m2)GFA by Year of Completion (TOP) & Building Type
Type of Air-conditioning Systems UsedInformation on the air-conditioning system and data on the building’s electricity consumption were collectedto better monitor its energy efficiency.Key observations: Generally, larger commercial buildings (GFA 15,000 m2) favoured centralised air-conditioning systems,particularly the water cooled chilled water plants. Smaller commercial buildings (GFA 15,000 m2) preferred split-units and unitary air-conditioning systems. Centralised air-conditioning systems are generally selected when the building has a high coolingdemand with extended but stable operating hours. These are also preferred by the building’s facilitiesmanagement team as they can be controlled and scheduled via a building management or automationsystem. Of the centralised plants, water cooled chilled water plants are typically preferred over air cooledchilled water plants as they are more energy efficient and can maintain their efficiency over time. Split-units and unitary air-conditioning systems are usually chosen for building with uneven coolingdemand as they can be operated individually to give more control flexibility to the occupants of thebuilding. These systems also offer lower capital costs and are less space intensive. They are, however,less energy efficient than central cooling systems.Type of Air-Conditioning System Usage by SizeBCA BUILDING ENERGY BENCHMARKING REPORT 2014 // 23
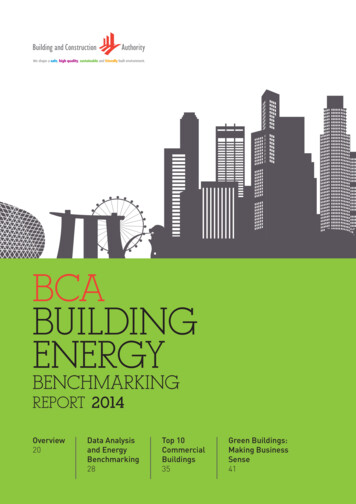
The Findings:Trend of Electricity Consumption for Commercial BuildingsThe total electricity consumption for a commercial building is a critical piece of informationneeded for accurate benchmarking of the building’s energy performance, as electricity is the mainsource of energy for buildings in Singapore. As such, energy utilisation index (EUI) will only focuson electricity consumption. Data collection was a challenge for multi-tenanted buildings as sometenants purchased their own electricity and were separately metered from the landlord’s account.BCA overcame this challenge when it was empowered under section 22FJ of BCA Building ControlAct to secure required data directly with Singapore’s utility providers who could provide extensiveand accurate databases of the total electricity consumption data for whole buildings.Key observations: The total annual electricity consumption has been increasing yearly. This rise appears to have been largely driven by the increase in the number of commercialbuildings over the years, as highlighted in the section “Growth of Commercial Building Stock”. It is noted that the 14% increment for total annual electricity consumption was lower comparedwith the rate of GFA growth of 20% in the five-year period from 2008 to 2013.Total Annual Electricity Consumption (GWh)Total GFA and Annual Electricity ConsumptionTrend of 884 Commercial Buildings10,0009,0008,000GFA has increased 20% fromyear 20087,0006,0005,000Total Annual ElectricityConsumption hasincreased 14% fromyear 20084,0003,0002,0001,0000Annual Electricity ConsumptionGFA of Total Commercial Building Stock(884 buildings)BCA BUILDING ENERGY BENCHMARKING REPORT 2014 // 24
The Findings:Trend of Energy Utilisation Index (EUI) of Commercial BuildingsAn analysis was conducted on the EUI of commercial buildings to study their overall energy performancebetween 2008 and 2013.Key observations: There was a 5% improvement in EUI over the five-year period. This could be attributed to energyefficiency improvements in the buildings. Out of the 884 commercial buildings, 162 are Green Mark buildings, four of which are showcasedunder the “Business Case of Green Buildings” section in this publication. Of the 162 Green Mark buildings, 41 buildings underwent energy efficient retrofits during this fiveyear period and achieved a 16% improvement in EUI. Another 117 non-Green Mark buildings also underwent upgrading and retrofitting of theair-conditioning system (chille
BCA BUILDING ENERGY BENCHMARKING REPORT 2014 //// 4 This inaugural issue of the BCA Building Energy Benchmarking Report is a new milestone in BCA's unrelenting drive to enhance Singapore's energy resilience and achieve the national target of greening of 80% of the country's building stock by 2030. The Building Control (Amendment) Act 2012