Transcription
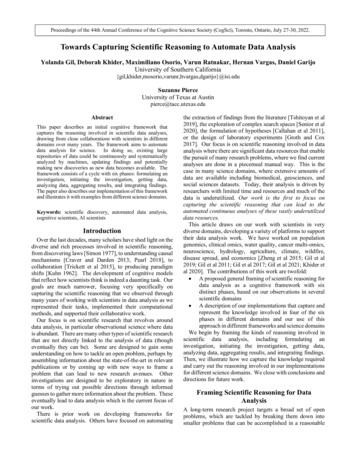
Proceedings of the 44th Annual Conference of the Cognitive Science Society (CogSci), Toronto, Ontario, July 27-30, 2022.Towards Capturing Scientific Reasoning to Automate Data AnalysisYolanda Gil, Deborah Khider, Maximiliano Osorio, Varun Ratnakar, Hernan Vargas, Daniel GarijoUniversity of Southern jo}@isi.eduSuzanne PierceUniversity of Texas at Austinpierce@tacc.utexas.eduAbstractThis paper describes an initial cognitive framework thatcaptures the reasoning involved in scientific data analyses,drawing from close collaborations with scientists in differentdomains over many years. The framework aims to automatedata analysis for science. In doing so, existing largerepositories of data could be continuously and systematicallyanalyzed by machines, updating findings and potentiallymaking new discoveries as new data becomes available. Theframework consists of a cycle with six phases: formulating aninvestigation, initiating the investigation, getting data,analyzing data, aggregating results, and integrating findings.The paper also describes our implementation of this frameworkand illustrates it with examples from different science domains.Keywords: scientific discovery, automated data analysis,cognitive scientists, AI scientistsIntroductionOver the last decades, many scholars have shed light on thediverse and rich processes involved in scientific reasoning,from discovering laws [Simon 1977], to understanding causalmechanisms [Craver and Darden 2013; Pearl 2018], tocollaboration [Trickett et al 2015], to producing paradigmshifts [Kuhn 1962]. The development of cognitive modelsthat reflect how scientists think is indeed a daunting task. Ourgoals are much narrower, focusing very specifically oncapturing the scientific reasoning that we observed throughmany years of working with scientists in data analysis as werepresented their tasks, implemented their computationalmethods, and supported their collaborative work.Our focus is on scientific research that revolves arounddata analysis, in particular observational science where datais abundant. There are many other types of scientific researchthat are not directly linked to the analysis of data (thougheventually they can be). Some are designed to gain someunderstanding on how to tackle an open problem, perhaps byassembling information about the state-of-the-art in relevantpublications or by coming up with new ways to frame aproblem that can lead to new research avenues. Otherinvestigations are designed to be exploratory in nature interms of trying out possible directions through informedguesses to gather more information about the problem. Theseeventually lead to data analysis which is the current focus ofour work.There is prior work on developing frameworks forscientific data analysis. Others have focused on automatingthe extraction of findings from the literature [Tshitoyan et al2019], the exploration of complex search spaces [Senior et al2020], the formulation of hypotheses [Callahan et al 2011],or the design of laboratory experiments [Groth and Cox2017]. Our focus is on scientific reasoning involved in dataanalysis where there are significant data resources that enablethe pursuit of many research problems, where we find currentanalyses are done in a piecemeal manual way. This is thecase in many science domains, where extensive amounts ofdata are available including biomedical, geosciences, andsocial sciences datasets. Today, their analysis is driven byresearchers with limited time and resources and much of thedata is underutilized. Our work is the first to focus oncapturing the scientific reasoning that can lead to theautomated continuous analyses of these vastly underutilizeddata resources.This article draws on our work with scientists in verydiverse domains, developing a variety of platforms to supporttheir data analysis work. We have worked on populationgenomics, clinical omics, water quality, cancer multi-omics,neuroscience, hydrology, agriculture, climate, wildfire,disease spread, and economics [Zheng et al 2015; Gil et al2019; Gil et al 2011; Gil et al 2017; Gil et al 2021; Khider etal 2020]. The contributions of this work are twofold: A proposed general framing of scientific reasoning fordata analysis as a cognitive framework with sixdistinct phases, based on our observations in severalscientific domains A description of our implementations that capture andrepresent the knowledge involved in four of the sixphases in different domains and our use of thisapproach in different frameworks and science domainsWe begin by framing the kinds of reasoning involved inscientific data analysis, including formulating aninvestigation, initiating the investigation, getting data,analyzing data, aggregating results, and integrating findings.Then, we illustrate how we capture the knowledge requiredand carry out the reasoning involved in our implementationsfor different science domains. We close with conclusions anddirections for future work.Framing Scientific Reasoning for DataAnalysisA long-term research project targets a broad set of openproblems, which are tackled by breaking them down intosmaller problems that can be accomplished in a reasonable
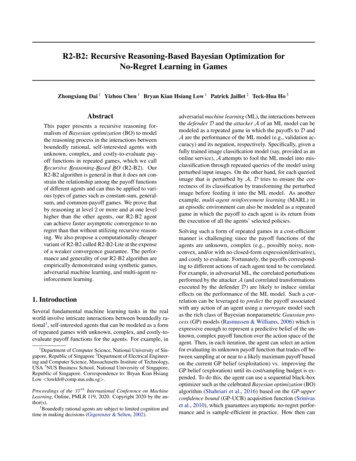
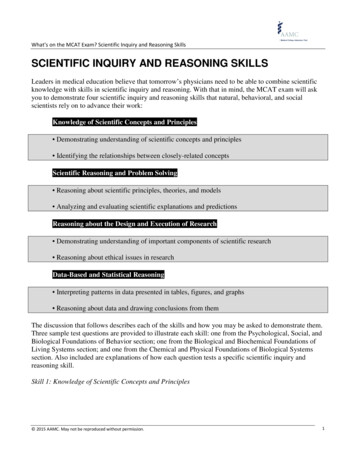
way with whatever resources are available for the project(people, computing, time, data, etc). An open problem isbroken down into subproblems, perhaps creating tasks anddecomposing them in turn into subtasks. Eventually theybecome tractable enough that they prompt specific researchactivities that can be undertaken to reach some conclusiongiven the resources available. Here, we focus on suchactivities and refer to them as investigations. Morespecifically, we consider here investigations that have aconcrete goal that can be accomplished through data analysiswhose results address that aim.Figure 1 shows an overview of the cognitive frameworkthat we have developed and the major phases that we haveidentified. They are described in the rest of this section.QUESTIONI) InitiatingInvestigationElaborateQuestionQUALIFIED QUESTIONII) aCheck Fitto QuestionIntegrate NewData SourceDATASETSSelect generalmethodsIII) GeneratingResultsDesignnovel methodsElaborate andimplementmethodsRun methods andcollect resultsRESULTSIV) SynthesizingFindingsSelect metamethodDesignnovel meta-methodElaborate andimplementmeta-methodPhase I: Initiating InvestigationsThe aim of an investigation is to answer a question, which ismost useful if it is well scoped to be tractable given the timeand resources available. An example of a question that wehave seen in neuroscience is whether the effect of a specificgenotype on the prefrontal cortex size is associated with age.Questions can be posed as testing a hypothesis, which wouldbe a statement that can be supported or dismissed based ondata analysis. For example, in cancer omics we haveanalyzed data to test hypotheses that a particular proteinknown to be associated with colon cancer is present in aspecific colorectal cancer patient sample. Hypotheses can beimplied, but when explicitly declared they are more effectivein guiding the investigation.Sometimes the formulation of questions or hypotheses isitself the aim of an investigation. Scientific endeavors can bearbitrarily complex, and as we mentioned we focus here oninvestigations that can be resolved through data analysis. Wewill consider a question or hypothesis as the starting point.We have noticed general patterns in the types of questionsthat are posed in investigations for any given domain orcontext, and many of these patterns appear across domains.This is not surprising, since statistics, inference, andinduction are general methodologies across sciences.Figure 2 illustrates broad categories of scientific questions.Some questions have to do with associations betweenobserved variables. For example, in neuroscience we can askif a brain characteristic, such as hippocampus size, isassociated with a disorder such as ADHD. Other questionsare concerned with characterizing the data at hand. Forexample, a question posed about a timeseries could bewhether it has seasonality or longer periodicities. There aremany important questions that target a causal understandingof a complex system [Pearl 2018]. These are concerned withchanges in its state over time (due to actions or events) thatlead to other (causally related) changes.Table 2 shows examples of the kinds of questions that ourcollaborating scientists have set out to address.We have found that scientists spend significant timenarrowing down the types of questions that they will focuson. This is a process that can be considered an investigationin itself as we mentioned earlier.AssociationIs X associated with Y?Run meta-method tosynthesize findingsV) IntegratingFindingsFINDINGSKNOWLEDGEVI) FormulateInvestigationFigure 1. A cognitive framework for scientific data analysis.DiagnosticWhat was observed about X given the last few events?InterventionWhat would I observe if I change X?CharacterizationDo X, Y, Z conform to a pattern/function?PrefactualWhat outcome if event E occurs now?SemifactualSame outcome if event E had occurred instead of F?CounterfactualPredictionWhat outcome if event E had not occurred in the past?What future outcome if event E occurs now?BackcastingWhat event G will have future outcome, what E,F before G?PostdictionWhat event E caused F that caused current outcome?Figure 2. Broad categories of scientific questions aboutdynamic systems.
may also take significant effort but is required before anymeaningful data is available for analysis.Table 2. Examples of general types of scientific PrefactualPredictionExampleIs brainCharacteristic associated with neurologicalDisorder in comparison tohealthy controls?Does timeseries have period seasonality?What local areas are subject to frequentflooding?What could be the yield of crop if fertilizerSubsidies are given this year?What would have been the yield of crop ifprecipitation had been number times larger/smaller last year?What plantingWindow could have lead toincreased crop yield this year over last year?Can we expect flooding in area in therainy season this coming year?How will future climateScenarios impact waterResources in region ?Questions can be elaborated by adding qualifiers to narrowdown the scope of the question. In our examples, this mightinvolve selecting a specific time period (e.g., going from“future” to “the next 10 years”), a region (e.g. the Northernside of a river basin), or a threshold (e.g., flooding is definedas water covering the soil by more than 2 inches for more than1 day.). In some cases the qualifiers are determined by theresources available. For example if computational resourcesare limited a smaller time frame will be chosen.Alternatively, questions can be decomposed into furthersubquestions whose results need to be aggregated to answerthe original question. For example, to determine the yield ofa crop for given planting dates one might have to considerdifferent values for fertilizer use. Each possible amount offertilizer that will be considered would result in asubquestion. In this kind of exploration of the solution space,sometimes cast as parameter sweeping, different values of aparameter are tried and then all the results are combined(through an average or some other function) into an answerfor the overall question.In more complex cases, a question can lead to a collectionof subtasks. For example, a question concerning fertilizersubsidies could lead to a subtask to find an agroeconomicmodel that combines agriculture yield predictions withsocioeconomic aspects of the likelihood of uptake offertilizers by farmers based on market prices. Finding such amodel may not be straightforward, and the scientist may needto consider if it is possible to build it given the time and otherresources available. If the question is important and requiresdeveloping new sophisticated models, it may take manymonths to get that subtask done before any data analysis cantake place. Another example is questions concerningflooding or water resources where a preexisting model mayprovide a starting point but needs to be calibrated to adapt itto the region at hand. In those cases, the calibration subtaskPhase II: Getting DataAs we mentioned earlier, for some investigations there aresignificant amounts of data available in shared repositories.In certain cases, simulations or other predictive models canbe used to generate the data needed. But in other cases, thedata is already preselected and is the center of theinvestigation. We discuss each situation in this section.Preselected Data Sometimes a question is posed about aspecific dataset that is provided along with the question. Inthose cases, there may be subtasks concerning whether thedataset is right for the question asked.Although there may be no need to seek out data, it maystill be useful to still try to find relevant data and alert thescientist that other data is available that they are not aware of.Retrieving Data Given a question that can be addressed withavailable datasets, the investigation proceeds by retrievingthe relevant data. When using data repositories, this involvesmapping each question to a query that describes the relevantdatasets.Finding Data Some questions require running simulations ofa complex dynamic system. Datasets must be found to set upthe initial state. For example, an economic model may needthe current market price of different crops. In addition,datasets may be needed to support the analysis of differentscenarios. For example, different drought conditions can beexplored if datasets are found that contain climate forecasts.It may not be trivial to locate data repositories that containthe desired datasets.In all these cases, if the necessary data are not found, then thequestion cannot be pursued and has to be adjusted orabandoned.Phase III: Generating ResultsTo analyze the data available, a data analysis method isapplied to the data. In rare cases, a new method may need tobe developed as one of the subtasks to address the questionposed. But in most cases, there are widely-used provenmethods that can be applied to the data at hand. The analyticmethod is often discipline specific, but it can be general suchas statistical methods or machine learning algorithms. Forexample in population genomics a common method isassociation testing, while in document analysis a commonmethod is hierarchical clustering. In the case of simulations,setting up models is a key part of the method.Multi-Step Methods Over the years, we have implementedand/or executed hundreds of scientific data analysis methods.They always consist of multiple interdependent steps. Thesteps are executed in turn, often started by the scientist
through simple interfaces such as a command line invocationor a map-based application.General Methods We have found that scientists typicallyfollow a method as described in a publication or a methodthat is commonly used. At the same time, it is rare that alllabs have the same software: some labs prefer Python andothers R or Matlab. Therefore, even though the execution ofthe data analysis software is done with particular software,scientists have a concept of general methods in animplementation-independent manner. General methods areabstract plans. Abstract plan steps are decomposed intoseveral substeps or specialized into more specific substepsthat eventually bottom out in data analysis software that canbe executed. The main steps in the general method couldinvolve a simulation model or an empirical model. A mainstep in the method could also be a statistical function.Data Preparation General methods do not typically mentionsteps that are not critical to the method but are necessary forrunning its implementation.For example, datatransformation steps may be added as the general method iselaborated. Data preparation steps are always needed to preprocess data so it fits the requirements of the software usedto implement the main steps of the method.Results Once data analysis is executed, there will be acollection of results that needs to be aggregated in the nextstage. Associations may have been analyzed for each of thedatasets available, and now the individual results need to becombined. In other cases, hundreds of simulations usingdifferent parameter values may have been run, whoseindividual results would need to be combined in order toanswer the initial question. We have also seen cases whereseveral alternative analysis methods are run (i.e., an ensemblemethod), and combining their results helps increaseperformance or reduce uncertainty.Phase IV: Synthesizing FindingsThe individual results of the data analysis phase are thensynthesized into a set of overall findings. As was the case inthe prior phase, this requires identifying an existing methodor designing one. This might be as easy as taking an averageof the results, or some other statistical function. This issometimes called meta-analysis when the datasets werecollected independently (e.g., in different studies). When theinvestigation starts with a hypothesis, the finding must be insupport or against it (for example with a confidence valuebeing high or low).In extreme cases, analysis results are hard to aggregate intoconclusive findings of an investigation. For example, incancer omics we may look at data from several hundredpatients but there are different types of data available for each(for one it may be only genomic data, for another it may begenomic and also proteomic data from mass spectrometry,and for yet another it may be genomic data and proteomicdata from fluorescence imaging). In such extreme cases,scientists often consider the evidence separately for each typeof data, making the meta-analysis a straightforwardaggregation for each type of data.We found an interesting case in neuroscience, where thescientists do not run the data analysis, only the meta-analysis.They worked with several data providers who did not want toshare their data, but were willing to run the analysis in theirrespective sites and share the results. The scientists then didthe meta-analysis over those results.Phases V and VI: Integrating Findings withCurrent Knowledge and Formulating the NextInvestigationThe findings from data analysis are integrated with existingknowledge or theories, leading to revisions or extensions.The final phase includes prioritizing problems or questionsbased on their potential impact, refining problems intosubproblems or subquestions, and ultimately initiating newinvestigations so the cycle is back to Phase I.These two phases have not been the focus of our work sofar. They have been studied by others [Thagard 2012;Samuels and Wilkenfeld 2019; Addis et al 2016;Chandrasekharan, S. & Nersessian 2015].Capturing Scientific Reasoning for DataAnalysis InquiriesThis section describes the representations and reasoning inour implementation of four of the six phases of our cognitiveframework, namely: initiating the investigation, getting data,analyzing data, and aggregating results. We leave out twophases that will be subject of future work: the last phase ofintegrating findings with what is known, and the subsequentphase that re-iterates the cycle by formulating the nextinvestigation. We have used these representations indifferent systems that address different science domains andpurposes [Gil et al 2021; Gil et al 2017; Gil et al 2011].In describing these representations, we provide examplesusing a simplified, more readable format.In ourimplementations, we use semantic web representationstandards from the World Wide Web Consortium (W3C),including OWL, RDF, SPARQL, SWRL, and PROV [WorldWide Web Consortium 2022]. These languages haveexpressive limitations, but come with open-source tools andefficient off-the-shelf reasoners. Their limitations have notbeen an issue for our research so far, and there are manybenefits to doing our work on an open-source substrate. Inaddition, many scientists are familiar with these languages,as they are widely used in biomedicine and increasingly usedin other scientific disciplines.Initiating InvestigationsIn our framework, scientists provide the initial hypothesesand questions that initiate the investigations.We create a question ontology that includes classes ofobjects or concepts in the domain that can be used toformulate questions. For the cancer omics domain, our
question ontology included classes such as protein , gene ,and patient-sample . For the neuroscience domain, aquestion ontology can include classes such as genotype , brainCharacteristic , and demographicAttribute . Some of theterms may appear in existing domain ontologies, but theyhave to be agreed upon as valid terms for expressinghypotheses.We also formulate question templates, which are logicexpressions that includes variables of a type already includedin the question ontology, in addition to text that expresses thequestion being posed. Examples in neuroscience include:Is the effect of genotype in brainTrait associated with demographicAttribute ?Is the effect size of genotype on brainRegionTrait of brainRegion associated with demographic ?Then, scientists create question statements by specializingquestion templates. For example, from the last questiontemplate above the following question statement could beformulated:Is the effect of APOE in HyppocampalVolume associatedwith Age?As we mentioned, questions may need to be furtherspecified. We do this with domain-specific qualifiers thatneed to be defined using a qualifier ontology. For example,this question:What will be the increase in crop yield if there are item subsidies?may prompt the following qualifiers:What will be the increase in crop yield if there are item subsidies measured as potentialCropProduction , from beginDate to endDate , in region ?We have noticed that often times the scientists do nothave a choice in these qualifiers, as they may be determinedby the datasets that are available. For example, if data is onlyavailable for certain years, then the years selected will haveto be within that range. Therefore, for elaborating questionsto include all necessary qualifiers, we have developed in thepast user interfaces to elicit those qualifiers from users.Getting DataOnce the question is specified, it can be used to formulate theright queries that will get relevant data.Retrieving Data For retrieving data, we need to representdata queries. Those queries are then issued against the datarepository to retrieve the data. For that reason the queries areformulated using metadata attributes defined for the datarepository, otherwise an ontology mapping or translation stepwould be needed. The following is an example of a SPARQLquery to retrieve data for the second question template above:SELECT ?dataset WHERE {?cohort a Cohort .?cohort HasGeneticDataType ?Genotype .?cohort HasDataset ?dataset . }which requests a dataset from a study cohort that has thedesired genotype specified in the question. Note that the datarepository needs to offer appropriate metadata so that querieslike these can be formulated. Not all data repositories do, andin that sense our work creates new requirements for scientificrepositories in order to support automated data analysis.Finding Data For finding data, we start with an elaboratedquestion. For example, a question to generate crop yield in aregion with fertilizer subsidies would require running anagriculture model. Different agriculture models havedifferent data needs, but generally they would require dataabout soils and slopes and weather predictions. We representthe data requirements for each model, in this example interms of physical variables needed for soil and atmosphere:MODEL {Cycles} MODEL REQUIRES {soilThickness, surfaceSlope, soilMoisture, dailyMaxTemp,atmosphSaturation, dailyPrecipitationpVolume }and we know this is a useful model for the query because itgenerates the measurement that the query requires:MODEL {Cycles} MODEL GENERATES {potentialCropProduction }Now that we know what data is required, we issue dataqueries accordingly. For example, the following is a JSONquery to retrieve data for the model above:QUESTION REQUIRESVariables {soilThickness, surfaceSlope, soilMoisture, dailyMaxTemp,atmosphSaturation, dailyPrecipitationpVolume }SpatialCoverage Intersects { ?region}TemporalCoverage Intersects { ?beginDate ?endDate }We have found that if the scientist selects a specific modelfirst, that narrows down the data needs to those of that modelalone. But in some cases, it may be preferrable to run asmany models as there is data for. This is a good example ofhow these phases are not necessarily done sequentially, andscientists do backtrack and change some of their decisionsbased on what they see happening downstream. For example,they may have a question in mind but the data to run thenecessary models cannot be found, and if so the question willbe changed to adapt it to the data available. This back andforth is often done manually, doing web searches to findrelevant data that might support the desired model.Generating ResultsOnce the data is located, a method can be selected.Multi-Step Methods As we mentioned, we have found thatmethods typically consist of multiple interdependent steps.Most methods can be represented as a workflow, with inputdata and output data. Methods may involve iterating over
some steps while tweaking their setup and manually checkingthe results until the scientist is satisfied. If there is no needfor manual inspection, methods can be cast as workflows sothey are automatically executed by a workflow system. Weuse a workflow language to represent methods and theirexecution [Gil et al 2011].General Methods General methods can be represented asabstract plans. What we have found is that in most cases thegeneral methods are quite prescriptive, leaving little room fordecomposition or elaboration. That is, most general methodscan be described as skeletal plans, a special form of abstractplans where there is only specialization and nodecomposition [Friedland and Iwasaki 1985]. That is, eachstep in the skeletal plan is specialized into a more specificstep and the steps in the final plan have a one-to-onecorrespondence with the steps in the original skeletal plan.We have adapted these ideas to develop a workflowmanagement system that can specialize workflow templatesinto executable workflows, and can incorporate reasoningabout constraints in the process. This is described in detailelsewhere [Gil et al 2011]. For example, an abstract stepmight indicate the use of an agriculture model which can bespecialized to use specific models, or an abstract step couldbe to detrend a time series which can be specialized to lineardetrending or polynomial detrending.Data Preparation We also cast data preparation steps asworkflows. We find that they do not tend to use generalmethods, instead they are implemented by cutting corners tosave time. The cost of implementing data preparation oftendeters scientists from examining questions thoroughly. Theirautomation appears very feasible and very desirable.Synthesizing FindingsWe synthesize findings through meta-workflows. Our metaworkflows are implemented using the same workflowrepresentations, except they take as inputs the workflows thatgenerated the results. This is important, since the reasoningto synthesize and aggregate results needs to take into accountthe method and the implementation used to generate them.Our semantic web representations allow us to publiclypublish workflows by posting them on the Web with a uniquepersistent URL, and to access them through that URL as wellas all its constituent steps and intermediate datasets.desired characteristics of the dataset. Running a querytemplate returns dataset identifiers3. One or more workflow identifiers, with their input andoutput data as variables that can be linked to the datasetidentifiers that result from running the query template4. A meta-workflow with its input data as variables that canbe linked to workflow identifiersIn cases when an LOI is created for a hypothesis, thefinding returned by the meta-workflow must be in support oragainst the hypothesis or else a refinement of the hypothesisif evidence was found for it.When the user poses a question, it is matched against thequestion template in all available LOIs. The LOIs that matchare then triggered, which results in their query beingexecuted, then the workflows, and then the meta-workflow.LOIs are fundamental knowledge structures for science.They are often constructed as the investigation proceeds, andif properly captured they can be reused for subsequentinvestigations.ConclusionsWe presented a cognitive framework with six distinct phasesto model key aspects of scientific reasoning for data analysis.We also showed with examples our representations of theknowledge used about the data, methods, and meta-analysisin the four phases that we have addressed with our work. Theframework needs to be extended further to cover theimportant phases of integrating findings and formulatinginvestigations. Its application to new domains and problemswould be needed to evaluate it, as well as characterizing thenature of its limitations and designing appropriate futureextensions.The proposed framework can be used to guide thedevelopment of user interfaces and systems for scientific dataanalysis in new domains, by guiding requirements elicitation,ontology design, and process flow. The framework can alsobe used to characterize the role of different systems and toolsthat support scientific data analysis. These benefits areapplicable beyond science, as the framework is relevant moregenerally to the emerging field of data science as amethodological guide. The ultimate goal of this research isautom
2020], the formulation of hypotheses [Callahan et al 2011], or the design of laboratory experiments [Groth and Cox 2017]. . clinical omics, water quality, cancer multi-omics, neuroscience, hydrology, agriculture, climate, wildfire, disease spread, and economics [Zheng et al 2015; Gil et al . data is already preselected and is the center of the