Transcription
Systems Analysis and Design8th EditionChapter 5Data and Process Modeling
Chapter Objectives Describe data and process modeling conceptsand tools, including data flow diagrams, a datadictionary, and process descriptions Describe the symbols used in data flowdiagrams and explain the rules for their use Draw data flow diagrams in a sequence, fromgeneral to specific Explain how to level and balance a set of dataflow diagrams2
Chapter Objectives Describe how a data dictionary is used andwhat it contains Use process description tools, includingstructured English, decision tables, anddecision trees Describe the relationship between logical andphysical models3
Introduction In Chapters 5 & 6, you will develop a logicalmodel of the proposed system and documentthe system requirements– Logical model shows what the system must do– Physical model describes how the system will beconstructed4
Overview of Data and ProcessModeling Tools Systems analysts use many graphicaltechniques to describe an information system A data flow diagram (DFD) uses varioussymbols to show how the system transformsinput data into useful information5
Data Flow Diagrams A data flow diagram(DFD) shows how datamoves through aninformation system butdoes not show programlogic or processing steps A set of DFDs provides alogical model thatshows what the systemdoes, not how it does it6
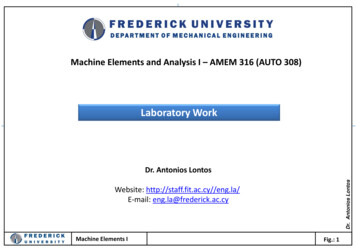
Data Flow Diagrams DFD Symbols7
Data Flow Diagrams DFD Symbols– Process symbol Receives input data and produces output that has adifferent content, form, or both Contain the business logic, also called business rules Referred to as a black box8
Data Flow Diagrams DFD Symbols– Data flow symbol Represents one ormore data items The symbol for a dataflow is a line with asingle or doublearrowhead Spontaneousgeneration Black hole Gray hole9
Data Flow Diagrams DFD Symbols– Data store symbol Represent data thatthe system stores The physicalcharacteristics of adata store areunimportant becauseyou are concernedonly with a logicalmodel10
Data Flow Diagrams DFD Symbols– Entity Symbol Name of the entityappears inside thesymbol Terminators Source Sink11
Creating a Set of DFDs Create a graphical model of the informationsystem based on your fact-finding results Three-step process– Step 1: Draw a context diagram– Step 2: Draw a diagram 0 DFD– Step 3: Draw the lower-level diagrams12
Creating a Set of DFDs Guidelines for Drawing DFDs– Draw the context diagram so that it fits on onepage– Use the name of the information system as theprocess name in the context diagram– Use unique names within each set of symbols13
Creating a Set of DFDs Guidelines for Drawing DFDs– Do not cross lines– Provide a unique name and reference number foreach process– Obtain as much user input and feedback aspossible14
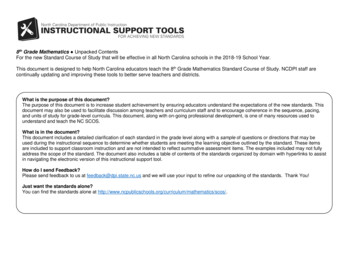
Creating a Set of DFDs Step 1: Draw a Context Diagram15
Creating a Set of DFDs Step 2: Draw a Diagram 0 DFD16
Creating a Set of DFDs Step 2: Draw a Diagram 0 DFD– If same data flows in both directions, you can usea double-headed arrow– Diagram 0 is an exploded view of process 0– Parent diagram– Child diagram– Functional primitive17
Creating a Set of DFDs Step 3: Draw the LowerLevel Diagrams– Must use leveling andbalancing techniques– Leveling examples Uses a series ofincreasingly detailed DFDsto describe aninformation system Exploding, partitioning, ordecomposing18
Creating a Set of DFDs Step 3: Draw the LowerLevel Diagrams– Balancing Ensures that the inputand output data flows ofthe parent DFD aremaintained on the childDFD19
Data Dictionary A data dictionary, or data repository, is acentral storehouse of information about thesystem’s data An analyst uses the data dictionary to collect,document, and organize specific facts aboutthe system Also defines and describes all data elementsand meaningful combinations of dataelements20
Data Dictionary A data element, also called a data item orfield, is the smallest piece of data that hasmeaning Data elements are combined into records, alsocalled data structures A record is a meaningful combination ofrelated data elements that is included in adata flow or retained in a data store21
Data Dictionary Using CASE Tools for Documentation– The more complex the system, the more difficult itis to maintain full and accurate documentation– Modern CASE tools simplify the task– A CASE repository ensures data consistency– You will learn more about CASE tools in Part 2 ofthe Systems Analyst’s Toolkit22
Data Dictionary Documenting the DataElements– You must documentevery data element inthe data dictionary– The objective is thesame: to provide clear,comprehensiveinformation about thedata and processes thatmake up the system23
Data Dictionary Documenting the Data Elements– The following attributes usually are recorded anddescribed Data element name and labelAliasType and lengthDefault valueAcceptable values - Domain and validity rules24
Data Dictionary Documenting the Data Elements– The following attributes usually are recorded anddescribed SourceSecurityResponsible user(s)Description and comments25
Data Dictionary Documenting the DataFlows– The typical attributes areas follows Data flow name or labelDescriptionAlternate name(s)OriginDestinationRecordVolume and frequency26
Data Dictionary Documenting the DataStores– Typical characteristics ofa data store are Data store name or labelDescriptionAlternate name(s)AttributesVolume and frequency27
Data Dictionary Documenting theProcesses– Typical characteristics ofa process Process name or labelDescriptionProcess numberProcess description28
Data Dictionary Documenting theEntities– Typical characteristics ofan entity include Entity nameDescriptionAlternate name(s)Input data flowsOutput data flows29
Data Dictionary Documenting theRecords– Typical characteristics ofa record include Record or data structurename Definition or description Alternate name(s) Attributes30
Data Dictionary Data Dictionary Reports– Many valuable reports An alphabetized list of all data elements by name A report describing each data element and indicatingthe user or department that is responsible for dataentry, updating, or deletion A report of all data flows and data stores that use aparticular data element Detailed reports showing all characteristics of dataelements, records, data flows, processes, or any otherselected item stored in the data dictionary31
Process Description Tools A process description documents the detailsof a functional primitive, which represents aspecific set of processing steps and businesslogic It should be noted that this chapter deals withstructured analysis, but the processdescription tools also can be used in objectoriented development, which is described inChapter 632
Process Description Tools Modular Design– Based on combinations of three logical structures,sometimes called control structures, which serveas building blocks for the process Sequence Selection Iteration - looping33
Process Description Tools Structured English– Must conform to the following rules Use only the three building blocks of sequence,selection, and iteration Use indentation for readability Use a limited vocabulary, including standard terms usedin the data dictionary and specific words that describethe processing rules34
Process Description Tools Structured English– Might look familiar to programming studentsbecause it resembles pseudocode– The primary purpose of structured English is todescribe the underlying business logic35
Process Description Tools Decision Tables– Shows a logical structure, with all possiblecombinations of conditions and resulting actions– It is important to consider every possible outcometo ensure that you have overlooked nothing36
Process Description Tools Decision Tables– The number of rules doubles each time you add acondition– Can have more than two possible outcomes– Often are the best way to describe a complex setof conditions37
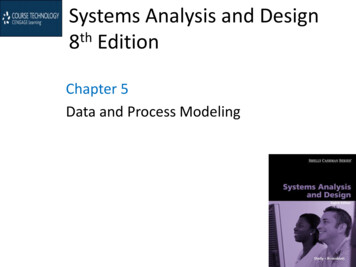
Process Description Tools Decision Trees38
Logical Versus Physical Models While structured analysis tools are used todevelop a logical model for a new informationsystem, such tools also can be used to developphysical models of an information system A physical model shows how the system’srequirements are implemented39
Logical Versus Physical Models Sequence of Models– Many systems analysts create a physical model ofthe current system and then develop a logicalmodel of the current system before tackling alogical model of the new system– Performing that extra step allows them tounderstand the current system better40
Logical Versus Physical Models Four-Model Approach– Develop a physical model of the current system, alogical model of the current system, a logicalmodel of the new system, and a physical model ofthe new system– The only disadvantage of the four-model approachis the added time and cost41
Chapter Summary During data and process modeling, a systemsanalyst develops graphical models to show howthe system transforms data into usefulinformation The end product of data and process modeling isa logical model that will support businessoperations and meet user needs Data and process modeling involves three maintools: data flow diagrams, a data dictionary, andprocess descriptions42
Chapter Summary Data flow diagrams (DFDs) graphically showthe movement and transformation of data inthe information system DFDs use four symbols A set of DFDs is like a pyramid with thecontext diagram at the top43
Chapter Summary The data dictionary is the centraldocumentation tool for structured analysis Each functional primitive process isdocumented using structured English, decisiontables, and decision trees Structured analysis tools can be used todevelop a logical model during one systemsanalysis phase, and a physical model duringthe systems design phase44
Chapter Summary Chapter 5 complete45
Describe data and process modeling concepts and tools, including data flow diagrams, a data dictionary, and process descriptions Describe the symbols used in data flow diagrams and explain the rules for their use Draw data flow diagrams in a sequence, from general to specific Explain how to level and balance a set of data flow .